
 ?Mathematical formulae have been encoded as MathML and are displayed in this HTML version using MathJax in order to improve their display. Uncheck the box to turn MathJax off. This feature requires Javascript. Click on a formula to zoom.
Abstract
Tissue barrier permeability plays a crucial role in determining the selective transport of substances across epithelial tissues, including drugs, cosmetic substances, and chemicals. The ability of these substances to cross through tissue barriers affects their absorption into the bloodstream and ultimately their effectiveness. Therefore, the determination of their permeability on these type of tissue barriers represents a useful tool for pharmaceutical and cosmetic industries as well as for toxicological studies.
In this regard, microfluidic devices and organ-on-chip technologies are becoming more important to generate reliable data. We have designed and performed an alternative new stratified epithelia-on-chip model that allows to correlate the Stokes radius and the diffusion of molecules and/or nanoformulations through the in vitro generated barrier and establish a system suitable for the analysis of diffusion through stratified epithelium. Thus, extrapolating from experimental data we can predict the Stokes radius for unknown fluorescent labelled particles within a molecular size range, such as gold nanoparticles.
Introduction
Organ-on-Chip (OoC) technology is deemed to play a transformative part in pharmaceutical R&D by substituting animal models, which often inaccurately model human physiology [Citation1]. In fact, OoC has become a powerful tool for drug development and substance testing [Citation2], like the area of dermatology, with the most widely used 3D in vitro models [Citation3]. In fact, after the animal testing ban on new cosmetic products, there was an increment in the development of novel advanced in vitro skin models. The huge impact of the ban on dermatology encouraged scientific and industrial societies to invest in new in vitro models, with a series of commercially available models being widely used for cosmetic and pharmaceutical purposes. Examples include EpiSkinTM (SM), EpiDerm™ SIT (EPI-200), SkinEthic™ RHE, LabCyte EPI-MODEL24 SIT, epiCS®, Skin+® and Phenion® skin models.
The air-liquid interface (ALI) is a common microenvironment of 3D skin culturing, and an essential element for proper epidermal differentiation [Citation4], being widely used in skin models with epidermal cell cultures over liquid-permeable membrane, nourished from a bottom channel. Thus, constructs without stratified epidermis can be improved when combined with ALI approach [Citation5]. Interestingly, this kind of devices allows for the determination of skin permeability coefficient, widely used to determine the quality of in vitro skin models, [Citation6] and that allows to determine the speed of migration from active substances through the skin. The determination of permeability coefficient in cosmetic products or drugs applied to the skin allows the understanding of how these substances pass through the epithelia. But, experimental values of skin permeability coefficients, required for dermal exposure assessment, are not readily available for many chemicals, with estimation approaches either no accurate or requiring many parameters not readily available. In fact, Quantitative Structure Permeability Relationships, molecular dynamics simulations, or dermal Physiologically Based Pharmaco Kinetics are only useful if they predict in vitro permeation tests and in vivo topical dermal performance, being able to scale up to in vivo situations. However, although most of the in vitro models are not able to precisely mimic the permeation of the skin, they have been useful in determining drug delivery after topical administration [Citation7]. New systems should be able to evolve the delivery of large drugs and biologicals, including different ways of administration [Citation8].
Traditionally, static Franz diffusion systems have been used for permeation quantification in skin models [Citation9], requiring few handlings of tissues, no continuous sample collecting, and a low amount of drug for analysis, aiming to the application of available flow systems from multiple markers. The drug or compound to be tested is disposed of in a top compartment, allowing it to diffuse through the skin sample, located between two compartments, to a second compartment in the bottom where is detected at a controlled temperature. However, Franz diffusion systems are large and not adequate when various pharmaceutical dosage forms for the same active molecule must be analysed, therefore, being necessary new approaches for skin permeability coefficient determination like OoC. Moreover, the permeability of in vitro models is often decreased compared to in vivo assay. This discrepancy can be settled by microfluidic epithelia-on-chips where the physicochemical microenvironment can be controlled, exposing the modeled tissue to fluid shear stress [Citation10]. However, current OoCs are often polydimethylsiloxane (PDMS) based fabrication, characterised by high gas permeability, losing the local control over the oxygen concentrations that affect barrier tissues.
Other plastic materials for microfluidics, optically transparent, with lower permeability to gas than PDMS and with resistance to small molecule permeation, include polycarbonate, polystyrene, poly(methyl methacrylate) (PMMA), Cyclic Olefin Polymer (COP) or Cyclic Olefin Copolymer (COC) [Citation11, Citation12]. Among them, FDA FDA-approved COP and COC with outstanding visible and UV optical transmittance, that provide great fluorescence imaging quality [Citation13]. These thermoplastics can be thermo-processed by low-cost- high commercial productions [Citation12] and applied in future high-throughput permeability studies. Therefore, we have selected an already fabricated COP microdevice to grow an epidermal layer formed by the immortalised keratinocyte cell line HaCaT to develop an epidermal on-chip model that allows easy permeation quantification of multiple pharmaceutical dosages from different fluorescent-labeled active molecules. We have validated the accuracy of the model by correlating the Stokes ratio of several compounds with different molecular weights with their empirically determined permeability coefficient. Moreover, we have determined the Stokes ratio from several synthesised nanoparticles by empirically quantifying their permeability coefficient and comparing the calculated Stokes ratios with the size distribution profiles determined using dynamic light scattering (DLS) and electron microscopy.
Materials and methods
Microfluidic device
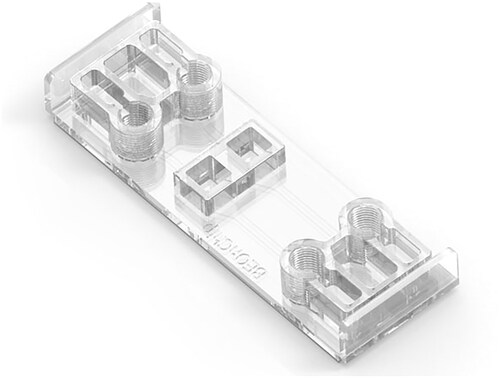
Stratified epithelia were grown on BE-Transflow devices from Beonchip company. The COP-based microdevice consists of two culture wells, each one communicated via a 1 µm porous polycarbonate membrane with their respective microfluidic channel where independent flowrates can be applied connecting any perfusion system. Evaporation reservoirs next to the medium reservoirs filled with PBS avoid evaporation of the system ().
Figure 1. Image of BE-transflow microdevice. Created by BEOnChip.
Biocompatibility of microfluidic devices
Following ISO 10993-5 international standards, the biocompatibility of microfluidic devices was evaluated by direct and indirect cytotoxicity assays and adhesion assays. Briefly, mouse L929 fibroblasts were seeded in microfluidic devices at 3.123x10⁴ of cells/cm2 density in all the assays with EMEM media (ATCC) supplemented with 10% foetal bovine serum (Sigma), 1% penicillin/streptomycin (Lonza) and 4 mM glutamine (Lonza) at 37 °C in humidified 5% CO2 atmosphere. Cells seeded in microfluidic devices were cultured for 24 h in direct cytotoxicity assays, and 4 h in adhesion assays. For the indirect assay, the medium was incubated in microfluidic devices for 24 h, next collecting medium and added as conditioned medium to a semi-confluent fibroblast monolayer and incubated again 24 h. Cell viability was quantified with In Vitro Toxicology Assay Kit, MTT-based (Sigma) following manufacturer’s recommendations. In the adhesion assay, cells seeded directly onto the culture plate were used as control reference, while in direct and indirect assays, cells without microdevice exposure were used as controls. Absorbance was recorded using the SynergyTM HT microplate reader (Biotek) at 570 nm with reference wavelength set at 690 nm. Cell viability was calculated using (testing sample OD570/untreated blank OD570) × 100. Four independent experiments were conducted with three replicates each.
Cell culture and stratified epithelia growth within microdevice
Human immortalised keratinocytes, HaCaT cells (ThermoFisher Scientific) were grown in T-flasks with DG10 medium composed of Dulbecco’s Modified Eagle Medium with 4.5 g/L glucose (Biowest) supplemented with 10% foetal bovine serum (Sigma), 1% penicillin/streptomycin (Lonza) and 1% L-glutamine (Thermo-Fisher) at 37 °C in humidified 5% CO2/95% air atmosphere. Cells were passaged every 2–3 days.
Reservoirs of preheated microdevices were filled with DG10 medium supplemented with 50 µg/mL ascorbic acid, seeding the upper well of the microdevice with 106 HaCaT cells resuspended in the same medium. Microdevices were placed on a rocker at minimum speed and incubated at 37 °C in humidified 5% CO2/95% air atmosphere, daily refreshing medium. Four days after seeding, the medium from over cell monolayer was removed to generate an air-liquid interface, only daily replacing medium in the reservoirs the following 10 days of culture.
Viability assays
Viability of HaCaT 3D cultures within microdevices 14 days after seeding was assessed by calcein/propidium staining. Briefly, 5 mg/mL Calcein AM (CAM) and 2 mg/mL Propidium Iodide (PI) solution were diluted in PBS to a final concentration of 5 and 4 µg/mL respectively, adding solution to the 3D culture on top and through the channels after removing cell culture medium from channels. Following 30 min incubation and further washing, samples were immediately visualised in a Leica Thunder Imager microscope with the excitation/emission settings for CAM (excitation filter 470/40, emission filter 525/50) and PI (excitation filter 546/10, emission filter 585/40). At least three independent experiments were analysed. Microscopy analysis was performed Fiji/ImageJ software, version 1.53q. Representative micrographs were chosen randomly from all samples in each experiment.
Histological analyses
3D cultures were collected from microdevices and incubated with paraformaldehyde at 4% for 15 min at room temperature, next washing three times with Dulbecco’s phosphate-buffered saline (PBS) for at least 5 min each wash and storing at −80 °C with OCT. Samples were cut with a cryostat at 20 µm thickness.
For histological analyses, sectioned slides were haematoxylin eosin stained, next mounting with DPX. Stained samples were visualised on a DMi8 Leica microscope. Next slides from cryostat were assessed by immunohistochemical analysis. Thus, slides were incubated for 10 min in a solution of 0.1% Triton X-100 in PBS, next washing three times with 0.05% Tween20 in PBS for 5 min each wash. After that, slides were incubated with 10% normal blocking goat serum in PBS for 45 min at room temperature followed by washing three times with PBS without Ca2+ and Mg2+ for at least 5 min each wash at room temperature. After blocking, slides were incubated overnight at 4 °C with polyclonal rabbit anti-Cytokeratin 14 (Sigma), mouse monoclonal anti-Cytokeratin 10 (clone RKSE60, Sigma), mouse monoclonal anti-Cytokeratin 2 (clone Ks2.342.7.4, Progen) antibodies or the respective isotype control, at 1:50 dilution. Next day, after rinsing three times, slides were incubated at room temperature for 90 min, with Alexa Fluor® 488 goat antimouse IgG (A11001, Thermosfisher) or goat antirabbit IgG FITCconjugate (AP307F, Chemicon, MERCK) in 1.5% normal blocking goat serum. Finally, after rinsing with PBS, slides were counterstained with DAPI (1:1000, ThermoFisher Scientific) for 15 min and analysed on a Leica DMI-8 microscope Thunder with an excitation wavelength of 495 nm and a filter pass of 519 nm. At least three slides per section were studied in three independent samples.
Permeability assay
For permeability assay, fluorescein sodium salt and fluorescein isothiocyanate-dextrans (FD) of 4000, 10,000, 20,000, and 40,000 g/mol molecular weight were tested. They were dissolved in DG10 medium supplemented with 50 µg/mL ascorbic acid, preparing dilutions of the donor substance at 0.1 mg/mL for establishing a standard curve. To determine permeability, 70 µL of the 0.1 mg/mL donor substance was displaced on the top of the stratified epithelia within the microdevices, collecting 100 µL from the lower reservoir over time, up to 8 h, renewing medium at a low reservoir each time. Microdevices were incubated on a rocker at minimum speed at 37 °C in a humidified 5% CO2/95% air atmosphere between collecting time points. Fluorescence was quantified at each time point using the SynergyTM HT microplate reader (Biotek) at 440/30 nm and 530/25 nm excitation and emission wavelengths respectively, along with the serial dilutions to convert the measured fluorescence into the equivalent concentration. At least three experiments were conducted for each donor assayed.
For calculating the permeability coefficient, the concentration of collected samples in the lower reservoir was calculated as mol/m3 from the standard curve and represented as a function over time to establish the linear progression. From the slope of this linear progression, the permeability coefficient was calculated according to the following equation derived from Fick’s First Law when the donor concentration is much higher than the acceptor concentration () [Citation14, Citation15]:
(Equation 1)
(Equation 1)
where
is the change of the acceptor concentration over time (calculated slope);
the donor concentration;
the permeability coefficient;
the permeation surface, and
the volume of the acceptor.
Nanoparticle synthesis
Deionised Milli-Q water (resistivity 18 MΩ cm) was used for all solutions and standards. Hydrogen tetrachloroaurate trihydrate (HAuCl4·3H2O, ≥99.9%), sodium citrate tribasic dihydrate (≥98%), silver nitrate (AgNO3, >99%), L-ascorbic acid (AA, >99%), Sodium hydroxide (NaOH, ≥98%), Tris(2-carboxyethyl) phosphine hydrochloride (TCEP, >99%) and (11-Mercaptoundecyl)hexa(ethylene glycol) (MUHEG, 90%), bis(psulfonatophenyl) phenylphosphine dipotassium salt (BSPP, 95%) were purchased from Sigma-Aldrich. Single-strand DNA (ssDNA) with a thiolated tag in the 5′end and Fluorescein in the 3′ end with (30 bases, MW = 10.257 g/mol) were purchased from IDT Integrated DNA Technologies with the following sequences 5′/thioMC6-D/AAA AAG GAG TGA GAT GAG AAG AAG GGT TGT/36-FAM/-3′ purified by standard desalting and analytical RP-HPLC.
MUHEG functionalised Au2 nanoparticles were prepared by in situ reduction of Au(III) salt with sodium borohydrate (NaBH4) in the presence of the ligand as previously described with some modifications [Citation16]. Briefly, a 0.025 M solution of HAuCl4 (0.024 mmol. 1 equiv.) in MilliQ water was added to a 0.012 M solution of thiolate ligand MUHEG (0.071 mmol. 3 equiv.) in MeOH. Then, a freshly prepared 1 M solution of NaBH4 (0.67 mmol. 28 equiv.) was added in portions to the mixture, immediately forming a black precipitate. The reaction was left on a shaker board (200 rpm) for 3h. Then, the reaction mixture was evaporated at reduced pressure and resuspended in 1 ml of MilliQ water. An additional purification step was performed by adding an equal volume of ethyl acetate, stirring the mixture for 48h. Next, the aqueous phase was collected and centrifuge 5 min at 1000 rpm, to collect the supernatant and filter through and amicon filter (MWCO 30000, 10 min) that removed any of the reactants. At this step, the nanoparticles were lyophilised and weighted.
For the synthesis of Au5 nm BSPP, 600 mg of BSPP was added into 150 ml of 1 mM aqueous solution of HAuCl4. The mixture was stirred for 5 min, adjusting the pH value of the reaction mixture to ∼12 using aqueous NaOH solution (1 M). Next, under vigorous stirring, 8 ml of aqueous sodium borohydride (NaBH4) solution (100 mM) was added quickly, which resulted in a gradual colour change into a light reddish-brown solution. After continued stirring for 3 min, the solution obtained was left to age at rest for 24 h to decompose residual NaBH4 [Citation17].
For functionalization of both precursor Au NPs with ssDNAS, first, a reduction pre-treatment of the commercially purchase ssDNA was performed by mixing 0.9 equivalent of TCEP with 1 equivalent of the ssDNA under shaking (200 rpm) for 30 min. Then an equal volume of 1 µM of both type of nanoparticles was incubated with 40 µM of the reduced ssDNA at 4 °C for 72 h. After that, the mixture was filtered through and amicon filter (MWCO 30000, 10 min) to remove any of the reactants. The functionalised nanoparticles were store refrigerated.
Nanoparticles characterisation
All the particles were fully characterised by different techniques. Thus, UV–Vis extinction spectra were obtained using an Agilent 8453 UV–Vis diode array spectrophotometer. Transmission electron microscopy (TEM) images were collected with a JEOL JM-1400 PLUS TEM operating at 120 kV, using carbon-coated 400 square mesh copper grids. Approximately 3 μL of the sample was dropped on a lacey carbon-coated grid and left to dry. The size distribution of the nanoparticles obtained was analysed using ImageJ software. Finally, the particle size distributions and ζ potential for AuNPs and AuNP–ssDNAs bioconjugates were obtained using Zetasizer Ultra Malvern Instrument Ltd (Malvern Instruments, Herrenberg, Germany). Thirty runs of 5 s per measurement were acquired from filtered samples equilibrated for 5 min at 25 °C to determine the hydrodynamic diameter. For zeta potential, 23 runs per measurement from three independent samples dispersed in deionised distilled water were performed at 20 V of voltage using disposable DTS1070 cuvettes.
Statistical analysis
Statistical analysis in biocompatibility assays was performed with SPSS software, version 21.00.1, expressing data as means ± standard deviation and differences were considered significant for comparison of groups using ANOVA, Tukey’s Post Hoc Test when p < 0.05. Normality test was performed to confirm a normal distribution.
The data of Stokes radius and permeability coefficient from permeability assays was fitted using Weighted Least Squares (WLS) procedure, in order to consider the data uncertainty in the permeability coefficient measurement, using Matlab curve fitting toolbox.
Results and discussion
BE-Transflow microdevice is biocompatible
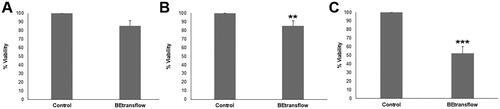
ISO 10993 series of standards are recognised in both the European Union and the United States, with ISO 10993-5 describing test methods to assess the in vitro cytotoxicity of medical devices and specifying the incubation of cultured cells in contact with a device and/or extracts of a device either directly or through diffusion. According to the described international standard ISO 10993-5, we performed three different kinds of assays, comparing the viability with 96 well-plates as control. First, we studied the direct contact cytotoxicity of BE-transflow microdevice with an L929 cell line, accepted by regulatory agencies, such as the U.S. Food and Drug Administration (FDA) and the European Medicines Agency (EMA), ensuring compliance and facilitating the approval process for medical devices. The percentage of live cells after incubating the L929 cell line in BE-transflow microdevices (direct contact test) was very high in all cases (above 80%), without statistical differences with controls (.). However, a statically significant (p < 0.005) viability decrease was quantified when we studied the cytotoxicity provoked by the contact of the leachate (medium that had been in contact with BE-transflow microdevice, indirect test) on L929 cell line after 24 h of incubation (). According to ISO assessment, a reduction in cell viability by more than 30% is considered as a cytotoxic effect or cytotoxic potential, and therefore, we can conclude the lack of remarkable cytotoxic effect of BE-transflow microdevice. The lack of cytotoxicity by both methods represents evidence of the microdevice biocompatibility [Citation18]. Finally, we also quantified the adhesion to the microdevice based on the MTT assay. As expected, significant differences (p < 0.001) were detected compared to control after 4 h of incubation () since the porous membrane surface for adhesion in the BE-trans flow microdevices is smaller than a 96-well plate, therefore reducing the number of cells that can adhere.
Figure 2. Biological evaluation of BE-transflow microdevices according to ISO 10993-5 standards. (a) Direct contact assay. (b) Indirect contact assay. (c) Adhesion assay. **p < 0.005 ***p < 0.001 compared with control.
Stratified epithelia growth within microdevice
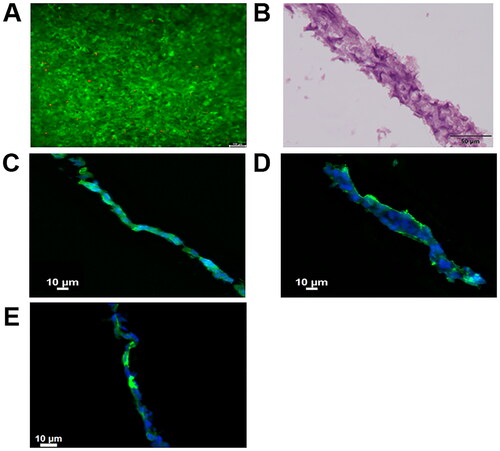
BE-transflow microdevices allow epidermal cells 3D culture with the air-liquid interface (ALI) within an open chamber. Therefore, we seeded HaCaT cells, an immortalised human keratinocyte cell line, on top of the porous membrane within the BE-transflow microdevices, feeding cells continuously from the lower channel, and adding culture medium on the top of the cell culture only the first 4 days after seeding. After 14 days, a layer sealing the porous membrane was formed. When raised culture medium from the lower channel was observed after ALI establishment, microdevices with 3D culture were discarded. We first analysed the viability of the 3D culture by calcein staining. We could observe that viability was homogeneous all over the layer (), suggesting the presence of stratum basale, spinosum or granulosum, the viable strata in skin, without stratum corneum development in HaCaT 3D structure after 14 days of culture [Citation19]. In fact, haematoxylin-eosin-stained frozen sections microdevice after 14 days in the culture of the composite structure of the hydrogel collected from the open chamber within the BE-trans flow revealed a stratified epithelium (). Moreover, cytokeratin-14 expression was assessed by immunohistochemistry, correlated with the mitotic activity and the degree of pluripotency of the basal cells in stratified epithelia, confirming stratum basale formation () [Citation20]. Similarly, stratum spinosum and granulosum formation were confirmed by cytokeratin-10 and cytokeratin-2 expression, type I and II keratins expressed in the postmitotic keratinising cells in the suprabasal layers of the epidermis, and other cornifying stratified epithelia, respectively [Citation21] ().
Figure 3. (A) Calcein/propidium Iodide microscopy images at 14 days after HaCaT cells seeding, green and red fluorescence denote live and dead cells, respectively. (B) Haematoxylin-eosin staining of stratified epithelia cross section after 14 days. (C) Cytokeratin 14, (D) Cytokeratin 10 and (E) Cytokeratin 2 staining of stratified epithelia cross section after 14 days in green. Cell nuclei were counterstained with DAPI (blue).
Permeability coefficient correlates with Stokes radius in the stratified epithelia dynamic model
After developing HaCaT stratified epithelia within the COP-based devices and confirming the presence of the three epidermal layers, we proceeded to determine the permeability coefficient of fluorescein in our model. Fluorescein is a small dye with a Stokes radius of 0.5 nm, without temperature sensitivity in ranges between 20 and 40 °C [Citation22]. First, we quantified the permeation of fluorescein over 8 h and determined the permeability coefficient (Equation 1) from the linear slope in the permeation curve (). However, fluorescein permeation was quick due to the low Stokes radius of the dye, no detect a linear slope in these experiments. Thus, we quantified fluorescein permeation during shorter intervals over 4 h, successfully determining the linear slope of the permeation curve, where we calculated fluorescein permeability coefficient in our model from, with a mean value of 0.28 ± 0.27 × 10⁻⁸ m/s (), in a similar range to those observed with fluorescein in human corneal endothelium [Citation23]. Next, we followed the same procedure to quantify the coefficient permeability of FITC-labelled dextrans with molecular weights from 4000 up to 40000 Da, since dextrans with molecular weights over 70000 Da have shown no permeation in stratified epithelia either growth in transwells or bilayer microfluidic devices [Citation24]. Although dextrans are randomly coiled linear polymers, not approximated to globular proteins, their ready availability in large quantities, their purity, stability, and ease of detection makes them ideal candidates as screening probes in diffusion experiments, even when their elongated nature leads to inaccuracies in estimating molecular radii based on diffusional properties [Citation25]. Concisely, we studied dextrans with molecular weights of 4, 10, 20 and 40 kDa whose Stokes radius are 1.4, 2.3, 3.3 and 4.5 nm respectively, as described by the provider. Permeation curve slopes at 37 °C were significantly higher than described in static cultures in epidermal or endothelial barriers probably due to the presence of the shear stress [Citation24, Citation26]. We observed that the amount of accumulated collected dextran decreased as the molecular weight of the dextran increased, providing lower permeation curve slopes with increased molecular weight (. C.) and indicating that paracellular transport is adversely affected by increasing molecular size [Citation24]. In contrast to static cultures, larger molecular size compounds generated smaller deviations in each time point quantified, without any delay at the beginning of the graphs [Citation27]. Thus, we determined fluorescein permeability coefficients of 0.59 ± 0.11 0.33 ± 0.08, 0.41 ± 0.05 and 0.25 ± 0.25 × 10⁻⁸ m/s with dextrans with molecular weights of 4, 10, 20 and 40 kDa respectively.
Figure 4. (A) Permeability of fluorescein (mol/m−3x103) quantified overtime every 30 min up to 8 h (B) Permeability of fluorescein (mol/m−3x103) quantified overtime every 10 min up to 4 h (C) Permeability of fluorescein isothiocyanate-dextrans (dextran) of 4000, 10,000, 20,000, and 40,000 g/mol molecular weight (mol/m−3x103) quantified overtime every 30 min up to 8 h (D) Weighted least‐Squares fitting between calculated permeability coefficient (m/sec)x10−8 from quantified permeability and the inverse of the described Stokes radius ((m−1)x109)) from the studied fluorescein isothiocyanate-dextrans represented.
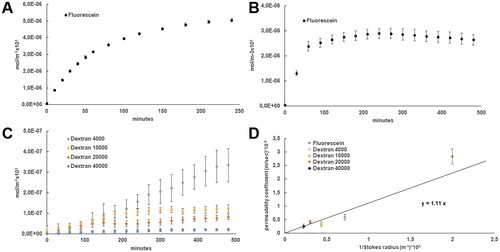
Interestingly, we were able to correlate the Stokes radius of each studied compound and its permeability coefficient in the stratified epithelia subjected to shear stress on the bottom, using a linear regression between the inverse of the former and the latter (). Indeed, the permeability coefficient (P) of a membrane may be related to the particle diffusion coefficient and the membrane thickness
by the expression [Citation28]:
(Equation 2)
(Equation 2)
The diffusion coefficient may be expressed, thanks to the Einstein-Smoluchowski Equation [Citation29] as:
(Equation 3)
(Equation 3)
where
is the particle hydrodynamic mobility,
is the temperature and
is Bolzmann ‘s constant. For a spherical particle in low Reynold’s number regime, Stoke’s relation [Citation30] states that
(Equation 4)
(Equation 4)
where
is the fluid viscosity and
is the sphere radius. Combining Equations (2), (3) and (4) we get an expression that correlates the permeability coefficient with Stokes radius:
(Equation 5)
(Equation 5)
Therefore, we may state that with
and
since all the experiments were performed at the same conditions, so
and
may be assumed as constants, and consequently, the data
assumed to follow a linear relationship. Fitting data with the Weighted Least Squares procedure, in order to consider the data uncertainty in the permeability coefficient measurement, we obtained a coefficient of determination of
and a reduced
chi-squared of
with a line slope of
Therefore, it was confirmed the linear correlation between both parameters, permeability coefficient, and Stokes radius, indicates that they comply with the Stokes–Einstein equation, for the diffusion of spherical particles through a liquid with a low Reynolds number. This correlation allows us to estimate an unknown Stokes radius by determining the permeability coefficient, or vice versa, to estimate the permeability coefficient from a known Stokes radius.
Stokes radius determination of nanoparticles by permeability coefficient
Nanocarriers have been extensively studied on the subcellular level for drug delivery applications. However, the number of studies on the use of nanoparticles (NPs) as an alternative to overcome the limited epithelia penetration of possible therapeutic elements is more limited. Physicochemical properties of NPs like size, surface charge, shape, chemical functionalities, influence the penetration due to the differences in their interactions with epithelium biological components, such as skin. Specifically, several studies have described how nanoparticles’ features affect the transdermal delivery of Au NPs in human skin [Citation31, Citation32]. In this regard, one of the most interested active molecules for topical delivery is genetic material. In the field of gene delivery, the use of Au NPs carrying nucleic acids are promising alternative because they reduce enzymatic degradation while ensuring high loading capacity and targeting properties. Thus, for example, Zheng. et al. have reported gene regulation and transfection efficiencies in the human epidermis using spherical nucleic acid Au NPs [Citation33].
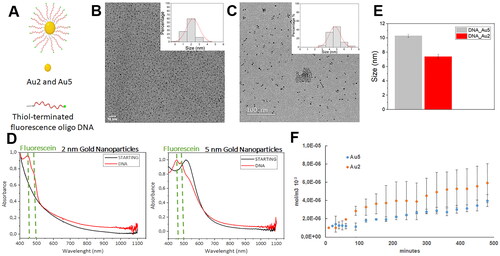
We synthesised gold nanoparticles with two different sizes (hereafter referred as Au2 and Au5) modified with a dense oligonucleotide shell to estimate their Stokes radius with our stratified epithelia dynamic model. For this purpose, we prepared FAM-labelled oligonucleotide nanocarriers made from 5′ FAM-labelled, 3′ thiol derivative single-stranded model DNA oligonucleotides (FAM-ssDNA, Figure (.A)) covalently attached to the surface of NPs by ligand exchange reaction from the corresponding precursors BSPP-coated 5 nm and MUHEG-coated 2-nm Au NPs. After analysing the acquired images from TEM, a normal size diameter distribution of 1.8 ± 0.4 nm and 4.7 ± 0.3 nm was obtained for Au2 and Au5 respectively (–C)). After isolating DNA particles conjugated from free, unreacted thiol-oligonucleotides by centrifugal filtering, UV/Vis spectrum of conjugates confirmed the presence of FAM ssDNAs on the nanoparticles, as indicated by the peak at 450 nm of the FAM dye (). The spectrum also showed the plasmon band at 515 nm in Au5 NPs, a typical feature of particles larger than 3.5 nm. Successfully functionalization achievement was also confirmed by the modification in z-potentials between precursor and DNA-conjugated Au NPs (Figure S1). Finally, we determined a hydrodynamic diameter of 7.4 ± 0.3 and 10.3 ± 0.2 nm for Au2 and Au5 respectively by dynamic light scattering (DLS) (), providing bigger diameters than those determined with TEM, since TEM observes sample in a dry, most compact state, whereas DLS in a solvated state where solvent molecules are associated with the particle providing higher diameter values. In fact, particle size observed by DLS is different in different solvents or mixtures and temperatures, or even at different NPs concentrations [Citation34, Citation35]. Polydispersity index (PDI) derived from DLS measurements of ssDNA-modified Au nanoparticles (PDI= 0.3 for Au5 and 0.5 for Au2) were in the range with good monodispersity (0.05 to 0.5), corroborated by the histogram distributions obtained with TEM size characterisation from a high number of particles (200 nanoparticles for Au2 and 770 nanoparticles for Au5, ). Moreover, since aggregation of big gold nanoparticles can be detected by UV-Vis spectroscopy, we compared the UV-Vis spectra of Au5 nanoparticles dispersed in citrate or BSPP stabiliser solution, showing the lack of aggregation of Au5 nanoparticles when dispersed in BSPP, as shown by the shift and broadening of the plasmon band at 520 nm−1 after NaCl 10 mM treatment (Figure S2). Therefore, we can confirm that Au nanoparticles were water-soluble, and colloidally stable, with no signs of aggregation. We next proceeded to determine the permeability coefficient of both nanoparticles, Au2 and Au5 in the stratified epithelia within the COP-based microfluidic device following a similar procedure to fluorescein and FITC labelled-dextrans. Since we could not anticipate nanoparticles behaviour, we quantified the number of collected nanoparticles every 10 min from the first hour, but we were not able to detect a linear slope. Therefore, we began to quantify every 30 min for 8 h and we were able to determine the linear slope, as previously described with dextrans. As expected, Au5 with higher molecular weight than Au2, provided lower permeation curve slopes but higher deviations in each time point quantified, without any delay at the beginning of the graphs (), similar to static cultures [Citation27]. From the linear slope, we calculated the permeability coefficient for each nanoparticle getting values of 0.72 ± 0.31 and 0.41 ± 0.27 × 10⁻⁸ m/s for Au2 and Au5 respectively. Next, we calculated the Stokes radius and its uncertainty for each nanoparticle with the equation previously determined by fitting fluorescein and dextrans permeability coefficient and the respective Stokes radius with Weighted Least Squares (WLS) procedure (Equation 5 with the previously adjusted value of The expression of the Stokes radius and its uncertainty were obtained directly from Equation (5) (using standard quadratic uncertainty propagation), resulting in:
(Equation 6a)
(Equation 6a)
(Equation 6b)
(Equation 6b)
where,
and
are the values of the permeability and the slope coefficient and
and
their uncertainties, respectively. Note that Equation 6a implies that an overestimation of the permeability results in an underestimation of the Stokes radius and Equation 6b indicates that the precision limit also decreases with the permeability. Thus, we obtained values of 1.6 ± 0.7 and 2.7 ± 1.8 nm for Au2 and Au5 respectively, in accordance with those observed by TEM in both types of nanoparticles, although slightly higher. This difference can be due to molecules from the culture medium associated with the nanoparticles affecting the permeability, not quantified under TEM observations. However, the estimated radii determined from permeability in the stratified epithelia-on-chip do not reach the hydrodynamic radii quantified by DLS, which similarly to TEM, can be attributed to the different solvents used in both determinations or by the temperature [Citation36] with permeability studies performed at 37 °C and DLS at 25 °C. Thus, if the shape of a particle changes affecting the diffusion speed, such as the conformation of proteins and macromolecules dependent on the exact nature of the dispersing medium, then the hydrodynamic size will change, being detected by DLS. For example, it has been described that the acid-unfolded state from proteins shows twice the radius of the native state [Citation37]. In fact, all particle-sizing techniques have inherent problems describing the size of non-spherical particles, producing different mean sizes and size distributions for any given sample, including microscope images with parameters such as edge contrast affecting them for example. Therefore, there is no inherently right results. However, real conditions are not always represented in DLS, like the presence of biological barriers. Therefore, models like the described stratified epithelia-on-chip represent closer alternative models to determine more accurate Stokes radius related to diffusion when this kind of biological barrier are the focus of interest, being extensive to epithelia from skin, intestine, kidney, or lung. Moreover, since the BE-Transflow microfluidic platform can be assembled to current medium throughput screening techniques, integrating in-situ sensors to enable efficient online monitoring and control of tissue cultures will allow a complete and automatic monitorization of permeability effects in the epithelia-on-chip, reducing experimental efforts. In conclusion, the further development of the presented epithelia-on-chip platform will enable the cost-effective and reliable determination of Stokes radius in a more physiological microenvironment from topical ingredients for pharma and cosmetic industry.
Figure 5. (A) Schematic representation of FAM-labelled oligonucleotide nanocarriers. Transmission electron microscopy representative micrographs. and diameter determination after acquired image analysis of Au2 (B) and Au5 (C) DNA conjugated-nanoparticles suspensions. (D) UV-vis spectra of unlabelled (STARTING Au2 and Au 5 NPs black curves) and labelled ssDNA functionalised Au2 and Au NPs (DNA, red curves) (E) Hydrodynamic diameter of Au2 and Au5 by dynamic light scattering (DLS) (F) Permeability of functionalised Au2 and Au5 nanoparticles (mol/m−3x103) quantified overtime every 10 min from the first hours and every 30 min for 8 h.
Authors’ contributions
EFC, RSC, LA and HCA were involved in conception and design, RSC in conception and design, JAJ, MMA, IO and AC in analysis and interpretation of the data; the drafting of the paper and revising it critically for intellectual content; and IG and JC in conception and design, analysis and interpretation of the data; the drafting of the paper, revising it critically for intellectual content; and the final approval of the version to be published.
Supplemental Material
Download TIFF Image (1.9 MB)Supplemental Material
Download TIFF Image (2.2 MB)Disclosure statement
The authors report there are no competing interests to declare.
Data availability statement
Data is available on request from the authors. The data that support the findings of this study are available from the corresponding author, [JC], upon reasonable request.
Correction Statement
This article has been corrected with minor changes. These changes do not impact the academic content of the article.
Additional information
Funding
References
- Balijepalli A, Sivaramakrishan V. Organs-on-chips: research and commercial perspectives. Drug Discov Today. 2017;22(2)p. :397–403. doi: 10.1016/j.drudis.2016.11.009.
- Marx U, Walles H, Hoffmann S, et al. Human-on-a-chip’ developments: a translational cutting-edge alternative to systemic safety assessment and efficiency evaluation of substances in laboratory animals and man? Altern Lab Anim. 2012;40(5):235–257. p. doi: 10.1177/026119291204000504.
- Randall MJ, Jüngel A, Rimann M, et al. Advances in the biofabrication of 3D skin in vitro: healthy and pathological models. Front Bioeng Biotechnol. 2018;6:154. doi: 10.3389/fbioe.2018.00154.
- Pruniéras M, Régnier M, Woodley D. Methods for cultivation of keratinocytes with an air-liquid interface. J Invest Dermatol. 1983;81(1 Suppl):28s–33s.
- Lee OJ, Ju HW, Kim JH, et al. Development of artificial dermis using 3D electrospun silk fibroin nanofiber matrix. J Biomed Nanotechnol. 2014;10(7):1294–1303. p. doi: 10.1166/jbn.2014.1818.
- Ackermann K, Borgia SL, Korting HC, et al. The phenion full-thickness skin model for percutaneous absorption testing. Skin Pharmacol Physiol. 2010;23(2):105–112. p. doi: 10.1159/000265681.
- Roberts MS, Cheruvu HS, Mangion SE, et al. Topical drug delivery: history, percutaneous absorption, and product development. Adv Drug Deliv Rev. 2021;177:113929. doi: 10.1016/j.addr.2021.113929.
- Mohammed Y, Holmes A, Kwok PCL, et al. Advances and future perspectives in epithelial drug delivery. Adv Drug Deliv Rev. 2022;186:114293. doi: 10.1016/j.addr.2022.114293.
- Salamanca CH, Barrera-Ocampo A, Lasso JC, et al. Franz diffusion cell approach for pre-formulation characterisation of ketoprofen semi-solid dosage forms. Pharmaceutics. 2018;10(3):148. doi: 10.3390/pharmaceutics10030148.
- van der Helm MW, van der Meer AD, Eijkel JCT, et al. Microfluidic organ-on-chip technology for blood-brain barrier research. Tissue Barriers. 2016;4(1):e1142493. p. doi: 10.1080/21688370.2016.1142493.
- Gencturk E, Mutlu S, Ulgen KO. Advances in microfluidic devices made from thermoplastics used in cell biology and analyses. Biomicrofluidics. 2017;11(5):051502. doi: 10.1063/1.4998604.
- Ren K, Zhou J, Wu H. Materials for microfluidic chip fabrication. Acc Chem Res. 2013;46(11)p. :2396–2406. doi: 10.1021/ar300314s.
- Mottet G, Perez-Toralla K, Tulukcuoglu E, et al. A three dimensional thermoplastic microfluidic chip for robust cell capture and high resolution imaging. Biomicrofluidics. 2014;8(2):024109. doi: 10.1063/1.4871035.
- Netzlaff F, Kaca M, Bock U, et al. Permeability of the reconstructed human epidermis model Episkin in comparison to various human skin preparations. Eur J Pharm Biopharm. 2007;66(1):127–134. p. doi: 10.1016/j.ejpb.2006.08.012.
- Schimek K, Busek M, Brincker S, et al. Integrating biological vasculature into a multi-organ-chip microsystem. Lab Chip. 2013;13(18):3588–3598. p. doi: 10.1039/c3lc50217a.
- Climent N, García I, Marradi M, et al. Loading dendritic cells with gold nanoparticles (GNPs) bearing HIV-peptides and mannosides enhance HIV-specific T cell responses. Nanomedicine. 2018;14(2):339–351. p. doi: 10.1016/j.nano.2017.11.009.
- Hao Y, Li Y, Song L, et al. Flash synthesis of spherical nucleic acids with record DNA density. J Am Chem Soc. 2021;143(8):3065–3069. p. doi: 10.1021/jacs.1c00568.
- Hexig B, Nakaoka R, Tsuchiya T. Safety evaluation of surgical materials by cytotoxicity testing. J Artif Organs. 2008;11(4)p. :204–211. doi: 10.1007/s10047-008-0429-0.
- Schoop VM, Mirancea N, Fusenig NE. Epidermal organization and differentiation of HaCaT keratinocytes in organotypic coculture with human dermal fibroblasts. J Invest Dermatol. 1999;112(3)p. :343–353. doi: 10.1046/j.1523-1747.1999.00524.x.
- Coulombe PA, Wawersik M, Paladini RD, et al. Type I keratin 16 forms relatively unstable tetrameric assembly subunits with various type II keratin partners: biochemical basis and functional implications. Biol Bull. 1998;194(3):364–366. p. discussion 365-6. doi: 10.2307/1543114.
- Bragulla HH, Homberger DG. Structure and functions of keratin proteins in simple, stratified, keratinized and cornified epithelia. J Anat. 2009;214(4):516–559. doi: 10.1111/j.1469-7580.2009.01066.x. Spicer G, et al. Universal guidelines for the conversion of proteins and dyes into functional nanothermometers. J Biophotonics. 2019;12(9):e201900044.
- Spicer, G., Efeyan, A., Adam, P.A., Sebastian, A.T. et al., Universal guidelines for the conversion of proteins and dyes into functional nanothermometers. J Biophotonics, 2019. 12(9):1–25. p. e201900044.
- Ota Y, Mishima S, Maurice DM. Endothelial permeability of the living cornea to fluorescein. Invest Ophthalmol. 1974;13(12):945–949.
- Frost TS, Jiang L, Lynch RM, et al. Permeability of epithelial/endothelial barriers in transwells and microfluidic bilayer devices. Micromachines (Basel). 2019 Aug 13;10(8):533. pages 1–18, doi: 10.3390/mi10080533.
- Hussain AA, Starita C, Hodgetts A, et al. Macromolecular diffusion characteristics of ageing human Bruch’s membrane: implications for age-related macular degeneration (AMD). Exp Eye Res. 2010;90(6):703–710. doi: 10.1016/j.exer.2010.02.013.
- Thomas A, Wang S, Sohrabi S, et al. Characterization of vascular permeability using a biomimetic microfluidic blood vessel model. Biomicrofluidics. 2017;11(2):024102. p. doi: 10.1063/1.4977584.
- Hsu HH, et al. A method for determination and simulation of permeability and diffusion in a 3D tissue model in a membrane insert system for multi-well plates. J Vis Exp. 2018 Feb 23;(132):56412. pages 1–12, doi: 10.3791/56412.
- Zwolinski BJ, Eyring H, Reese CE. Diffusion and membrane permeability. J Phys Chem. 1949;53(9)p. :1426–1453. doi: 10.1021/j150474a012.
- Dill KA, Bromberg S, Stigter D. Molecular driving forces: statistical thermodynamics in biology, chemistry, physics, and nanoscience (2nd ed.). Taylor & Francis: Garland Science., 2010.
- Landau LD, Lifshitz EM. Fluid mechanics: landau and lifshitz: course of theoretical physics. Elsevier. 2013;6, 227-237.
- Fernandes R, Smyth NR, Muskens OL, et al. Interactions of skin with gold nanoparticles of different surface charge, shape, and functionality. Small. 2015;11(6):713–721. p. doi: 10.1002/smll.201401913.
- Sonavane G, Tomoda K, Sano A, et al. In vitro permeation of gold nanoparticles through rat skin and rat intestine: effect of particle size. Colloids Surf B Biointerfaces. 2008;65(1):1–10. p. doi: 10.1016/j.colsurfb.2008.02.013.
- Zheng D, Giljohann DA, Chen DL, et al. Topical delivery of siRNA-based spherical nucleic acid nanoparticle conjugates for gene regulation. Proc Natl Acad Sci U S A. 2012;109(30):11975–11980. p. doi: 10.1073/pnas.1118425109.
- Beliciu CM, Moraru CI. Effect of solvent and temperature on the size distribution of casein micelles measured by dynamic light scattering. J Dairy Sci. 2009;92(5)p. :1829–1839. doi: 10.3168/jds.2008-1467.
- Zheng T, Bott S, Huo Q. Techniques for accurate sizing of gold nanoparticles using dynamic light scattering with particular application to chemical and biological sensing based on aggregate formation. ACS Appl Mater Interfaces. 2016;8(33)p. :21585–21594. doi: 10.1021/acsami.6b06903.
- Ren G. The effective hydrodynamic radius in the Stokes–Einstein relation is not a constant. Commun Theor Phys. 2022;74(9)p. :095603. doi: 10.1088/1572-9494/ac7130.
- Goto Y, Calciano LJ, Fink AL. Acid-induced folding of proteins. Proc Natl Acad Sci U S A. 1990;87(2)p. :573–577. doi: 10.1073/pnas.87.2.573.