
 ?Mathematical formulae have been encoded as MathML and are displayed in this HTML version using MathJax in order to improve their display. Uncheck the box to turn MathJax off. This feature requires Javascript. Click on a formula to zoom.
ABSTRACT
This study comes up with a new insight into the area of pricing strategy to include consumer perspective under duopolistic competition. Two firms with vertically differentiated products are investigated to compete against price and quality. The implication of outsourcing decisions as one operational strategy carried out by a firm that offers a product with lower price and quality is examined. We consider several components of cost, namely in-house production, quality loss, and outsourcing costs. Market share is calculated using the concept of consumer utility and marginal valuation. Since both firms compete in terms of product prices, the optimal prices must be determined to obtain the equilibrium condition. In addition to profit maximization, this model also aims to minimize the gap between consumer and firm utilities. By optimizing the model sequentially, we obtain the optimal solution regarding product prices, dimensional tolerances, and outsource proportion.
1. Introduction
In the era of business modernization with a relatively tight competition, industrial firms are required to improve their capabilities and competencies in mastering the market share to obtain maximum profits. Strategic pricing and quality determination should be undertaken if firms engaged in markets with intense competition, such as oligopoly market (Sun, Li, & Wang, Citation2015). Oligopoly is one condition in which there are several (two or more) firms that have dominant control over the market. The oligopoly market structure is characterized by interdependencies between firms, intense competition, product differentiation, and barriers to enter or exit the market (Frank, Citation2003). The oligopoly market structure is generally experienced by industries with high capital intensive such as software and computer industry, automobile industry, and mobile phone industry.
In this kind of competition, firms seek to expand its market share in order to win the competition and become the market leader. According to Buzzel, Gale, and Sultan (Citation1975), a firm is said to win the competition if the firm has a great dominance in terms of sales and market share. In order to increase sales and market share, product price and quality should be determined in accordance with consumer preferences. Consumer preference is one factor that is very influential on sales and market share of a firm. Consumers have a certain tendency in choosing which product to be purchased. The tendency of consumers to choose a product is affected by several criteria, such as price and quality level (Ronnen, Citation1991). In addition, consumers also consider the brand and market share in choosing a product (see, e.g. Thevenot, Steva, Okudan, & Simpson, Citation2007; Zia & Sohail, Citation2016). Meanwhile, according to Bae, Yoo, and Sarkis (Citation2010), the decision to outsource affects consumer perceptions in making purchasing decisions. Consumers perceive the outsourced products have lower quality than the original in-house produced products (Bae et al., Citation2010).
Mussa and Rosen (Citation1978) explained that consumer tendency to make purchases can be modeled mathematically with the concept/theory of utility. The utility theory was first developed by von Neumann and Morgenstern (Citation1944) in order to pay attention to individual preferences and decisions. The initial idea was developed based on consumer choice to buy products that tend to maximize its utility with budget constraint (Levin & Milgrom, Citation2004). The utility theory has been widely applied by many economists to determine the equilibrium price and market share. The study of utility theory in describing consumer preferences was first developed by Mussa & Rosen (Citation1978). In this research, a pricing strategy model based on utility theory was developed in monopoly market competition and the effect of product quality differentiation on optimal solution was studied. Bae et al. (Citation2010) developed a model of pricing, quality, and proportion of outsourcing on the duopolistic market by applying utility theory and game theory. They aimed to maximize profits from firms within the duopolistic market structure. They obtained an optimal solution related to price, quality, and outsource proportion and got the maximum profit for both firms.
In the manufacturing sector, utility theory becomes one of the methods in the multi-attribute decision-making process to determine the optimal manufacturing and design-related decisions. According to Rosyidi (Citation2012), utility theory is one way to represent the value of the product that can accommodate uncertainty and risk in determining the target value of product functional requirement (FR). A study to determine the value of FR on product design activities was developed by Locascio and Thurston (Citation1998), Raiffa (Citation2006) and Rosyidi, Irianto, Cakravastia, Toha, and Hamada (Citation2014). Rosyidi (Citation2012) states that the determination of FR target values in the product design process should focus on two perspectives, i.e. consumer and designer perspectives. In his research (see, e.g. Rosyidi, Citation2012; Rosyidi, Irianto, Cakravastia, & Toha, Citation2008; Rosyidi et al., Citation2014), a model of optimal FR determination is developed based on utility theory that integrates between consumer and designer with several considerations including time, cost, and technical difficulties.
In a competitive marketplace, firms should determine pricing strategies according to consumer preferences. There have been numerous studies that examined utility models with market competition to provide optimum solutions that maximize profits, among them are Mussa and Rosen (Citation1978), Kamien, Li, and Samet (Citation1989), Shy and Stenbacka (Citation2004), Lambertini and Tedeschi (Citation2007), Liao (Citation2008), Bae et al. (Citation2010), and Nabin, Nguyen, Sgro, and Chao (Citation2014). Generally, these studies consider Cournot and Bertrand competitions where firms compete against price and quality. Other studies, including Dang, Hong, and Lin (Citation2014) have developed a model with fuzzy demand and cost as an effort to consider various uncertainties that exist in the real system.
A study of the utility theory in describing consumer preferences was first developed by Mussa and Rosen (Citation1978). In their research, a pricing strategy model was developed in a monopolistic competition. They studied the effect of product quality differentiation on the optimal solution. The model was then further developed by Ronnen (Citation1991), Gabszewics and Thisse (Citation1979), and Crampes and Hollander (Citation1995). Lambertini and Tedeschi (Citation2007) developed a two-period duopoly model with vertical product differentiation. From the study, it was known that there is a unique sub-game equilibrium point where the first entrant, the firm that enters the market first and supplies a lower quality product, will earn higher profits rather than the second entrant. This is due to the profit that the first entrant firm has already benefited from the monopolistic market in the first period before the second firm entered the market. The study emphasizes that firms with higher quality products do not always gain higher profits. However, the period of entry of firms into the market also affects the profits to be gained by the firm. Other works that examined the application of utility theory on oligopoly strategic pricing were also done by Conrad (Citation2005), Xiao, Xia, and Zhang (Citation2014), Tan, Liu, Wu, and Chen (Citation2018), and Tan, Yi, and Chen (Citation2018).
In the area of oligopoly pricing strategies, researchers have also been investigating decision regarding outsourcing activities. In fulfilling consumer demand, many firms are particularly facing production issues such as lack of production capacities and capabilities. One alternative solution to these problems is to outsource some of the production from an outside supplier. Investigations on the outsourcing decision in a duopoly market were carried out by Kamien et al. (Citation1989), Shy and Stenbacka (Citation2004), and Bae et al. (Citation2010). Bae et al. (Citation2010) examined how an outsourcing activity influenced the optimal solution of price and quality under a duopolistic competition. In the study, they developed a three-stage game-theoretic model considering a differentiated product strategy. They also included the quality expectations of the market given by a number of consumers. The optimal solution regarding price, outsourcing proportion, and quality is determined for the equilibrium condition.
The application of utility theory on strategic pricing has been widely practiced by many researchers. However, the existing studies only use linear utility functions without considering the behavior of decision-makers against risk. The derivation of the utility function is not clearly explained based on boundary values of the attributes. Moreover, quality attributes that considered to affect consumer perceptions are generally expressed without a detailed explanation of how quality is measured quantitatively. The models developed through the previous research are also considered to be inadequate to the consumer because the purpose of the model was to either minimize company cost or maximize company profit. Therefore, it is necessary to develop a pricing model for the duopoly market structure that not only focuses on the firm but also involves the perspective of the consumer by considering the basic attitude of the decision-maker against the risks.
The proposed study accommodates a utility gap minimization model, between consumer and firm, and a strategic pricing model in a duopoly market with sequential optimization. Our main references are Rosyidi et al. (Citation2014) and Dwicahyani, Rosyidi, and Pujiyanto (Citation2018), for the minimization model of utility gap between consumer and producer, and Bae et al. (Citation2010), for the duopoly model with outsourcing activity. gives the comparison of the proposed model to its prior models.
Table 1. Position of the proposed model to its prior models.
The rest of the article is organized as follows. Section 2 provides a brief description of the problem as well as the notations and assumptions used to develop the model. The model formulation, solution procedure, and numerical example, are given in Section 3. Section 4 presents the discussion of the optimization results and sensitivity analysis. Finally, conclusions and future research directions are given in Section 5.
2. Problem description
A duopoly market, where two firms are competing one another with vertically differentiated products, commonly faces a problem of how to determine the equilibrium price and quality level. In such a competitive structure, interdependence between firms occurs. Decisions taken by a firm will affect the decisions of the competing firm. This also happens in the context of price decision-making. In determining the selling price, the firm mutually observes the selling price level of competitors. Under Bertrand’s law, the selling price will continue to change until there is a condition called Nash equilibrium. In this study, we develop a model to determine the equilibrium price to maximize the profit of each firm.
In addition, a firm’s decision-making should also consider the consumer point of view. Consumers usually have a certain tendency and preferences in choosing which products to be purchased, which are commonly influenced by quality and price level of the product. However, firm and consumer usually have different perspectives towards product quality. The consumer wants the product to have better quality. Yet, the firm wants it to have a lower quality with less manufacturing cost. Consequently, there will be a preference gap between consumer and the firm, which known as utility gap. The problem that arises is at what level of quality that a product should be produced in order to minimize the gap between consumer and manufacturer preferences.
Through this research, we try to develop mathematical models that can help firms engaged in a duopoly market to determine the equilibrium price and to focus not only on the firm’s perspective but also on the consumer’s.
2.1. The system
The system investigated in this study consists of two competing manufacturing firms in a duopoly market. One manufacturing firm produces higher-quality products, hereinafter referred to as Firm A, and sells the products at a higher price. The other competing firm produces lower-quality products, hereinafter referred to as Firm B, and sells the products at a lower price. Quality is measured by product dimensional tolerance, where tighter tolerance means high quality and loosen tolerance means low quality. In a duopoly market, there is a struggle for market share between the two firms. Market share of each firm will be influenced by product tolerances and prices set by both firms. The perfect Nash equilibrium price is needed to be determined to maximize the profit of each firm.
In addition to in-house production, Firm B also performs outsourcing activity due to its low production capacity and capability. The demand of Firm B cannot be fulfilled only from the in-house production. The operations strategy undertaken by Firm B includes a greater emphasis on cost reduction, rather than quality-based operations. Outsourcing strategy is applied, considering that Firm B is less sensitive to product quality. This is certainly different from Firm A that uses product differentiation strategy by selling a higher quality product. Consumers generally perceive an outsourcing product to have a lower quality than the in-house production. At this point, Firm A needs to maintain its quality level continuously and does not want to take a risk on outsourcing decision. Therefore, Firm A does not perform any outsourcing activity.
In this study, market share is calculated by using the concept of consumer utility function and marginal valuation as adopted from Bae et al. (Citation2010). Utility function is used to model consumer and firm preferences, based on several quality attributes, including product dimensional tolerance and price. The demand of each firm can be known by plotting the function of each consumer’s utility to marginal valuation. As both firms compete in terms of product prices, it is necessary to determine the optimal equilibrium price so that the profit of each firm can be maximized.
In addition to profit maximization, this study also aims to minimize the gap of preferences (utility gap) between consumers and firms by determining the optimal tolerance levels and outsource proportion (for Firm B). These two attributes of quality are considered to affect the consumer in perceiving the product. We develop two mathematical models in this study. The first model (Model I) is developed to minimize the preference gap between consumers and firms. The second model (Model II) is about the equilibrium pricing strategy between two competing firms in the duopoly market.
2.2. Model notations and assumptions
Notations used to develop the model are given below:
i: party index i = {c, m}, where i = c for consumer and i = m for manufacturer/firm
j: firm index j = {A, B}, where j = A for Firm A and j = B for Firm B
k: utility attribute
(k): utility function for party i to the product of firm j with respect to utility attribute k
: risk tolerance of party i to the attribute k
,
: exponential constant of utility function party i to the attribute k, where
and
: weight of the utility attribute k given by party i
C0j, C1j: coefficient of manufacturing cost function of product j
Kj: constant cost of product quality loss j
Cpkj: production process capability of firm j
: production process variance of firm j
cos: variable outsourcing cost ($/unit)
: monitoring cost of outsourced products ($/unit2)
The following assumptions and limitations are used in the proposed model:
The market structure investigated in this study is a duopoly market in which two large firms dominate over the market with vertical differentiation.
Single product for each firm.
Dimensional tolerance is used to measure product quality.
There are a number of N consumers in the market, where each consumer buys at most one item from either higher-quality firm or lower-quality firm.
The consumer is heterogeneous in terms of marginal valuation of product quality, referred to as quality expectations, denoted by vz for z = {1, 2, …, N}.
The distribution of vz is assumed to be a uniform distribution, given as vz
U[0, N].
Consumers and firms are risk-averse, because they do not want to bear the losses that may arise in the future due to the risks taken.
The decision-maker has predetermined the weight of interest of each utility attribute.
Each utility attribute is additive independent of each other.
3. Mathematical model development
3.1. First stage (Model I)
To develop Model I, we need to build consumer and firm utility functions. Utility functions used in this study are exponential utility functions. We adopt the utility function built by Dwicahyani et al. (Citation2018) by including more attributes for Firm B that is the outsourcing proportion as introduced by Bae et al. (Citation2010). The derivation of each utility function can be further seen in Dwicahyani et al. (Citation2018).
3.1.1. Firm A utility function
As we intend to minimize the gap between the firm and consumer, utility functions for both parties are developed herein. The functions of utility for consumer and Firm A are given by Equations (1) and (2), respectively.
3.1.2. Firm B utility function
By applying the same procedure of Dwicahyani et al. (Citation2018) and including outsourcing rate (rB) as one of Firm B utility attribute (along with product tolerance (tB) and selling price (PB)), we obtain the following functions of utility for consumer and Firm B which are given by Equations (3) and (4), respectively.
3.1.3. Optimization of Model I
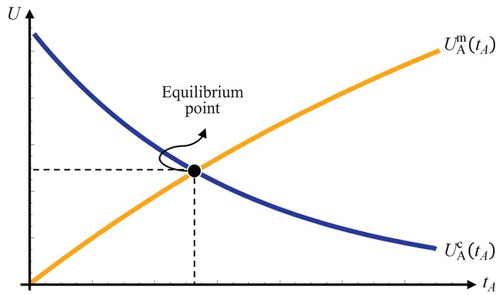
The utility functions that have been built in the previous section represent how consumers and firms perceive the product. In this model, the attributes considered are product tolerance and outsourcing ratios. The objective function to be achieved is minimization of the gap between consumer and firm utilities. The idea of utility gap minimization is referred to the study of Rosyidi et al. (Citation2014). The illustrations of the consumer and firm utility functions are presented in .
Figure 1. Graphical plot of consumer () and firm (
) utility functions regarding product dimensional tolerance of Firm A (tA).
The objective functions of Model I for Firms A and B are given by Equations (5) and (6), respectively.
Similar to the concept of economic demand and supply, the equilibrium condition of the utility is the point of intersection between the utility functions of consumer and firm. However, the optimum point of price and tolerance may not necessarily be chosen at that point of equilibrium, as firms and consumers are subjected to many constraints. The model developed in this study accommodates several constraints from the side of the firm and consumer, including the boundary for the variable values of tA, tB, and rB, the minimum profit to be achieved by each firm, and the value of the consumer utility that should not be less than the firm’s. Constraints regarding the consumer utility that should not be less than the firm has been given to accommodate the perspective of the consumer, because the firm’s perspective has been represented through the value of firm profits. The constraints are given by Equations (7)–(12).
Total revenue (TRj) is the total product sales of firm j at the price level of Pj# and a number of consumer demand of Dj# as given by Equation (13).
The values of Pj# and Dj# are used as approximation values for variable price, Pj, and demand, Dj. Unlike Model II, in which the two variables are decisions to be sought, the values for each variable are assumed deterministic in Model I. Model I aims to determine the value of tA, tB, and rB that minimize the utility gap of both parties by neglecting the duopolistic competition of Firms A and B. Then, any value of Pj and Dj will not affect the optimal value of tA, tB, and rB to minimize the gap of utility. In this study, the value of Pj# is set at the minimum possible level of the firm’s selling price, in other words, .
Costs considered in the calculation of firm profits (TCj) include manufacturing cost (TCMj), cost of quality loss (TCQLj), and outsourcing cost (TCOSB) for Firm B. Manufacturing cost (TCMj) is the cost regarding the production process. Here, we adopt the exponential cost–tolerance function of manufacturing cost from Kumar and Padmanaban (Citation2015). The cost of quality loss (TCQLj) is a loss that the firm may experience due to product variance (). The outsourcing cost (TCOSB) is the cost paid only by Firm B in the process of outsourcing, which includes the cost of outsourcing itself and the cost of product inspection. The values of TCMj, TCQLj, TCOSB, and TCj for j = {A, B} are given, respectively, by Equations (14)–(17).
3.1.4. Numerical example
A numerical example is used to illustrate the application of the proposed model. The data used in the numerical example are hypothetical. In finding the optimal solution of Model I, we use the help of Wolfram Mathematica 7.0.
By applying the same procedure of Dwicahyani et al. (Citation2018) for the hypothetical data given in , we obtain the following utility functions for Firms A and B w.r.t tA, tB, and rB as given by Equations (18)–(21).
Table 2. Hypothetical value for each parameter.
Subsequently, the objective functions of Model I in Equations (5) and (6) become
Equations (22) and (23) were solved using the constraint optimization method in Wolfram Mathematica 7.0. Considering several constraints given in Equations (7)–(12), the optimal solutions for Firms A and B are presented in and , respectively.
Table 3. Optimal solution of Model I for Firm A.
Table 4. Optimal solution of Model I for Firm B.
From the result, we get that Firm A should set the product tolerance at 0.078 mm to obtain the minimum gap of utility between firm and consumer. In addition, Firm B should set its product tolerance and outsourcing rate at 0.166 and 0.488 mm, respectively, for the same objective function.
3.2. Second Stage (Model II)
Model II develops a pricing strategy model with a game-theoretic perspective. To be able to conduct the optimization of Model II, we need several input values including optimal product tolerance (tA* and tB*) and outsourcing rate (rB*), obtained from Model I. In Model II, game theory is used as a problem-solving perspective of the pricing strategy. The solution to be sought is the sub-game perfect Nash equilibrium (SPNE) for firm selling price (PA* and PB*). As described previously, Nash equilibrium is the most commonly used approach to explain the concept of equilibrium in game theory. The equilibrium point of Nash occurs at the set of strategies (in this case PA* and PB*), where PA* is the best response for Firm A to encounter the best response of Firm B, and PB* is the best response for Firm B to encounter the best response of Firm A. By this means, decision of each firm will affect each other’s. Therefore, it is necessary to determine the SPNE of the price that gives the best decision for both firms.
3.2.1. The model
The objective function of Model II is to maximize the profits of each firm given mathematically in Equations (24) and (25):
The decision variables to be sought is the equilibrium price of each firm including
Firm A selling price (PA*)
Firm B selling price (PB*)
In this case, the game theory perspective is used to determine the optimum level of price under the condition of SPNE. Both firms are facing the duopolistic competition, where the product price of a firm is influenced by the competitor’s product price, vice versa. In other words, the values of PA* and PB* are interdependent.
Using the model of Bae et al. (Citation2010) as our basis, we develop Model II using similar assumptions. We assume that there are N numbers of consumers where each consumer buys at most 1 unit of product from Firm A or Firm B.The consumer is heterogeneous in terms of marginal valuation of product quality, or quality expectation, denoted by vy for y = {1, 2, …, N}. The distribution of consumer quality expectations is assumed to be a uniform distribution, given as vy ~ U [0, N]. The function of consumer utility of each firm is exponential as given by Equations (26) and (27).
where a, b, c, d, f, g, h, i, j, and k are the constants that previously obtained in the utility function derivation described in Model I. Using the known functions of utility in Equations (26) and (27), the market share of each firm is determined based on .
Figure 2. The graphical plot of and
on the marginal valuation (v).
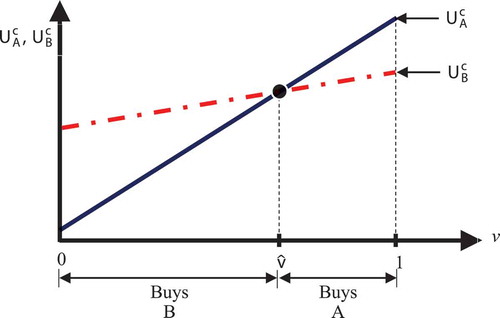
shows the plot of and
on the marginal valuation (v). As mentioned earlier, this model assumes that tA is always less than tB (tA<tB), meaning the product quality of Firm A is always higher than Firm B’s. As in this case, Firm A competes primarily on maintaining higher quality of the product, whereas Firm B has the option to further improve its quality or compete further on cost leadership. The choice of consumers to choose a product between firms at a specified level of price is given by Equations (28) and (29).
From , it appears that there will be an intersection point between dan
at
. The intersection point indicates a consumer that indifference to purchase product A or B. For N number of consumers, where each consumer buys at most one unit of product, demand for each firm can be calculated as follows:
With a known demand of each firm from Equations (30) and (31), TPA(PA, PB) and TPB(PA, PB) can be calculated as
3.2.2. Optimization of Model II
The optimization of Model II is done analytically with the help of Wolfram Mathematica 7.0 software using the following procedure:
Calculate the first derivative of TPA(PA, PB) w.r.t. PA as given below:
(2) Set
(3) Calculate the first derivative of TPB(PA, PB) w.r.t. PB as given below:
(4) Substitute the function of PA*(PB) from Step 2 into Equation (35) and get the new equation of
(5) Set
(6) Substitute the function of PB* from Step 5 into PA*(PB) from Step 2 to get the optimum PA*.
3.2.3. Numerical example
The equilibrium price of PA* and PB* which considers the duopolistic competition can be found after the optimization of Model I is completed. The values of tA*, tB*, and rB* that have been obtained from Model I are used as parameter inputs in Model II. The summary of tA*, tB*, and rB* generated from Model I is given in .
Table 5. Values of tA*, tB *, rB*, and
from Model I.
Model II optimization begins with the calculation of each firm’s market share and demand. The plot of and
on market valuation (v) is given in .
Figure 3. The plot of and
on v at tA*, tB*, and rB*.
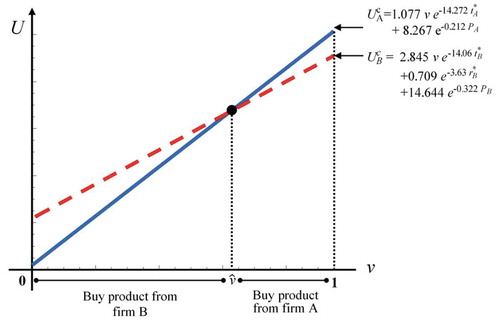
Suppose there are 100 consumers in the market (N = 100), by applying the optimization procedure described in the previous section, we obtain the best solution of Model II that maximizes the profit of each firm as summarized in .
Table 6. Optimal solution of Model II.
The maximum profit of each firm is obtained at PA* = $18.90 and PB* = $17.24. By setting prices at these levels, Firm A will acquire 63% of the market and Firm B will acquire 37% of the market. These optimal equilibrium prices maximize profits for both firms without compromising one firm.
The three-dimensional graphs of TPA and TPB on PA and PB are given in the surface plots depicted in .
Figure 4. (a) Surface plot of TPA on PA and PB; (b) Surface plot of TPB on PA and PB.
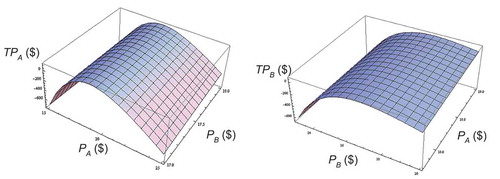
From , one can see that PA and PB have concave effects on TPA and TPB, respectively. Accordingly, the optimal values of PA* and PB* that maximize the function of TPA and TPB are both on the cusp of each function of TPA and TPB.
4. Results and discussion
4.1. Model’s optimal solution
Based on the optimization result, we point out an interesting finding that Firm A, which sets a higher price, actually gains a higher profit and market share. This seems to contradict the general economic law of price and demand, where if there is an increase in price, the demand for products will decrease, and vice versa. This occurs due to the consumer’s perception of a product that is not only based on price, but also the quality represented in the form of product tolerance and outsourcing proportion. In the example, the weight given for product tolerance is higher than the weight for price. In other words, consumers prioritize quality over price. Therefore, consumers tend to choose a product from Firm A, rather than Firm B.
The model developed in this study particularly aims to assist manufacturing firms in determining the equilibrium price to maximize profit of each firm that competes in a duopoly market. In addition, we also consider the criteria to minimize the gap of utility between firm and consumer. In this section, we provide a comparison of two scenarios, i.e. scenario without considering the competitor (Scenario I), hence each firm will set its price at the maximum level, and by considering the competitor (Scenario II), where each firm sets its price at Nash equilibrium (optimal price). The comparison result is shown in .
Table 7. Solution comparison of Scenario I (price at the maximum level) and Scenario II (price at Nash equilibrium).
Based on , we know that at Scenario I, where both firms ignore the competition, Firm B will obtain 100% of the market demand with a very high profit of $435.82. On the other hand, Firm A does not obtain any demand at all; thus, the profit of Firm A is zero. Under this condition, Firm A will lower its product price in order to obtain consumer demand. At the level of Firm A’s decreasing price, Firm B will respond by lowering its price also. This will continue to happen until the best response is obtained between the two. The best response is the best solution at the equilibrium point of price where there is no more change in the market price.
In addition to firm profits, another criterion considered in the developed model is the gap of utility between firm and consumer. As shown in , the utility gap for both firms at the maximum level of price is much greater than the one at the Nash equilibrium. Nash equilibrium condition provides better utility gap with higher consumer utility for both firms. Therefore, it is proven that the Nash equilibrium condition provides equilibrium prices, maximizes profit, and can also protect consumers through the minimum value of utility gap.
4.2. Sensitivity analysis
4.2.1. Effects of tAmin and tAmax on model’s optimal solution
This section explains how the boundary values of tA affect the model optimal solution. As explained earlier, tA denotes the product dimensional tolerance for Firm A where its value is constrained to tAmin < tA < tAmax. Investigation of the change in tAmin and tAmax is done to understand what decision should be made by the higher-quality firm if there is a degradation or improvement in its quality. It also suggests Firm Aabout the effects of product tolerance to its quality, costs, and demand. presents the result from different values of tAmin and tAmax on model’s optimal solution.
Table 8. Effects of different tAmin and tAmax on model’s optimal solution.
Based on our observation on the result presented in , increases in tAmin and tAmax will lower the demand as well as market share of Firm A. As explained before, an increase in tAmin and tAmax means that there is a decrease in quality of Firm A, measured by a loosen product tolerance of tA. As the quality decreased, demand for Firm A will also be alleviated, which actually led to a lower profit for Firm A. From the competitor’s side (Firm B), increase in tAmin and tAmax will raise both demand and market share of Firm B. Consumers who initially chose to buy a product from Firm A will change to buy a product from Firm B, because Firm A has a decreased quality. On the other hand, the optimal price of Firm A remains increased as the quality decreased to compensate the decrease in demand and keep the firm's profit positive. The optimal price of Firm B will also increase to recoup with Firm A’s decision to raise the price. Based on these findings, we suggest that the higher-quality firm should maintain its quality in order to cope with an increase in market price.
4.2.2. Effects of CpkB on model’s optimal solution
This section describes the effect of Firm B’s production process capability (CpkB) on the model optimal solution. CpkB is an index that measures the capability of Firm B’s production process in order to produce products that close to target with low variance. The analysis is done to understand what decision that Firm B should make in a case that there is a capability improvement or deterioration. summarizes the result from different values of CpkB on model’s optimal solution.
Table 9. Effects of different CpkB on model’s optimal solution.
As presented in , PA* and PB* will be decreased when CpkB is either increased or decreased. An increase in the value of CpkB gives a decreasing cost of quality loss for Firm B, which results in a lower product variable cost offered by Firm B. Therefore, a higher CpkB will be lowering PB*. With declining PB*, Firm A as a competitor should react in such a way to be able to compete with lowering the price of PB. Consequently, Firm A needs to lower its price and will be resulting in a lower value of PA*.
An increase in CpkB means that there is an improvement in the production process of Firm B. From the results in , we observe that by improving CpkB, Firm B will obtain a higher market share. Yet, when the value of CpkB decreases, even if the market share of Firm B increases, it turns out that the profit of the firm actually drops significantly as CpkB directly relates to the cost of quality loss. The lower the value of CpkB, the higher the cost of quality loss will be. Therefore, to maintain its profit, Firm B needs to improve or at least manage the capability of its production process.
4.2.3. Effects of cos on model’s optimal solution
This section explains the effects given by cos on the model’s optimal solution. The cos parameter is the cost incurred by Firm B for each outsourced unit, as Firm B performs an outsource activity to produce a part of its demand. By the end of this analysis, we provide suggestion for a lower-quality firm engaged in a duopoly market, to decide what to do if there is an increase or decrease in the cos parameter. summarizes the result from different values of cos on model’s optimal solution.
Table 10. Effects of different cos on model’s optimal solution.
Based on the results presented in , by changing the value of cos to −25% and −50%, it is known that the optimal value of outsourcing proportion (rB*) remains unchanged. However, when there is an increase in cos by +25% and +50%, rB* will decrease to 0.480 and 0.450, respectively. Based on these results, we understand that an increase in cos will be resulting in a less amount of outsourced products. Therefore, the optimal outsource proportion should consider the cost of outsourcing. The higher the cost to outsource, the less the amount of product will be outsourced.
From , it can be observed that as the value of cos increases, profit and market share of Firm B will get worse. The decrease in profit of Firm B was mainly caused by increasing the costs for outsourcing. Whereas when the cos value is decreased by 50%, Firm B’s profit increases to $116.38. The reason is that the cost of outsourcing is inexpensive and Firm B is getting a higher amount of demand (due to lower market price). Therefore, it can be concluded that the cost of outsourcing affects both profit and market share of the lower-quality firm that engaged in a duopoly market. The higher the cost of outsourcing, the lower the profit and market share to be received by the firm.
In the perspective of the competing firm, the cos parameter affects both profit and market share in a negative way. Profit and market share of Firm A are decreased when the value of cos is either increased or decreased. This is due to a change in the optimal solution of PA* and PB*. Changes in cos cause the value of PA* to be gradually decreased. This occurs as a response given by the model for the change in PB*. These changes in the value of PA* and PB* are predicted as a strategy to maintain the profit at its maximum point.
4.3. Conclusion and further research
This study integrates a model of utility gap minimization and a strategic pricing model under duopolistic competition. In addition to gap minimization, the model aims to maximize profit of each firm engaged in a duopoly market. Optimal solutions are generated, including optimal quality, as measured by product dimensional tolerance, outsourcing proportion as well as equilibrium price of each firm. We try to contribute to the current literature by considering the exponential utility function as other prior studies in relevant field only used the linear one. By considering the exponential utility function, we accommodate the behavior of decision-makers against risk. Minimization of the gap between consumer and firm utilities is conducted to incorporate the consumer perspective, in addition to firm perspective.
From the sensitivity analysis result, we understand that decreasing quality of the higher-quality firm affects both price, market share as well as profit of the related firm. Therefore, we suggest that the higher-quality firm should always maintain the level of quality of its products in order to win the market competition. Whereas the cost of outsourcing has negative effects toward outsourcing proportion, demand, and profit of the lower-quality firm. Thus, we suggest that the lower-quality firm should take an effort to improve the cost of outsourcing in order to compete in the market. On the other hand, an improvement in the production process capability of the lower-quality firm provides better profit and market share for the related firm. If the lower-quality firm improves its production process, demand and profit can be increased. Therefore, we suggest that in addition to cost-leadership strategy, the lower-quality firm should also conduct an improvement in its production process to increase both profit and market share.
The strategy of price and quality determination developed in the proposed model is proven to protect both consumer and firm that engaged in a duopoly market. By setting the price at the Nash equilibrium point, we obtain the best value for profit and consumer utility. In other words, the firm’s profit can be maximized and the preference gap between consumer and firm can be minimized. Based on the sensitivity analysis result, it is known that the parameter uncertainty influences the optimal decisions of the firms. Therefore, in making decisions related to the optimal policy, firms need to consider the uncertainty factor of each parameter. Several managerial directions, regarding the parameter of tolerance boundary values, production process capability of lower-quality firm as well as the cost of outsourcing, are provided in Section 4.2.
For future research, the solution procedure of the models can be improved to incorporate the simultaneous integration between the two models. By optimizing the model simultaneously, the globally optimal solution can be derived. Another potential development is to use the multiplicative method for the aggregation of the utility functions. Hence, the developed utility functions can accommodate the possible interaction provided by each utility attribute. The structure of market competition can also be developed into an oligopolistic market involving more than two firms.
Disclosure statement
No potential conflict of interest was reported by the authors.
Additional information
Funding
Related Research Data
References
- Bae, S. H., Yoo, C. S., & Sarkis, J. (2010). Outsourcing with quality competition: insights from a three-stage game-theoretic model. International Journal of Production Research, 48(2), 327–342.
- Buzzell, R. D., Gale, B. T., & Sultan, R. G. M. (1975). Market share – a key to profitability. Harvard Business Review, 53, 97–106.
- Conrad, K. (2005). Price competition and product differentiation when consumers care for the environment. Environmental & Resource Economics, 31, 1–19.
- Crampes, C., & Hollander, A. (1995). Duopoly and quality standards. European Economy Review, 39, 71–82.
- Dang, J.-F., Hong, I.-H., & Lin, J.-M. (2014). The Cournot production game with multiple firms under an ambiguous decision environment. Information Sciences, 266, 186–198.
- Dwicahyani, A. R., Rosyidi, C. N., & Pujiyanto, E. (2018). An integrated consumer-manufacturer optimization model to determine the optimal product price and quality level using theory of utility. Proceeding of International Conference Engineering and Engineering Management, Singapore.
- Frank, R. H. (2003). Principles of microeconomics. New York, NY: McGraw-Hill.
- Gabszewicz, J. J., & Thisse, J. F. (1979). Price competition, quality, and income disparities. Journal of Economic Theory, 20, 340–359.
- Kamien, M., Li, L., & Samet, D. (1989). Bertrand competition with subcontracting. RAND Journal of Economics, 20(4), 553–567.
- Kumar, L. R., & Padmanaban, K. P. (2015). Optimal manufacturing cost and quality loss by reciprocal exponential cost-tolerance function. Applied Mechanics & Materials, 766–767, 1097–1102.
- Lambertini, L., & Tedeschi, P. (2007). Would you like to enter first with a low-quality good. Bulletin of Economic Research, 59(3), 269–282.
- Levin, J., & Milgrom, P. (2004). Consumer theory. Stanford: Stanford University.
- Liao, P.-C. (2008). A note on market coverage in vertical differentiation models with fixed costs. Bulletin of Economic Research, 60(1), 26–44.
- Locascio, A., & Thurston, D. L. (1998). Transforming the house of quality to a multiobjective optimization formulation. Structural Optimisation, 16, 136–146.
- Mussa, M., & Rosen, S. (1978). Monopoly and product quality. Journal of Economy Theory, 18, 301–317.
- Nabin, M. H., Nguyen, X., Sgro, P. M., & Chao, -C.-C. (2014). Strategic quality competition, mixed oligopoly and privatization. International Review of Economics & Finance, 34, 142–150.
- Raiffa, H. (2006). Preferences for multi-attributed alternatives. Journal of Multi-Criteria Decision Analysis, 14, 115–157.
- Ronnen, U. (1991). Minimum quality standard, fixed costs, and competition. Rand Journal of Economy, 22(4), 490–504.
- Rosyidi, C. N. (2012). Model penentuan nilai target functional requirement berbasis utilitas [Utility-based functional requirement target determination model]. Jurnal Teknik Industri, 14(1), 35–42.
- Rosyidi, C. N., Irianto, D., Cakravastia, A., & Toha, I. S. (2008). Utility based optimization model for deriving optimum target of functional requirements. Proceeding of the 9th Asia Pacific Industrial Engineering & Management Systems Conference (APIEMS), Bali, Indonesia, 2068–2073.
- Rosyidi, C. N., Irianto, D., Cakravastia, A., Toha, I. S., & Hamada, K. (2014). Optimization models for deriving optimum target of key characteristis. Journal of Advanced Manufacturing Systems, 13(2), 89–101.
- Shy, O., & Stenbacka, R. (2004). Partial outsourcing, monitoring cost, and market structure. Canadian Journal of Economics, 38(4), 1173–1190.
- Sun, H.-X., Li, Y., & Wang, F. (2015). The optimum output quantity for different competitive behaviors under a fuzzy decision environment. Mathematical Problems in Engineering, 1–12.
- Tan, C., Liu, Z., Wu, D. D., & Chen, X. (2018). Cournot game with incomplete information based on rank-dependent utility theory under a fuzzy environment. International Journal of Production Research, 56(5), 1789–1805.
- Tan, C., Yi, W., & Chen, X. (2018). Bertrand game under a fuzzy environment. Journal of Intelligent & Fuzzy Systems, 34, 2611–2624.
- Thevenot, H. J., Steva, E. D., Okudan, G. E., & Simpson, T. W. (2007). A multiattribute utility theory-based method for product line selection. Journal of Mechanical Design, 129, 1179–1184.
- von Neumann, J., & Morgenstern, O. (1944). Theory of games and economic behavior (2nd ed.). New Jersey, NJ: Princeton University Press.
- Xiao, T., Xia, Y., & Zhang, G. P. (2014). Strategic outsourcing decisions for manufacturers competing on product quality. IIE Transactions, 46(4), 313–329.
- Zia, N. U., & Sohail, M. (2016). Factors effecting consumer brand preferences in automobile industry. Singaporean Journal of Business, Economy, and Management Study, 5(3), 55–65.