
 ?Mathematical formulae have been encoded as MathML and are displayed in this HTML version using MathJax in order to improve their display. Uncheck the box to turn MathJax off. This feature requires Javascript. Click on a formula to zoom.
ABSTRACT
In this study, piezoelectric properties of 0.4Bi(Ni0.5Zr0.5)O3–0.6PbTiO3 (BNZ-PT) and 0.4Bi(Mg0.5Zr0.5)O3–0.6PbTiO3 (BMZ-PT) ceramics were investigated and compared with those of Pb(Zr,Ti)O3 in energy harvester applications. Their piezoelectric properties are comparable with those of Pb(Zr,Ti)O3 based materials, although they have lower lead contents. By optimizing the sintering temperature, the piezoelectric charge coefficients (d33) were improved to 438 and 351 pC/N for 0.4BNZ-0.6PT and 0.4BMZ-0.6PT, respectively, whereas the piezoelectric voltage coefficients (g33) were improved to 25.02 × 10⁻³∙V∙m/N and 28.37 × 10⁻³∙V∙m/N for 0.4BNZ-0.6PT and 0.4BMZ-0.6PT, respectively. The generated energies were estimated by measuring the generated output voltages. Generated energy densities of 1.67 and 1.01 mJ/cm3 were obtained from 0.4BNZ-0.6PT and 0.4BMZ-0.6PT, respectively. The optimum sintering conditions were found by observing the changes in the piezoelectric constant, dielectric constant, and density as a function of the sintering temperature.
KEYWORDS:
1. Introduction
The depletion of fossil fuels has highlighted the importance of renewable energy. Among the various renewable energy technologies, piezoelectric energy harvesting based on mechanical vibration energy is a robust renewable energy source that can convert mechanical energy into electrical energy. To present, lead-based piezoelectric ceramics have been intensively studied for industrial applications. However, owing to the environmental issues, studies on lead-free or reduced lead-content piezoelectric ceramics for piezoelectric devices are being conducted. Therefore, the world is now focusing on energy harvesting as a new energy source [Citation1–3]. Energy harvesting refers to the technology of harvesting energy from natural energy sources, such as light, magnetism, vibration (piezoelectric), thermal energy, and radio frequency energy. Energy harvesting technology involves the conversion of various types of energies into usable electrical energy. Unlike other types of renewable energy sources, such as solar cells or wind power and fuel cells, piezoelectric energy harvesters are based on mechanical vibration energy. Mechanical vibration energy can be converted into electrical energy using electrostatic, electromagnetic, and piezoelectric effects [Citation4,Citation5]. The conversion efficiency and output property of energy harvesting devices are affected by environmental conditions. The piezoelectric energy harvesters are semi-permanent because they are less limited to environmental factors as long as the ambient vibrations are present. Therefore, piezoelectric energy harvesting is relatively less constrained by external factors than other energy harvesting technologies. In addition, it can be used wherever kinetic energy is available.
Lead zirconate titanate (Pb,Zr)TiO3 (PZT) ceramics are widely used in various fields, such as piezoelectric sensors and actuators [Citation6–8]. Owing to their excellent electrical and mechanical properties, PZT ceramic-based actuators and transducers have attracted significant attention in industrial applications. In addition, Pb(Mg1/3Nb2/3)O3 (PMN)-based ceramics, such as Pb(Mg1/3Nb2/3)O3–PbZrO3–PbTiO3 (PMN–PZT) and Pb(Mg1/3Nb2/3)O3–PbTiO3 (PMN–PT), are well-known relaxor ferroelectrics, which have broad diffuse and dispersive phase transition. These relaxor ferroelectric ceramics exhibit high dielectric constant and piezoelectric charge coefficient [Citation9,Citation10]. However, recently, there has been an increasing demand for more eco-friendly materials with reduced lead content [Citation11]. Meanwhile, the large ferroelectric property of Bi-based BiMO3 (where M = Sc, Fe, and In, and among others) has been investigated. Moreover, high-temperature ferroelectric ceramics based on (1-x)BiMO3–xPbTiO3, such as BiScO3–PbTiO3, BiFeO3–PbTiO3, and BiInO3–PbTiO3, have been intensively studied [Citation12–14]. However, these materials are not cost-effective due to the need of rare-earth metals such as scandium or indium. There is a strong demand to replace PZT materials with alternative lead-free materials. However, completely lead-free piezoelectric materials have demerits in the piezoelectric charge coefficient. Therefore, reduced lead-content piezoelectric materials have emerged as potential materials for replacing PZT.
For the first time, piezoelectric 0.4Bi(Ni0.5Zr0.5)O3–0.6PbTiO3 (BNZ-PT) and 0.4Bi(Mg0.5Zr0.5)O3–0.6PbTiO3 (BMZ-PT) ceramics were selected and compared for sensor and actuator applications. By comparing the mol% of lead, it was found that the lead composition of 0.4BNZ-0.6PT piezoelectric ceramics was 40% less than that of PZT. Thus, this piezoelectric material can be considered less harmful than PZT. In addition, 0.4BNZ-0.6PT ceramics showed similar piezoelectric properties to those of PZT ceramics. Therefore, in this study, potential piezoelectric applications, including energy harvesters of BNZ-PT and BMZ-PT ceramics, were presented. BNZ-PT and BMZ-PT piezoelectric ceramics were investigated in this study for the first time. Also, they are considered as alternatives to PZT ceramics [Citation15,Citation16]. BNZ-PT and BMZ-PT have improved dielectric and piezoelectric properties compared to those of other PZT-based piezoelectric materials. However, to date, only limited research has been conducted on this material. In this study, the sintering conditions of BNZ-PT and BMZ-PT were varied to determine the optimized sintering conditions. Then, the piezoelectric and dielectric properties were investigated. Furthermore, we confirmed that the optimized sintering conditions of BNZ-PT and BMZ-PT can result in improved piezoelectric and dielectric properties.
2. Experimental methods
The 0.4Bi(Ni0.5Zr0.5)O3–0.6PbTiO3 (BNZ-PT) and 0.4Bi(Mg0.5Zr0.5)O3–0.6PbTiO3 (BMZ-PT) ceramics were prepared using a conventional solid state reaction process. To produce BNZ-PT powders, Bi2O3 (99.9%, Sigma-Aldrich Co. Ltd.), NiO (99.97%, Kojundo), ZrO2 (99.0%, Sigma-Aldrich Co. Ltd.), PbO (99.0%, Sigma-Aldrich Co. Ltd.), and TiO2 (99.9%, Kojundo) powders were prepared as starting materials. To produce BMZ-PT powders, Bi2O3, 4MgCO3·Mg(OH)2 · 5H2O (BioXtra, Sigma-Aldrich Co. Ltd.), ZrO2, PbO, and TiO2 powders were prepared. These powders were ball-milled in ethyl alcohol with zirconia balls for 24 h and dried at 100 °C for 24 h. The dried powders of BNZ-PT and BMZ-PT were calcined at 780°C for 2 h in air. The calcination process was conducted at 700–900°C. After calcination, the powders had a different particle size. The powder calcined at 780°C was small and uniform. These calcined powders were mixed with 5 wt.% poly vinyl alcohol and uniaxially pressed into discs, with a diameter of 12 mm and under a pressure of 300 MPa. Then, the pressed discs were sintered in air at 1050–1200°C for 2 h, at 25°C intervals. The obtained specimens were polished to a thickness of 1 mm and silver paste was applied on both the sides. These specimens were fired at 700°C for 10 min. The volume density of the sintered specimens was measured using the Archimedes method using deionized water as medium. The crystalline structures of the sintered samples were investigated using X-ray diffraction (XRD, Bruker-AXS; New D8-Advance) analysis. The microstructures were observed using field emission scanning electron microscopy (FE-SEM, Carl Zeiss; SIGMA). The frequency-dependent dielectric constant (ɛr) and dielectric loss tangent of the specimens were measured using an impedance analyzer (Agilent 4294A precision) from 1 kHz to 1 MHz. The samples were poled under a DC electric field for 30 min in a silicon oil bath by employing a high voltage power supply (Hantech poling M/C). The electromechanical coupling coefficient (kp) was estimated by measuring resonance-antiresonance frequencies (Agilent 4294A precision), following IEEE standards at room temperature. The poling temperature and electric field were varied from 20 to 100°C and 1 to 5 kV, respectively. The piezoelectric coefficient (d33) values were measured using a Berlincourt quasi-static d33 meter (YE 2730A).
3. Results and discussion
3.1. Crystalline properties
shows X-ray diffraction patterns of the 0.4Bi(Ni0.5Zr0.5)O3–0.6PbTiO3 and 0.4Bi(Mg0.5Zr0.5)O3–0.6PbTiO3 ceramics sintered at different temperatures in the range from 1050 to 1200°C. The structural characteristics of 0.4BNZ-0.6PT and 0.4BMZ-0.6PT were observed from the XRD analysis results. ) shows the (00 l) and (hk0) peaks for the 0.4BNZ-0.6PT ceramics. In addition, by analyzing the XRD 2θ data, the lattice parameters of c and a, for both the materials, were calculated. For the 0.4Bi(Ni0.5Zr0.5)O3-0.6(Pb,Ti)O3 ceramics, the lattice parameters a and c were 4.173 and 4.272 Å, respectively, whereas for the 0.4Bi(Mg0.5Zr0.5)O3-0.6(Pb,Ti)O3 ceramics, the lattice parameters a and c were 3.998 and 4.124 Å, respectively. Therefore, we can argue that both 0.4Bi(Ni0.5Zr0.5)O3–0.6PbTiO3 and 0.4Bi(Mg0.5Zr0.5)O3–0.6PbTiO3 ceramics have similar tetragonality.
Figure 1. X-ray diffraction (XRD) patterns of the 0.4Bi(Ni0.5Zr0.5)O3–0.6PbTiO3 and 0.4Bi(Mg0.5Zr0.5)O3–0.6PbTiO3 ceramics sintered at different temperatures in the range from 1050 to 1200°C
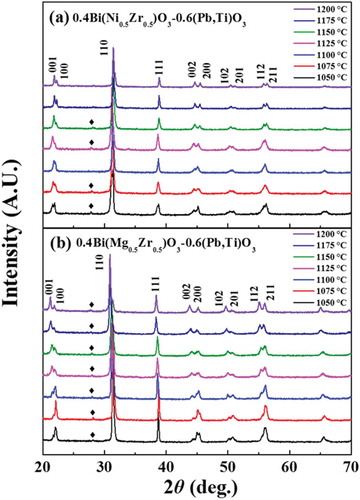
In particular, (100)/(001) and (200)/(002) peaks gradually split with increasing sintering temperatures. This indicates a phase transition of the 0.4BNZ-0.6PT ceramics from rhombohedral to tetragonal [Citation17–19]. Similarly, for the 0.4BMZ-0.6PT ceramics in ), the splitting peaks were appeared at approximately 22° and 45° with increasing sintering temperature due to a phase transition from rhombohedral to tetragonal.
Also, the XRD patterns show that both 0.4BNZ-0.6PT and 0.4BMZ-0.6PT ceramics were well formed with a perovskite structure. A weak pyrochlore phase peak was observed at approximately 2θ = 28°, according to the XRD JCPDS card (No. 5–543). This secondary peak was attributed to a Zr-rich phase, caused by the evaporation of Bi at high sintering temperatures. As shown in , (002) and (200) peaks were clearly observed by increasing the sintering temperature. This means that the tetragonal structure was more clearly formed by increasing the sintering temperature for 0.4BNZ-0.6PT and 0.4BMZ-0.6PT ceramics. We believe that with enough thermal energy, both BNZ-PT and BMZ-PT ceramics can settle at their optimized phase structure.
displays the bulk densities of the 0.4Bi(Ni0.5Zr0.5)O3–0.6PbTiO3 and 0.4Bi(Mg0.5Zr0.5)O3–0.6PbTiO3 piezoelectric ceramics, which were sintered from 1050 to 1200°C. As shown in ), the density increased with an increase in the sintering temperature, up to 1100°C. When the sintering temperature reached 1100°C, the highest density of 7.16 g/cm3 was observed, and then the density decreased with further increase in the sintering temperature. We believe that this decrease in density was caused by the over-sintering phenomenon. The bulk densities of 0.4BMZ-0.6PT are shown in ). Similar to the 0.4BNZ-0.6PT ceramics, the bulk density of the 0.4BMZ-0.6PT ceramics also increased as the sintering temperature was increased to 1100°C. When the sintering temperature was 1100°C, the highest bulk density value of 7.01 g/cm3 was obtained. As the sintering temperature was increased above 1100°C and reached 1200°C, the bulk density of the 0.4BMZ-0.6PT ceramics decreased, reaching its lowest value of 6.408 g/cm3.
Figure 2. Bulk densities of the 0.4Bi(Ni0.5Zr0.5)O3–0.6PbTiO3 and 0.4Bi(Mg0.5Zr0.5)O3–0.6PbTiO3 piezoelectric ceramics, which were sintered from 1050 to 1200°C
3.2. Dielectric characteristics and Curie temperature
show the frequency-dependent dielectric constant and dielectric loss of the 0.4Bi(Ni0.5Zr0.5)O3–0.6PbTiO3 and 0.4Bi(Mg0.5Zr0.5)O3–0.6PbTiO3 piezoelectric ceramics, sintered at different temperature from 1050 to 1200°C. As the frequency was varied from 1 kHz to 1 MHz, the dielectric constant εr decreased monotonically for both 0.4BNZ-0.6PT and 0.4BMZ-0.6PT ceramics. As shown in ), for the case of 0.4BNZ-0.6PT, as the sintering temperature range was increased, the dielectric constant also increased up to 1100°C. The highest dielectric constant of 1977 was observed for the 0.4BNZ-0.6PT ceramics sintered at 1100°C, which then decreased as the sintering temperature increased. In contrast, the specimens sintered at 1200°C showed the lowest dielectric constant, with the lowest dielectric loss tangent than that of other specimens.
Figure 3. Frequency-dependent dielectric constant and dielectric loss of the 0.4Bi(Ni0.5Zr0.5)O3–0.6PbTiO3 and 0.4Bi(Mg0.5Zr0.5)O3–0.6PbTiO3 piezoelectric ceramics sintered at different temperature from 1050 to 1200°C
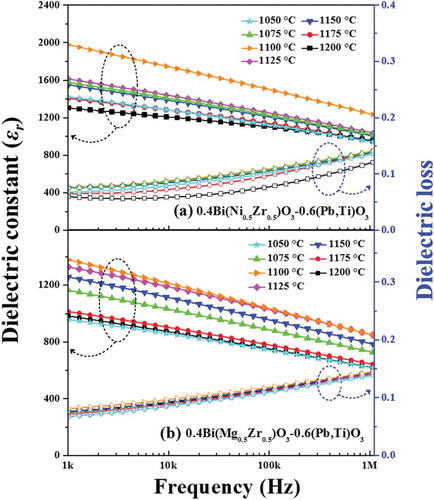
As shown in ), for the case of the 0.4BMZ-0.6PT ceramics, the frequency-dependent dielectric constant increased as the sintering temperature was increased up to 1100°C. In general, the poling processes were conducted to increase the dielectric polarization process. However, the main purpose for the polarization process was to obtain the piezoelectric charge coefficient, as shown in . The dielectric constants were also strongly related with the charge coefficient. The highest dielectric constant of the 0.4BMZ-0.6PT ceramics was 1397, achieved at 1 kHz. As the sintering temperature increased, the dielectric constant also increased up to 1100 °C. The samples sintered at 1100°C showed a dielectric constant of 1397 at 1 kHz, the highest measured value. Overall, as the sintering temperature was further increased, the dielectric constant decreased. For example, the sample sintered at 1050°C showed a dielectric constant of 957, which was the lowest dielectric constant value at 1 kHz. This occurred because the sample was not sufficiently sintered.
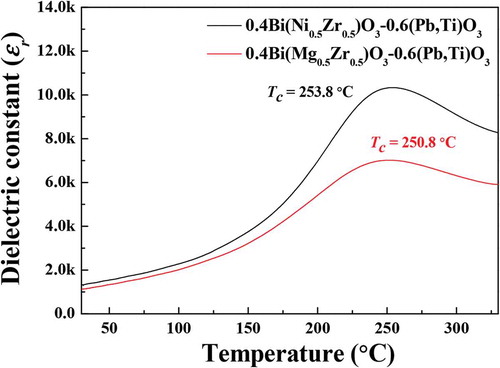
displays the temperature-dependent dielectric constant of the 0.4Bi(Ni0.5Zr0.5)O3-0.6(Pb,Ti)O3 and 0.4Bi(Mg0.5Zr0.5)O3-0.6(Pb,Ti)O3 ceramics sintered at 1100°C. The Curie temperature was measured at 1 MHz. The Curie temperature for the 0.4BNZ-0.6PT ceramics and 0.4BMZ-0.6PT ceramics was 253.8 and 250.8°C, respectively. By comparing the 0.4BNZ-0.6PT ceramics and 0.4BMZ-0.6PT ceramics, it was found that the 0.4BNZ-0.6PT ceramics showed a higher Curie temperature and maximum dielectric constant than 0.4BMZ-0.6PT ceramics. We believe that the increased Curie temperature and dielectric properties may be attributed to the increase of densification.
Figure 4. Temperature-dependent dielectric constant of the 0.4Bi(Ni0.5Zr0.5)O3-0.6(Pb,Ti)O3 and 0.4Bi(Mg0.5Zr0.5)O3-0.6(Pb,Ti)O3 ceramics sintered at 1100°C
3.3. Microstructure of ceramics
shows surface images taken using field emission scanning electron microscopy (FE-SEM) obtained from the 0.4Bi(Ni0.5Zr0.5)O3–0.6PbTiO3 ceramics and 0.4Bi(Mg0.5Zr0.5)O3–0.6PbTiO3 ceramics sintered at different temperatures from 1050 to 1200°C. As shown in ), the 0.4BNZ-0.6PT ceramics have high porosity with very small grains, when sintered at 1050°C. The sintering mechanism and grain growth started at a temperature near 1050°C. As the sintering temperature was increased up to 1100°C, the grain size increased and became uniform. However, as the sintering temperature was further increased above 1100°C, the grains became distorted and turned to an over-sintered phase. As shown in the SEM image at 1200°C, the microstructure appears dense and free from voids at some point. However, this SEM image shows irregular grain sizes, which indicates the over-growth of grain caused by over-sintering. Therefore, we believe that the irregular grain growth with increasing sintering temperature results in a decrease in densification. As shown in ), as the sintering temperature was increased up to 1100°C, the grain size gradually increased, and the grain size became uniform. These images also show that the porosity disappeared. However, when the sintering temperature exceeded 1100°C, the grain size tended to become distorted and unbalanced, which also seems to be due to over-sintering, similar to the case for 0.4BNZ-0.6PT.
Figure 5. Field emission scanning electron microscopy (FE-SEM) images of (a) 0.4Bi(Ni0.5Zr0.5)O3-0.6(Pb,Ti)O3 and (b) 0.4Bi(Mg0.5Zr0.5)O3-0.6(Pb,Ti)O3 ceramics sintered at different temperatures from 1050 to 1200°C
3.4. Piezoelectric properties
illustrates the piezoelectric charge coefficient (d33) of the 0.4Bi(Ni0.5Zr0.5)O3–0.6PbTiO3 and 0.4Bi(Mg0.5Zr0.5)O3–0.6PbTiO3 piezoelectric ceramics at different sintering temperatures from 1050 to 1200°C. In the case of 0.4BNZ-0.6PT, as shown in ), as the sintering temperature was increased up to 1100 °C, the piezoelectric charge coefficients increased up to 438 pC/N, and then decreased as the sintering temperature was increased further. It seems that the sintering temperature-dependent piezoelectric charge coefficient exhibits a behaviour similar to that of the sintering temperature-dependent bulk density and dielectric constant. In particular, the 0.4BNZ-0.6PT ceramics sintered at 1200°C showed a steeply decreased piezoelectric coefficient of 128 pC/N.
Figure 6. Piezoelectric charge coefficient (d33) of (a) 0.4Bi(Ni0.5Zr0.5)O3–0.6PbTiO3 and (b) 0.4Bi(Mg0.5Zr0.5)O3–0.6PbTiO3 piezoelectric ceramics for different sintering temperatures from 1050 to 1200°C
The piezoelectric properties of 0.4BMZ-0.6PT are shown in ). Similar to 0.4BNZ-0.6PT ceramics, the piezoelectric charge coefficient increased with increasing sintering temperature up to 1100°C. The piezoelectric charge coefficient showed its highest value of 351 pC/N, when sintered at 1100°C. However, as the sintering temperature was increased above 1100°C, the piezoelectric charge coefficient decreased monotonically. The reduction rate increased in the range 1175–1200°C. The specimen sintered at 1200°C showed a piezoelectric charge coefficient of 315 pC/N. It seems that this increased piezoelectric charge coefficient has a close relationship with the density and grains. Therefore, it can be argued that dipoles in the well-grown piezoelectric materials influence the piezoelectric properties of the sintered ceramics. By comparing , a higher bulk density means a closed packed structure and improved piezoelectric properties. In addition, by considering , the sintering temperature of 1175°C for 0.4Bi(Ni0.5Zr0.5)O3–0.6PbTiO3 and 0.4Bi(Mg0.5Zr0.5)O3–0.6PbTiO3 piezoelectric ceramics is the optimized sintering temperature for density and piezoelectric properties, with a well crystallized structure.
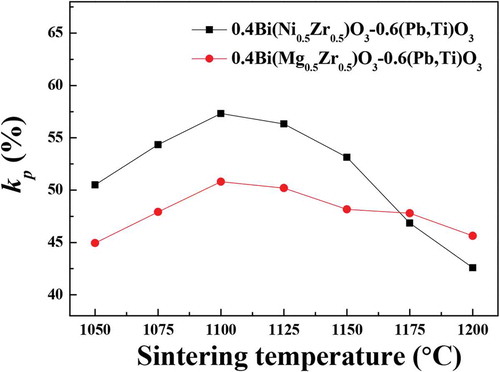
displays the electromechanical coupling factor (kp) of the 0.4Bi(Ni0.5Zr0.5)O3–0.6PbTiO3 and 0.4Bi(Mg0.5Zr0.5)O3–0.6PbTiO3 ceramics sintered at temperatures from 1050 to 1200°C. As shown in the figure, the electromechanical coupling factors of the 0.4BNZ-0.6PT and 0.4BMZ-0.6PT ceramics increased up to 1100°C, and then decreased. The shape of the electromechanical coupling factor of the 0.4BNZ-0.6PT and 0.4BMZ-0.6PT ceramics is similar to that of the piezoelectric charge coefficient shown in . The highest values of the electromechanical coupling factor of the 0.4BNZ-0.6PT and 0.4BMZ-0.6PT ceramics were 57.3% and 50.8%, respectively.
Figure 7. Electromechanical coupling factor (kp) of (a) 0.4Bi(Ni0.5Zr0.5)O3–0.6PbTiO3 and (b) 0.4Bi(Mg0.5Zr0.5)O3–0.6PbTiO3 ceramics sintered at different temperatures from 1050 to 1200°C
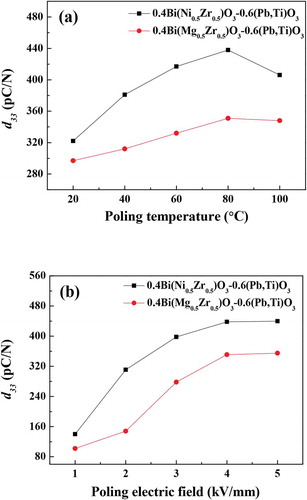
shows the poling temperature and electric field dependence of the piezoelectric coefficient of the 0.4Bi(Ni0.5Zr0.5)O3–0.6PbTiO3 and 0.4Bi(Mg0.5Zr0.5)O3–0.6PbTiO3 ceramics sintered at 1100°C. As shown in ), the piezoelectric coefficient was increased with temperature up to 80°C, and then decreased. In addition, in ), the piezoelectric coefficient was increased and saturated as the electric field increased to 5 kV. The piezoelectric coefficient of the 0.4BNZ-0.6PT and 0.4BMZ-0.6PT ceramics reached the maximum value of 440 and 355 pC/N, respectively, at a poling temperature of 80°C and electric field of 4 kV/mm.
Figure 8. Piezoelectric charge coefficients of 0.4Bi(Ni0.5Zr0.5)O3-0.6(Pb,Ti)O3 and 0.4Bi(Mg0.5Zr0.5)O3-0.6(Pb,Ti)O3 ceramics sintered at 1100°C. (a) Poling temperature dependence of piezoelectric charge coefficient, and (b) poling electric field dependence of piezoelectric charge coefficient
3.5. Energy harvesting application
) displays the schematic of the output power and energy measuring system with applied mechanical force. By employing this system, a uniform force can be applied to a piezoelectric specimen and the generated output power and energy can be measured. This system was designed and tested to obtain the actual output power and energy of the 0.4BNZ-0.6PT and 0.4BMZ-0.6PT piezoelectric ceramics. The force was applied to the piezoelectric ceramics using a mechanical system, which applied a force of 350 N to the sample at a cycle rate of approximately 0.18 Hz [Citation20,Citation21]. ) shows equivalent circuit to obtain the generated output power. By applying this circuit, power can be calculated by multiplying open circuit voltage and short circuit current. ) shows energy harvesting circuit to obtaining energy. Stored voltage in the capacitor (1 μF) using full bridge rectifier is measured and calculated into energy density. By applying the energy harvesting circuit, output power and energy can be generated depending on the input forces.
Figure 9. Schematics of mechanical force system (a) [Citation14,Citation15], (b) equivalent circuit for open circuit voltage and short circuit current system to obtain power (b) [Watt] and equivalent circuit for energy measuring system based on the full bridge rectifier with capacitors (c) [Joule]
![Figure 9. Schematics of mechanical force system (a) [Citation14,Citation15], (b) equivalent circuit for open circuit voltage and short circuit current system to obtain power (b) [Watt] and equivalent circuit for energy measuring system based on the full bridge rectifier with capacitors (c) [Joule]](/cms/asset/9eb91595-027c-41c8-a3f5-dbf3b64ea832/tace_a_1847428_f0009_oc.jpg)
The open-circuit voltage and short-circuit current measured using this mechanical force system is shown in . The open-circuit voltage and short-circuit current were measured using the samples sintered at 1100°C, which showed the best characteristics among the 0.4BNZ-0.6PT and 0.4BMZ-0.6PT ceramics sintered at temperatures between 1050 and 1200°C. shows the open-circuit voltage of the 0.4BNZ-0.6PT and 0.4BMZ-0.6PT ceramics poled at 80°C and 4 kV for 30 min, respectively. The samples were subjected to a pressure energy of 350 N (0.18 Hz), during which the voltage peak values of the 0.4BNZ-0.6PT and 0.4BMZ-0.6PT ceramics were 15.5 V and 10.3 V, respectively. shows the short-circuit current of the 0.4BNZ-0.6PT and 0.4BMZ-0.6PT ceramics. In the same condition as the voltage measurement, a pressure energy of 350 N was applied at a frequency of 0.18 Hz, during which the current peak value of the 0.4BNZ-0.6PT and 0.4BMZ-0.6PT ceramics were 1.35 μA and 1.16 μA, respectively. The generated power densities were calculated considering the sample size. The specimen diameter was approximately 10.5 mm and thickness was 1 mm. Therefore, power densities of 0.23 and 0.14 mW/cm3 were obtained from the 0.4BNZ-0.6PT and 0.4BMZ-0.6PT ceramics, respectively. Both 0.23 and 0.14 mW/cm3 were enough energy sources for the sensor applications.
Figure 10. (a) and (b) represent for open-circuit voltage and short-circuit current of 0.4Bi(Ni0.5Zr0.5)O3-0.6(Pb,Ti)O3 ceramics, while (c) and (d) represent for open-circuit voltage and short-circuit current of 0.4Bi(Mg0.5Zr0.5)O3-0.6(Pb,Ti)O3 ceramics, respectively
shows the measured voltage across the 1 μF capacitor. The full bridge rectifier was employed to collect the positive and negative output voltages from the 0.4BNZ-0.6PT and 0.4BMZ-0.6PT ceramics. The output voltages of 5.38 and 4.18 V were obtained for 0.4BNZ-0.6PT and 0.4BMZ-0.6PT, respectively. Additionally, the actual stored energy was calculated by measuring the stored voltage applied across the 1 μF capacitor. The stored energy was calculated using the following equation [Citation20]:
Figure 11. Stored voltage and energy density in the capacitor (1 μF) which showed in the . Figure (a) and (b) represent measured voltage and calculated energy density of 0.4Bi(Ni0.5Zr0.5)O3-0.6(Pb,Ti)O3 ceramics, while (c) and (d) represent voltage and energy density of 0.4Bi(Mg0.5Zr0.5)O3-0.6(Pb,Ti)O3 ceramics, respectively
where C is the capacitance of capacitor that stored the applied voltage and V is the measured voltage across the capacitor. The stored energy density was calculated considering the sample size. In this experiment, a load capacitor of 1 μF was employed. If the load capacitors are changed, then the applied voltage can be changed. Therefore, the generated output energy may also be changed; however, this is not true. The stored energy can be changed but the generated output energy cannot be changed. The main reason for choosing a capacitance of 1 μF was that we considered impedance matching methods. By considering impedance matching methods, optimized capacitors can be collected, and the stored energy can be optimized. Therefore, energy densities of 1.67 and 1.01 mJ/cm3 were obtained from the 0.4BNZ-0.6PT and 0.4BMZ-0.6PT ceramics, respectively. Meanwhile, the energy density of (33)-mode can be derived from the following (2) ~ (5) equations:
Substituting (2) to (4) into (5) gives the following equation:
where t is thickness (m), s is area (m2) and F is force (N). The energy density is produced by piezoelectric element is proportional to the transduction coefficient (d33× g33), where d33 is the piezoelectric charge coefficient and g33 is the piezoelectric voltage coefficient, given by g33 = d33/(ε0∙εr) [Citation22]. The optimized piezoelectric materials for energy harvesting should have both a high piezoelectric charge coefficient and a low dielectric constant. The piezoelectric voltage coefficients of 0.4BNZ-0.6PT and 0.4BMZ-0.6PT ceramics were 25.02 × 10⁻³ V∙m/N and 28.37 × 10⁻³ V∙m/N, respectively. In addition, the transduction coefficient of 10960 × 10−15 m2/N and 9960 × 10−15 m2/N were obtained from the 0.4BNZ-0.6PT and 0.4BMZ-0.6PT ceramics, respectively. We believe that the energy density of 0.4BNZ-0.6PT higher than 0.4BMZ-0.6PT is result from improving the transduction coefficient. lists the comparison of piezoelectric properties for the lead-based energy harvesters [Citation23–31]. Since energy harvesters converting environmental energy to electrical energy, in the case of low input energy, the generated output energy also relatively small [Citation27,Citation28]. And for the hybrid type energy harvester case, some energy can be converted to heat energy, the generated electrical energy can be small [Citation27]. As shown in the , 0.4BNZ-0.6PT and 0.4BMZ-0.6PT piezoelectric ceramics have relatively high output voltage and energy density compared to that of the different piezoelectric ceramics.
Table 1. Comparison of piezoelectric properties for the lead-based energy harvesters
4. Conclusions
For the first time, piezoelectric Bi(Ni0.5Zr0.5)O3-PbTiO3(BNZ-PT) and Bi(Mg0.5Zr0.5)O3-PbTiO3(BMZ-PT) ceramics were selected and compared for energy harvester applications. Although BNZ-PT and BMZ-PT ceramics have lower lead contents, they showed relatively high piezoelectric charge coefficient d33 with lower dielectric constant, which can replace PZT ceramics. XRD analysis results suggested that 0.4BNZ-0.6PT and 0.4BMZ-0.6PT ceramics were well-crystallized to form a rhombohedral and tetragonal mixture. The uniformity of grain growth and presence of porosity were also confirmed by FE-SEM images. As a result, it was confirmed that the sintering temperature had a significant effect on the grain size and density of BNZ-PT and BMZ-PT ceramics. The piezoelectric constants for 0.4BNZ-0.6PT and 0.4BMZ-0.6PT ceramics were 438 and 351 pC/N, respectively. Generated output energy densities of 1.67 and 1.01 mJ/cm3 were obtained from 0.4BNZ-0.6PT and 0.4BMZ-0.6PT, respectively. These results demonstrate that the proposed the 0.4BNZ-0.6PT is an outstanding candidate for utilize in the piezoelectric energy harvester with a lower lead content.
Disclosure statement
No potential conflict of interest was reported by the authors.
Additional information
Funding
References
- Dondi D, Bertacchini A, Brunelli D, et al. Modeling and optimization of a solar energy harvester system for self-power wireless sensor networks. IEEE Trans Ind Electron. 2008;55:2759–2766.
- Tang L, Yang Y. A nonlinear piezoelectric energy harvester with magnetic oscillator wireless sensor networks. Appl Phys Lett. 2012;101:094102.
- Adhikari S, Friswell MI, Inman DJ. Piezoelectric energy harvesting from broadband random vibrations. Smart Mater Struct. 2009;18:115005.
- Dutoit NE, Wardle BL, Kim SG. Design considerations for MEMS-scale piezoelectric mechanical vibration energy harvesters. Integr Ferroelectr. 2005;71:121–160.
- Herbert JM. Ferroelectric Transducers and Sensors. New York (NY): Gordon and Breach, Science Publishers; 1982.
- Sun FP, Chaudhry Z, Liang C, et al. Truss structure integrity identification using PZT sensor-actuator. J Intell Mater Syst Struct. 1995;6:134–139.
- Li S, Chen S. Analytical analysis of a circular PZT actuator for valveless micropumps. Sens Actuators, A. 1994;104:151–161.
- Li Y, Horowitz R, Evans R. Vibration control of a PZT actuated suspension dual-stage servo system using a PZT sensor. IEEE Trans Magn. 2003;39:932–937.
- Wang D, Cao M, Zhang S. Piezoelectric properties of PbHfO3–PbTiO3–Pb(Mg1/3Nb2/3)O3 ternary ceramics. Phys Status Solidi RRL. 2012;6:135–137.
- Wang D, Cao M, Zhang S. Piezoelectric ceramics in the PbSnO3–Pb(Mg1/3Nb2/3)O3–PbTiO3 ternary system. J Am Ceram Soc. 2011;94(11):3690–3693.
- Saleem M, Hwan LD, Kim I, et al. Frequency-dependent properties of Bi-based relaxor/ferroelectric ceramic composites. Sci Rep. 2018;8:14146.
- Ahn JH, Koh JH. Enhanced piezoelectric properties of (Bi,Sc)O3-(Pb,Ti)O3 ceramics by optimized calcination process. J Alloys Compd. 2016;689:138–144.
- Sahu T, Behera B. Dielectric, electrical and conduction mechanism study of 0.6BiFeO3–0.4PbTiO3. Trans Electr Electron Mater. 2018;19:396–402.
- Duan R, Speyer RF, Alberta E, et al. High Curie temperature perovskite BiInO3–PbTiO3 ceramics. J Mater Res. 2004;19:2185–2193.
- Rong Y, Chen J, Kang H, et al. Large Piezoelectric response and polarization in relaxor ferroelectric PbTiO3–Bi(Ni1/2Zr1/2)O3. IEEE Trans Magn. 2013;96:1035–1038.
- Fan L, Chen J, Wang Q, et al. High piezoelectric performance and temperature dependence of ferroelectric and piezoelectric properties of Bi(Mg0.5Zr0.5)O3–PbTiO3 near morphotropic phase boundary. Ceram Int. 2014;40:7723–7728.
- Wang D, Li J, Cao M, et al. Effects of Nb2O5 additive on the piezoelectric and dielectric properties of PHT-PMN ternary ceramics near the morphotropic phase boundary. Phys Status Solidi A. 2014;211:226–230.
- Wang D, Zhao Q, Cao M, et al. Dielectric, piezoelectric, and ferroelectric properties of Al2O3 and MnO2 modified PbSnO3–PbTiO3–Pb(Mg1/3Nb2/3)O3 ternary ceramics. Phys Status Solidi A. 2013;210:1363–1368.
- Wang D, Cao M, Zhao Q, et al. Dielectric and piezoelectric properties of manganese-modified PbHfO3–PbTiO3–Pb(Mg1/3Nb2/3)O3 ternary ceramics with morphotropic phase boundary compositions. Phys Status Solidi RRL. 2013;7:221–223.
- Shin DJ, Koh JH. Comparative study on storing energy for (Ba,Zr)TiO3 and CuO-(Ba,Zr)TiO3 ceramics for piezoelectric energy harvesting applications. Ceram Int. 2017;43:S649–S654.
- Shin DJ, Kim J, Koh JH. Piezoelectric properties of (1-x)BZT-xBCT system for energy harvesting applications. J Eur Ceram Soc. 2018;38:4395–4403.
- Xiaol Y, Yudong H, Haiyan Z, et al. The role of secondary phase in enhancing transduction coefficient of piezoelectric energy harvesting composites. J Mater Chem C. 2019;7:3479–3485.
- Berdy DF, Srisungsitthisunti P, Jung B, et al. Low-frequency meandering piezoelectric vibration energy harvester. IEEE Trans Ultrason Ferroelectr Freq Control. 2012;59:846–858.
- Roundy S, Wright PK, Rabaey J. A study of low level vibrations as a power source for wireless sensor nodes. Comput Commun. 2003;26:1131–1144.
- Xu CN, Akiyama M, Nonaka K, et al. Electrical power generation characteristics of PZT piezoelectric ceramics. IEEE Trans Ultrason Ferroelectr Freq Control. 1998;45:1065–1070.
- Erturk A, Bilgen O, Inman DJ, et al. Power generation and shunt damping performance of a single crystal lead magnesium niobite-lead zirconate titanate unimorph: analysis and experiment. Appl Phys Lett. 2008;93:224102.
- Xie J, Mane XP, Green CW, et al. Performance of thin piezoelectric materials for pyroelectric energy harvesting. J Intell Mater Syst Struct. 2010;21:243–249.
- Mo C, Clark WW, Radziemski LJ. Energy harvesting with piezoelectric unimorph circular diaphragms. Proceedings of SMASIS08 ASME Conference on Smart Materials, Adaptive Structures and Intelligent Systems; 2008 Oct 28–30; Ellicott City, Maryland, USA: ASME press; 2009. p. 365–370.
- Kim J, Yoon S, Ji JH, et al. Enhanced ferroelectric and piezoelectric properties of (1-x)PMN-xPT ceramics based on a partial oxalate process. Materials. 2018;11:2247.
- Park MY, Ji JH, Koh JH. Relaxation-related piezoelectric and dielectric behavior of Bi(Mg,Ti)O3–PbTiO3 ceramic. Sensors. 2019;19:2115.
- Kim BS, Ji JH, Kim HT, et al. Improved multilayered (Bi,Sc)O3-(Pb,Ti)O3 piezoelectric energy harvesters based on impedance matching technique. Sensors. 2020;20:1958.