
 ?Mathematical formulae have been encoded as MathML and are displayed in this HTML version using MathJax in order to improve their display. Uncheck the box to turn MathJax off. This feature requires Javascript. Click on a formula to zoom.
ABSTRACT
Lead free ferroelectric ceramic Ba4Sm2Hf4Nb6O30(BSHN) with tungsten bronze structure was synthesized and characterized. The effect of B-site cation electron configuration (Hf and Zr) on origin of ferroelectricity and polarization reversal was also studied in detail. The X-ray diffraction (XRD) pattern was indexed with tetragonal tungsten bronze in P4bm space group for BSHN. Obvious dielectric anomaly was observed in the temperature dependent permittivity curve, and quite large thermal hysteresis was obtained from the differential scanning calorimetry (DSC) result. While at lower temperature (<TC), there are two distinct dielectric relaxations for BSHN, respectively related to the activation of frozen polar region and activation of the fully free reversal for the polarization. Compared with Ba4Sm2Zr4Nb6O30(BSZN), Hf substitution in B site makes it harder to activate the frozen polar nanoregion but easier to realize free polarization reversal. This could be further confirmed by the measured polarization-electric field (P-E) curve. Meanwhile, the Raman modes intensity showed gradual change rather than abrupt one for BSHN when the temperature increased through the Curie point, which was quite different from the Zr based compounds. The difference in BO6 octahedral tilting, B-site cation’s electron configuration and B-O bond character are the main cause of these distinct dielectric and ferroelectric property.
1. Introduction
Ferroelectric materials are widely used in devices such as high-performance capacitors, pyroelectric sensors, piezoelectric actuators, electro-optic devices and polarization based nonvolatile memories [Citation1–4]. All these applications originate from existence of the material’s unique spontaneous polarization. Fundamental studies of the mechanism related to this, and the detailed scenario of the ferroelectric transition, are still in controversial, especially for some materials with complex structure. Meanwhile, recent studies found that multiple polarization mechanisms as well as polar regions with different correlation length may coexist in one material [Citation5–8], making this problem even more complicated. The core of these problems is the formation of long range polar order and the distribution of it, including the influence of chemical doping, thermal treatment, grain size engineering and so on [Citation9–11]. Chemical doping provides an effective way to deeply explore the origin of long range polar order and to manipulate the ferroelectric character, such as the transition temperature, the remanent polarization, the ferroelectric domain structure and the relaxor behavior.
Many studies have been carried out to explore the effect of chemical modification on the ferroelectric polar order. For ABO3 perovskites, like BaTiO3, Zr, Hf, Sc, Ce, Ca, Cd etc. are usually doped at Ti or Ba sites, depending on the level of substitutions, these materials show either classical or relaxor ferroelectric nature [Citation12–14]. For instance, it is found that due to the difference in cation size, electron configuration and polarizability, Zr, Hf or Sc substitution at Ti site usually leads to the increase of resistivity, structural disorder and formation of short-range polar nanoregions [Citation15,Citation16]. For tungsten bronze who is also one of the most important class of ferroelectrics, more possibilities of cation manipulation is provided due to their special structure. The general formula of the compound is (A1)2(A2)4(C)4(B1)2(B2)8O30, the skeletons are built up by 10 corner-sharing BO6 octahedral, and three different kinds of cavities(including pentagonal (A2), quadrangular (A1), and small triangular (C, usually empty)) are formed when viewed along the c axis [Citation17]. This structure undoubtedly includes more flexibilities, and the fundamental explanation of the origin of spontaneous polarization is still under discussion. One possible origin is the displacement of B-site ferroelectrically active cation along the polar axis, therefore, occupation of B-site plays dominating role in the evolution of structure and the associated ferroelectric property [Citation18]. According to previous studies, when B-site is occupied by Ta and Nb which have the same cation size but different electronic configuration, the compound shows gradual change from relaxor to normal ferroelectric transition when Nb content increases, the Raman mode and Raman intensity also exhibit the similar changing trend, experimental results such as the X-ray photoelectron spectroscopy (XPS) data prove that the less covalency of Ta–O bond than Nb–O bond contributes to this [Citation19–21].
The B site of tungsten bronze is also often occupied by Ti, Zr or Hf, considering their different cation size, electronic configuration and polarizability, the situation is even more complex. Previous studies found that for Ti and Zr based compounds, when gradually increase Zr substitutions for Ti, the dielectric and ferroelectric property show abrupt change at a critical point of Zr content, rather than showing gradual change when Zr content slowly raises [Citation22]. The large size difference is the main factor leading to this phenomenon. It is found that large cation size difference between Zr4+ and Ti4+ causes a mismatch in the local structure and therefore produces local strain. Meanwhile, stable Ti–O–Ti–O long range polar order chain is formed through the strongly correlated TiO6 octahedral, then even very small amount of Zr added to the TiO6 framework will entirely destroy their correlation and largely affect the ferroelectric transition process. Previous studies have paid much attention to the cation size effect, however, the influence of different electronic configuration of Zr, Ti, or Hf on the correlation length for polar order has barely been explored. Zr and Hf have almost the same cation size (Zr4+: 0.72 Å; Hf4+: 0.71 Å), but different electronic configuration, and they provide a suitable case to explore the effect of electronic configuration of B-site cation on the ferroelectric properties. When B site is occupied by Zr and ferroelectrically active cation Nb simultaneously, like Ba4Sm2Zr4Nb6O30, it exhibits normal ferroelectric behavior which shows obvious dielectric anomaly along with large thermal hysteresis [Citation23], but how is the dielectric and ferroelectric property for Hf based compounds, and how Hf substitution on B-site affects the octahedral tilting still remain unknown.
In this study, Ba4Sm2Hf4Nb6O30 tungsten bronze ceramic was synthesized and characterized. The crystal structure, dielectric and ferroelectric properties were investigated, the vibrations of different Raman modes as well as B–O bond covalency were also explored in detail. Through property analysis for compounds like Ba4Sm2Hf4Nb6O30 and Ba4Sm2Zr4Nb6O30, the effect of B-site cation electronic configuration on local crystal chemical environment and the formation of polar order can be obtained, and this will enhance a further understanding of the origin of ferroelectricity in tungsten bronzes.
2. Experimental procedure
BaCO3 (99.9%), Sm2O3 (99.99%), HfO2(98%), and Nb2O5 (99.9%) were used as raw materials and mixed in stoichiometric proportions. Then the mixed powders were ball milled with zirconia balls and ethanol for 24 h. Then the resulting mixtures were dried and calcined at 1350°C for 3 h. Then the powders were re-milled and pressed into pellets with 12 mm in diameter and around 2 mm in thickness. The pellets were sintered at 1485°C for 3 h to obtain dense ceramics.
After polished and thermally etched at a temperature of 1350°C for 30 min, the sample was evaluated by a scanning electron microscopy (S-4800; Hitachi, Tokyo, Japan) to view the microstructures. Powder XRD patterns were identified by a diffractometer (D/max 2550/PC, Rigaku Co., Tokyo, Japan) with CuKα radiation at room temperature. The XRD data for Rietveld analysis were collected over the range of 2θ = 8°–130°, with a step size of 0.02° and a count time of 2 s. The FullProf program was used for Rietveld structural refinement. The dielectric properties were evaluated with a broadband dielectric spectrometer (Turnkey Concept 50; Novocontrol Technologies, Hundsangen, Germany) in the temperature range of −140°C to 300°C and over a frequency range of 100 Hz to 1 MHz. The dielectric properties were tested by an LCR analyzer (Agilent 4294A, Santa Clara, CA) with a temperature-controlled cavity (VDMS 2000, Partulab, China) in the temperature range of 300°C to 40°C and over a frequency range of 100 Hz to 1 MHz. Silver paste was adopted as the electrodes before measurement. P-E hysteresis loop was measured using a Precision Materials Analyzer (RT Premier II, Radiant Technologies Inc., Albuguerque, NM), and the gold was sputtered on the two sides of ceramics as the electrodes. Thermal analysis was performed using a differential scanning calorimeter (204F1, Netzsch, Phoenix, AZ) in Ar. The Raman spectra were characterized by a Raman spectroscopy (HR-800 LabRama, Jobin Yvon, Paris, France) using the ceramic powders in the temperature ranges from 30°C to 350°C and from 350°C to 30°C. The XPS measurement was performed in an X-ray photoelectron spectrometer (Nexsa, Thermo Fisher Scientific, MA, USA) irradiated with AlKa.
3. Results and discussions
Dense Ba4Sm2Hf4Nb6O30 ceramic can be obtained by sintering at 1485°C in air for 3 h, the densities of the pellets are 6.72 g/cm3, which is above 95% of the theoretical density. The scanning electron microscope (SEM) is shown in , the sample shows the pillar grain morphology which indicates that the cell parameter c is less than a and b. Compared with other tetragonal tungsten bronzes, such as Ba4Sm2Zr4Nb6O30 [Citation23], the grain size of Ba4Sm2Hf4Nb6O30 is much smaller, and it tends to form more condensed structure. The XRD pattern at room temperature is shown in , it was indexed as tetragonal tungsten bronze structure and refined with P4bm space group, no secondary phase was detected in the compound. The refinement converges to the satisfying agreement factors: Rp ~ 8.61, Rwp ~ 12.5, and χ2 ~ 6.52. The calculated lattice parameters a = b = 12.6019 Å, c = 3.9609 Å, and the tetragonality value c/a = 0.9939, it is worth noting that the c/a value is smaller than analogues with other B-site substitutions like Ba4Sm2Ti4Nb6O30 and Ba4Sm2Zr4Nb6O30 [Citation23,Citation24], indicating the reduced tetragonality of the compound. Meanwhile, based on the Rietveld refinement results, the polyhedral representations describing the octahedral distortions of the two kinds of octahedra B(1)O6 and B(2)O6 for Ba4Sm2Hf4Nb6O30 along the b-axis are shown in ). In B(2)O6 octahedral, the bond length for Hf/Nb(2)-O(4) and part of Hf/Nb(2)-O(5) is much smaller than other Hf/Nb-O bond in the ab plane, demonstrating that Hf/Nb(2) cations show obvious displacement along the ab plane and Hf/Nb(2)O6 octahedral exhibit severe distortion. To obtain deeper understanding of the octahedral deformation, the polyhedral representation of BSZN was also shown in ). Compared with BSHN, the deformation of Zr/Nb(2)O6 octahedral for Zr based compounds is less apparent. That is, B(2)O6 octahedral of BSHN shows stronger tilting deformation and B-site cation of B(2)O6 octahedral provides larger ab plane displacement, which may somehow contribute to the disorder of the polar order. While in B(1)O6 octahedral of the two compounds, the displacement of Zr/Nb(1) along the c-axis is larger compared with Hf/Nb(1), these may have an effect on their dielectric and ferroelectric properties.
Figure 1. SEM micrograph of Ba4Sm2Hf4Nb6O30 ceramic.
Figure 2. Rietveld analysis result of XRD pattern at room temperature for Ba4Sm2Hf4Nb6O30 ceramic (experimental data: circles; calculated data: upper lines, and difference: bottom lines).
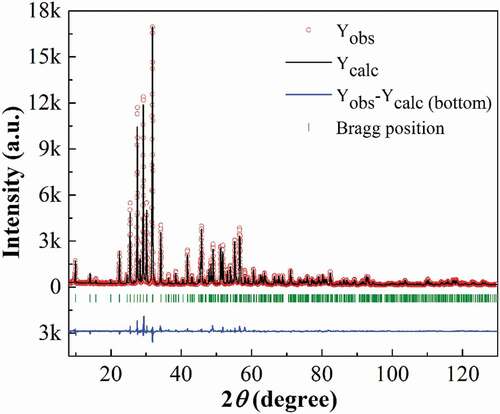
Figure 3. The polyhedral representations describing the octahedral distortions of the two kinds of octahedral B(1)O6 and B(2)O6 in Ba4Sm2Hf4Nb6O30(a) and Ba4Sm2Zr4Nb6O30(b) [Citation23] along the b-axis.
![Figure 3. The polyhedral representations describing the octahedral distortions of the two kinds of octahedral B(1)O6 and B(2)O6 in Ba4Sm2Hf4Nb6O30(a) and Ba4Sm2Zr4Nb6O30(b) [Citation23] along the b-axis.](/cms/asset/3ff9fb7c-6690-4998-becc-13a4f6f1cfcc/tace_a_2062809_f0003_oc.jpg)
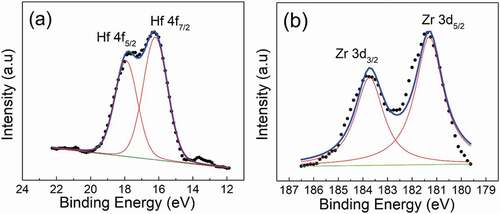
In order to further explore the local chemical environment of Hf–O and Zr–O bond, the XPS analysis was performed. The XPS data of BSHN and BSZN was shown in . According to previous reports about molecular orbital calculations [Citation25,Citation26], if electrons shared between atoms are growing for chemical bonds, the atomic population QAB will increase thus leading to the increase in bond covalency and smaller shift of core orbital binding energy. Based on the studies of many compounds [Citation25,Citation26], stronger bond covalency is normally related to stronger ferroelectricity. Here, the binding energy of Hf4f7/2 of BSHN is 16.125 eV, about 0.25 eV lower than that for Hf4f7/2 of HfO2 which is 16.375 eV measured in the same equipment. However, the binding energy of Zr3d5/2 of BSZN is 181.375 eV, which is almost the same with that of Zr3d5/2 of ZrO2 which is also 181.375 eV. The larger value of energy difference between Hf4f7/2 of BSHN and Hf4f7/2 of HfO2 demonstrates that Hf–O bonds are more ionic and less covalent than the Zr–O bonds, corresponding to stronger relaxor nature. Nevertheless, the energy shift of BSHN is not so large as some typical relaxor ferroelectrics [Citation27], whether it is relaxor or normal ferroelectric remains further exploring.
Figure 4. XPS spectroscopy of Hf4f peak for Ba4Sm2Hf4Nb6O30 ceramic (a) and Zr3d peak for Ba4Sm2Zr4Nb6O30 ceramic (b) (experimental data: black dots; fitting curves: blue lines).
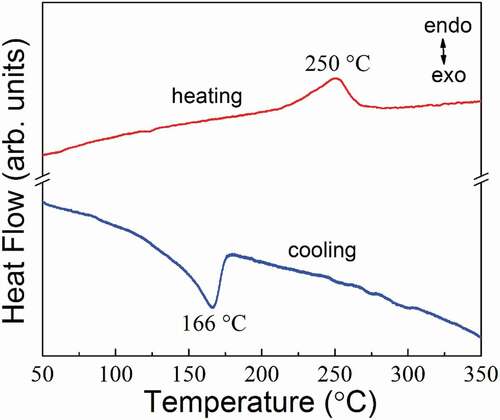
To investigate the ferroelectric transition process, DSC measurement was performed for BSHN during the heating and cooling cycle, as shown in . It shows an endothermic peak at 250°C on heating, and an exothermic peak at 166°C on cooling, indicating typical first order ferroelectric transition, along with very large thermal hysteresis of about 84°C. The thermal hysteresis generally reflects the difficulty associated with the spontaneous nucleation of the ferroelectric domains during cooling, the larger value here indicates that the ferroelectric transition process is more relaxor and stable long range ferroelectric polar order is more difficult to form.
Figure 5. DSC curves of Ba4Sm2Hf4Nb6O30 during the heating and cooling cycles.
shows the temperature dependent dielectric permittivity and dielectric loss curves for BSHN with the measuring frequency from 100 Hz to 1 MHz on both heating (−140°C-300°C) and cooling process (300°C-40°C). During heating, the dielectric permittivity curve exhibits an apparent dielectric anomaly at 220°C, with almost no frequency dispersion. Meanwhile, just at temperature about 50°C lower than the peak temperature, the permittivity of the compound begins to distribute in a wider range for different frequencies, which even exists to far below the room temperature. This can also be observed from the dielectric loss data. The dielectric relaxation behavior of the compound is investigated through the dielectric loss curve ()). There are two peaks in the curve measured at different frequencies. The left side one is more apparent at lower frequencies, and with the frequency increasing, it gradually merges with the right side one. The evolution of these two dielectric loss peaks with temperature and frequency gives some valuable information about the detailed activation and reversal process for the ferroelectric polar order. Taking the 100 Hz curve as an example, the lower temperature peak appears at about −17°C, since low temperature relaxation is quite common for tungsten bronzes, and combining the temperature dependent dielectric loss of Ba4Sm2Hf4Nb6O30 and Ba4Sm2Hf2Zr2Nb6O30, as shown in ), with the previous exploration of low temperature relaxation behavior of Ba4Sm2Zr4Nb6O30 [Citation23], it can be concluded that the low temperature dielectric loss peak of Ba4Sm2Hf4Nb6O30 indicates the activation process of the frozen polar nano region. The higher temperature peak appears at about 44°C, this peak can be observed for curves of all frequencies and shifts to higher temperature side with frequency increasing. Combining the previous studies of the relaxation process of tungsten bronzes, this peak may originate from the polarization reversal for polar order which has just been activated, from their original disordered directions to the same direction parallel to the imposed electric field. This polarization reversal process occurs immediately after the frozen polar region activating, as can be seen from the data, and with increasing frequency, these two process almost merges with each other indicating that they tend to happen at the same time. To make a deeper understanding of the process, the permittivity and dielectric loss were also evaluated during the cooling process from 300°C to 40°C, as shown in ) and (c). In the permittivity curve, there is an apparent peak at about 160°C which is 60°C lower than the peak in heating process, as can be clearly seen in the inset of ), revealing the character of normal ferroelectric transition. Meanwhile, the relative sharp increase of permittivity at the transition point(160°C) confirms the sudden change from disordered paraelectric phase to ordered ferroelectric phase, it is different from the gradual polar order changing on heating process, and it is consistent with the above discussions of DSC results.
Figure 6. Temperature dependences of dielectric permittivity (a) and dielectric loss
(b), (c) on heating and cooling process for Ba4Sm2Hf4Nb6O30 ceramic. The inset in (a) presents the permittivity curve during heating and cooling process measured at 10 kHz, inset in (b) shows the temperature dependence of dielectric loss
for Ba4Sm2Zr4Nb6O30 [Citation23] (upper right corner) and Ba4Sm2Hf2Zr2Nb6O30 ceramic (lower left corner) measured at −140°C to 300°C.
![Figure 6. Temperature dependences of dielectric permittivity ε′ (a) and dielectric loss tanδ (b), (c) on heating and cooling process for Ba4Sm2Hf4Nb6O30 ceramic. The inset in (a) presents the permittivity curve during heating and cooling process measured at 10 kHz, inset in (b) shows the temperature dependence of dielectric loss tanδ for Ba4Sm2Zr4Nb6O30 [Citation23] (upper right corner) and Ba4Sm2Hf2Zr2Nb6O30 ceramic (lower left corner) measured at −140°C to 300°C.](/cms/asset/5008f8c8-9d13-4b0f-a840-7951a398aea6/tace_a_2062809_f0006_oc.jpg)
Compared the dielectric loss curve of BSHN with the Zr based analogue on heating process, as shown in the inset of , there is some difference. The dielectric loss peak in the left side, which is related to the activation of the frozen polar nano region, appears at higher temperature for BSHN, indicating the increased difficulty to activate the frozen polar order, which corresponds with the above discussion that BSHN exhibits larger polarization component along ab plane, and the direction of the polar order distributes in a wider range for BSHN. In the meantime, the relaxation peaks of left side and right side of BSHN almost merges together, that is, there is some overlap between the process of activation for frozen polar region and the later reversal of polar order. For BSZN(see the right inset [Citation23] of ), the situation is different. The activation process occurs earlier, there is an apparent boundary between this process and the latter reversal process. The following reversal process occurs at higher temperature, meaning that its energy barrier is larger. At the same time, the polar order reversal is stronger and independent of the frequency, this indicates that there are three complete and distinguished process in the related range when increasing the temperature for BSZN. First, the frozen polar regions have been activated (the first peak); second, they rotated to similar polar direction close to the electric field direction but not parallel to it, and reached a transient state (the second peak); third, at higher temperature, all polar order reverse to the direction along the imposed electric field, and this process is independent with the frequency (the third peak). So the activation and reversal process for the ferroelectric polar region are different for BSHN and BSZN.
The above speculations can be further confirmed by the DSC results and P-E curves of BSHN. It is interesting to find that the entropy of the exothermic process (area circled by the blue curve) is larger than the endothermic process (area circled by the red curve), and the exothermic peak distributes in a wider temperature range. The reason is that theoretically the endothermic entropy is related to the energy difference between the frozen polar regions and the paraelectric phase, while experimentally, when increasing the temperature, the frozen polar region first activate then the polarization rotate to the similar direction, the energy absorbed in this process is hard to detect from the instrument for it is a relaxation process. While the exothermic entropy mainly connects with the energy difference between the disordered paraelectric phase and the ordered ferroelectric phase, and the energy of changing the ordered ferroelectric phase to the low temperature relaxation state. So it is reasonable that the endothermic and exothermic process entropy show large difference.
The polarization-electric field curve (see ) is measured at ambient temperature with a triangular wave form at 10 Hz under an applied electric field of 200 kV/cm, which is much higher than the coercive electric field. It shows saturated nonlinear P-E curve with the maximum polarization of 7.6 μC/cm2, and remanent polarization of 2.9 μC/cm2. Abrupt peaks are obtained in the I-E curve, indicating the polarization reversal in the process. Although the polar order direction of Ba4Sm2Hf4Nb6O30 at low temperature distribute in a wide range, the maximum polarization and remanent polarization of BSHN at room temperature is larger than the Zr based analogue no matter on the low or high electric field, and it is easier for BSHN to obtain saturated P-E curve. These correspond well with the above dielectric analysis. The P-E curve is measured at room temperature which is very near to the reversal stage for BSHN, but far below the same stage for BSZN, as can be seen from the dielectric data. Under the imposed electric field (>Ec), polar order for BSHN is much easier to reach the reversal state and higher proportion of polar order are able to rotate to the direction parallel to the electric field, so BSHN tend to show larger Pmax and Pr, consistent with the above discussions. However, with the electric field increasing, the difference of Pmax and Pr become smaller, as shown by , for the large electric field gives BSZN extra energy to overcome the energy barrier. Take an example, under large external electric stimuli like 100 kV/cm here, the polarization of all directions tend to rotate to the direction parallel to the electric field direction, so the Pmax for BSHN does not show too much difference with the Zr based analogue.
Figure 7. Polarization-electric field (P-E) and current-electric field (I-E) curves measured at ambient temperature with a triangular wave form at 10 Hz for Ba4Sm2Hf4Nb6O30 ceramic.
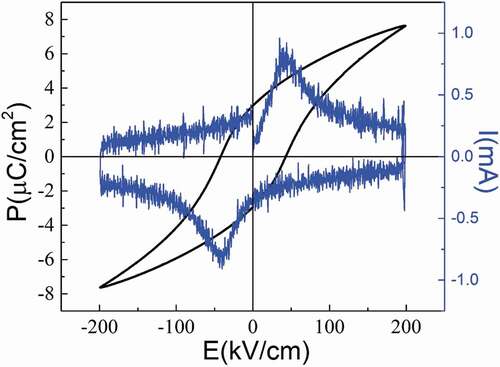
Figure 8. The difference of the maximum polarization Pm and remanent polarization Pr between Ba4Sm2Hf4Nb6O30 and Ba4Sm2Zr4Nb6O30 under various applied electric fields (Pm1 and Pr1: maximum polarization and remanent polarization for Ba4Sm2Hf4Nb6O30; Pm2 and Pr2: maximum polarization and remanent polarization for Ba4Sm2Zr4Nb6O30).
To further detect the relation between the ferroelectric transition and the relevant structure change, the reduced Raman spectra measured from 30°C to 350°C are given in . In order to exclude the effect of temperature disturbation, the thermal population effects should be eliminated from the obtained Raman experimental results, and reduced intensity can be calculated from the following relationship:
Figure 9. Reduced Raman spectra within temperature ranges from 30°C to 350°C on heating process for Ba4Sm2Hf4Nb6O30 (a) and the temperature dependence of 622 cm−1 Raman mode intensity on heating for Ba4Sm2Hf4Nb6O30 and Ba4Sm2Zr4Nb6O30 [Citation21] ceramics (b); reduced Raman spectra within temperature ranges from 350°C to 30°C on cooling process for Ba4Sm2Hf4Nb6O30 (c) and the temperature dependence of 622 cm−1 Raman mode intensity on cooling for Ba4Sm2Hf4Nb6O30 (d).
![Figure 9. Reduced Raman spectra within temperature ranges from 30°C to 350°C on heating process for Ba4Sm2Hf4Nb6O30 (a) and the temperature dependence of 622 cm−1 Raman mode intensity on heating for Ba4Sm2Hf4Nb6O30 and Ba4Sm2Zr4Nb6O30 [Citation21] ceramics (b); reduced Raman spectra within temperature ranges from 350°C to 30°C on cooling process for Ba4Sm2Hf4Nb6O30 (c) and the temperature dependence of 622 cm−1 Raman mode intensity on cooling for Ba4Sm2Hf4Nb6O30 (d).](/cms/asset/6a40c2e6-42eb-4e13-b502-04abccfad9f1/tace_a_2062809_f0009_oc.jpg)
where I(υ) is the measured Raman intensity and υ is the wave number at which the intensity is measured [Citation28], while n(υ) is the Bose factor expressed as:
where k is the Boltzmann’s constant, h is the Planck’s constant and T is the measured temperature. For tungsten bronzes, Raman vibrations around 250, 556, 630 and 830 cm−1 are normally defined as the internal modes, which stem from the vibration of the BO6 octahedral. Raman modes at 250 and 630 cm−1 are respectively the bending and stretching modes of BO6 octahedral, while the 830 cm−1 mode is associated with the deformation of BO6 [Citation29,Citation30]. However, vibrations around 78, 110, 195, 325, 440 and 462 cm−1 are generally related to the external modes, which are normally correlated with the vibrations of the A site cations, such as the low wave number modes at 75 and 88 cm−1, they are relevant to the motion of A site cation [Citation31,Citation32].
With temperature increasing from room temperature to higher than TC, the Raman intensity of some external modes such as 77, 131, 148, 433 and 465 cm−1 decrease, and modes at 433 and 465 cm−1 finally disappeared at about 270°C, which means that A-site cation vibrations, like the motion of A site cation, become more and more inactive when goes near the ferroelectric transition temperature. The internal modes like 563, 622 and 829 cm−1 show red-shift with temperature increasing, indicating that the octahedral deformation gradually changes when temperature goes near the TC. Meanwhile, although the compound exhibits typical first order ferroelectric transition, the Raman mode intensity of this compound when it goes through the ferroelectric temperature also show gradual change, quite different from the case of BSZN whose Raman intensity shows sharp decline when it goes through the transition temperature, as shown in ), which shows the temperature dependent Raman intensity of the 622 cm−1 mode. The Raman modes intensity normally increases when with temperature rising owing to the Bose-Einstein factor. However, above the ferroelectric transition temperature, only symmetric modes are Raman active while all the anti-symmetric vibration modes are inactive, so a reduction of the Raman intensity could be expected for ferroelectrics [Citation28,Citation32]. This special changing trend further confirms that the order-disorder transition of ferroelectric polar order for Hf based compounds is a gradual changing process, while for compounds like BSZN who has stronger ferroelectricity along the Nb-O-Nb-O chain, the Raman intensity usually shows abrupt change when the order-disorder polar order transition occurs, consistent with the above dielectric and ferroelectric properties. The reduced Raman spectra and the temperature dependence of 622 cm−1 Raman mode intensity on cooling process were also shown in ) and (d). It can be seen that the Raman intensity shows abrupt increase at 170°C which is close to the transition point on cooling, and this sudden changing is quite different from the gradual changing trend on heating process, it provides similar results with the DSC and dielectric property measurement, and further confirms the speculation of the above relaxation and the polar order response behavior.
From the above results, the structure analysis shows that BSHN exhibits more severe octahedral tilting, the displacement of B-site cation along the ab plane is larger, while the displacement along c-axis is limited. Corresponding to this special structure, the polarization direction of BSHN distributes in a wider range compared with the Zr based compound at low temperature. The stronger relaxor nature of BSHN was further confirmed by the temperature dependent Raman spectra which shows gradual change of Raman vibration mode and Raman intensity, as well as the XPS analysis which presents Hf-O bonding with more ionic nature. For tungsten bronzes, A- and B-site cation size directly affect the octahedral tilting and the crystal-chemical framework, thus leading to the formation of different long range or short range polar order [Citation22,Citation33,Citation34]. Here, the cation size of Hf and Zr are almost the same, so the effect of B-site size on the ferroelectricity can be neglected. But considering their electron configuration, the different chemical bond character may be the determinate factor to this property change. But since the chemical bond character and the octahedral tilting degree have not reached the critical point which may lead to the complete collapse of the Nb-O-Nb-O polar order and the octahedral tilting correlated framework, so the long range ferroelectric correlation has not been absolutely disturbed, BSHN still exhibits first order ferroelectric transition, however, the transition of polarization from ordered ferroelectric state to disordered paraelectric state, or inversely from disordered paraelectric state to ordered ferroelectric state, is a gradual rather than abrupt change which reflects the relaxor character. Meanwhile, for these two ferroelectric compounds, it is also interesting to find that due to the different crystal structure and bond character, the energy barrier for activating the frozen polar region and the following stage-realizing free polarization reversal are distinguished. It is harder for BSHN to activate the frozen polar nano regions, but once they are activated, the stimuli of free polarization reversal will take place immediately after the former activation process. So under high electric field(>Ec) at room temperature, frozen polar regions of BSHN have been fully activated, then polarization for BSHN is much easier to reach the fully reversal state and higher proportion of polar order are able to rotate to the direction parallel to the electric field, so BSHN tend to show larger Pmax and Pr.
4. Conclusion
In summary, effect of B-site cation’s electron configuration on ferroelectric polar order for BSHN and BSZN was explored. The tetragonal tungsten bronze structure with P4bm space group was confirmed at the room temperature for BSHN, along with reduced tetragonality and more severe octahedral distortion compare with the Zr based analogue. The XPS analysis shows weaker covalency of Hf-O bond than the Zr-O bond, and the difference is not too large. First order ferroelectric transition with TC of 250°C and large thermal hysteresis was observed for BSHN. Meanwhile, there are two distinct dielectric relaxation in the temperature below the Curie point, respectively corresponding to the process of frozen polar region activation and free reversal of the already activated polar order. Compared with BSZN, BSHN needs higher energy to activate the frozen polar region but lower energy to realize fully polarization reversal at temperature below TC. Saturated P-E curve was observed when lower electric field is imposed for BSHN, for whom the maximum polarization and the remanent polarization were also larger than BSZN, however with the electric field increasing, the difference became smaller. At the same time, the Raman modes for BSHN show gradual change rather than the abrupt one when the temperature increases and goes through the Curie point, which was quite different from the Zr based compound. The difference in BO6 octahedral tilting, electron configuration of B-site cation and B–O bond character are the main cause of these distinct dielectric and ferroelectric property.
Acknowledgments
This work was supported by National Natural Science Foundation of China under Grant No. 52102134, Natural Science Foundation of the Jiangsu Higher Education Institutions of China under Grant No. 20KJB430024, High Level Innovative and Entrepreneurial Personnel Project of Jiangsu Province and Youth Foundation of Nanjing Xiaozhuang University under Grant No. 2019NXY45.
Disclosure statement
No potential conflict of interest was reported by the authors.
Additional information
Funding
References
- Qiu C, Wang B, Zhang N, et al. Transparent ferroelectric crystals with ultrahigh piezoelectricity. Nature. 2020;577:350–354.
- Sharma P, Zhang Q, Sando D, et al. Nonvolatile ferroelectric domain wall memory. Sci Adv. 2017;3:e1700512.
- Tang ZX, Ge PZ, Tang XG, et al. Pyroelectric energy harvesting and ferroelectric properties of PbxSr1-xTiO3 ceramics. J Asian Ceram Soc. 2020;8(4):1147–1153.
- Pandya S, Wilbur J, Kim J, et al. Pyroelectric energy conversion with large energy and power density in relaxor ferroelectric thin films. Nat Mater. 2018;17(5):432–438.
- Ondrejkovic P, Kempa M, Kulda J, et al. Dynamics of nanoscale polarization fluctuations in a uniaxial relaxor. Phys Rev Lett. 2014;113:167601.
- Pasciak M, Kopecky M, Kub J, et al. X-ray diffuse scattering observations for SrxBa1−xNb2O6 single crystals with x =0.35 and 0.81. Phase Trans. 2018;91:969–975.
- Buixaderas E, Kempa M, Svirskas Š, et al. Dynamics of mesoscopic polarization in the uniaxial tetragonal tungsten bronze SrxBa1-xNb2O6. Phys Rev B. 2019;100:184113.
- Shvartsman VV, Kleemann W. Nanopolar structure in SrxBa1-xNb2O6 single crystals tuned by Sr/Ba ratio and investigated by piezoelectric force microscopy. Phys Rev B. 2008;77:054105.
- Salazar N, Dulce P-M, Calzada ML, et al. Ergodicity of fine-grained canonical relaxor ferroelectric (Bi0.5Na0.5)1-xBaxTiO3 films. J Am Ceram Soc. 2019;102(10):5941–5951.
- Rohrbeck A, Flor G, Aroyo MI, et al. The effect of chemical variations on the structural polarity of relaxor ferroelectrics studied by resonance Raman spectroscopy. J Phys Condens Matter. 2016;28(47):475902.
- Shvartsman VV, Lupascu DC. Lead-free relaxor ferroelectrics. J Am Ceram Soc. 2012;95(1):1–26.
- Balachandran PV, Xue DZ, Lookman T. Structure-Curie temperature relationships in BaTiO3-based ferroelectric perovskites: anomalous behavior of (Ba,Cd)TiO3 from DFT, statistical inference, and experiments. Phys Rev B. 2016;93(14):144111.
- Mentzer C, Lisenkov S, Fthenakis ZG, et al. Phase evolution in the ferroelectric relaxor Ba(Ti1-x,Zrx)O3 from atomistic simulations. Phys Rev B. 2019;99(6):064111.
- Zhao CL, Wang H, Xiong J, et al. Composition-driven phase boundary and electrical properties in (Ba0.94Ca0.06)(Ti1-xMx)O3 (M=Sn,Hf,Zr) lead-free ceramics. Dalton Trans. 2016;45(15):6466–6480.
- Shvartsman VV, Zhai J, Kleemann W. The dielectric relaxation in solid solutions BaTi1-xZrxO3. Ferroelectrics. 2009;379:77.
- Bokov AA, Maglione M, Ye ZG. Quasi-ferroelectric state in Ba(Ti1-xZrx)O3 relaxor: dielectric spectroscopy evidence. J Phys Condens Matter. 2007;19(9):092001.
- Oliver JR, Neurgaonkar RR, Cross LE. Ferroelectric properties of tungsten bronze morphotropic phase bounary systems. J Am Ceram Soc. 1989;72(2):202–211.
- Olsen GH, Aschauer U, Nicola A, et al. Origin of ferroelectric polarization in tetragonal tungsten-bronze-type oxides. Phys Rev B. 2016;93:180101.
- Albino M, Heijboer P, Porcher F, et al. Metastable ferroelectric phase and crossover in the Ba2NdFeNb4xTaxO15 TTB solid solution. J Mater Chem C. 2018;6:1521–1534.
- Wang Y, Sun TL, Zhu XL, et al. Ferroelectric transition and structural modulation in Sr2Na(Nb1-xTax)5O15 tungsten bronze ceramics. J Appl Phys. 2021;129(24):244107.
- Feng WB, Zhu XL, Liu XQ, et al. Effect of B site ions on the relaxor to normal ferroelectric transition crossover in Ba4Sm2Zr4(NbxTa1-x)6O30 tungsten bronze ceramics. Appl Phys Lett. 2018;112:262904.
- Feng WB, Zhu XL, Liu XQ, et al. Ferroelectric transitions and relaxor behavior in Ba4Sm2(Ti1-xZrx)4Ta6O30 tungsten bronze ceramics. J Appl Phys. 2018;124:104102.
- Feng WB, Zhu XL, Liu XQ, et al. Crystal structure, ferroelectricity and polar order in Ba4R2Zr4Nb6O30 (R=La,Nd,Sm) tetragonal tungsten bronze new system. J Mater Chem C. 2017;5:4009–4016.
- Glazounov AE, Tagantsev AK. Direct evidence for Vögel-Fulcher freezing in relaxor ferroelectrics. Appl Phys Lett. 1998;73:856–858.
- Nanba T, Sakida S, Miura Y. Advances in glass and optical materials II. New Jersey: John Wiley & Sons, Inc.; 2006. p. 165–177.
- Saghayezhian M, Rezaei Sani SM, Zhang J, et al. Rumpling and enhanced covalency at the SrTiO3(001) surface. J Phys Chem C. 2019;123(13):8086–8091.
- Feng WB, Zhu XL, Chen XM. Crystal structure dielectric and ferroelectric characteristics of zirconate tantalate ceramics with tungsten bronze structure. J Mater Sci: Mater Electron. 2021;32:7481–7490.
- Wilde RE. Raman spectrum of Sr0.61Ba0.39Nb2O6. J Raman Spectrosc. 1991;22:321–325.
- Yao YB, Mak CL, Ploss B. Phase transitions and electrical characterizations of (K0.5Na0.5)2x(Sr0.6Ba0.4)5−xNb10O30 (KNSBN) ceramics with ‘unfilled’ and ‘filled’ tetragonal tungsten bronze (TTB) crystal structure. J Eur Ceram Soc. 2012;32:4353–4361.
- Xia HR, Chen HC, Yu H, et al. Effect of Cu ions on the polarization and polar lattice vibrations of potassium sodium strontium barium niobate single crystals. Phys Rev B. 1997;55:14892.
- Massarotti V, Capsoni D, Bini M, et al. Tungsten bronzes framework as a glasslike host for transition cations: the case of Ba6Zr2Ta8O30. J Phys Chem C. 2017;111(18):6857–6861.
- Lima-Silva JJ, Garcia D, Mendes FJ, et al. The ferro-paraelectric phase transition of Pb0.6Ba0.4Nb2O6 investigated by Raman scattering. Phys Stat Sol(b). 2004;241(8):2001–2006.
- Zhu X, Fu M, Stennett MC, et al. A crystal-chemical framework for relaxor versus normal ferroelectric behavior in tetragonal tungsten bronzes. Chem Mater. 2015;27:3250–3261.
- Rotaru A, Morrison FD. Vogel–Fulcher analysis of relaxor dielectrics with the tetragonal tungsten bronze structure: ba6MNb9O30 (M=Ga, Sc, In). J Therm Anal Calorim. 2015;120:1249–1259.