
 ?Mathematical formulae have been encoded as MathML and are displayed in this HTML version using MathJax in order to improve their display. Uncheck the box to turn MathJax off. This feature requires Javascript. Click on a formula to zoom.
ABSTRACT
The piezoelectric properties of a piezoelectric single crystal are typically determined using a resonance method. However, it is challenging to evaluate these properties in single crystals owing to their high sensitivity and property variations. In this study, to accurately determine the piezoelectric properties, initial values were obtained using two types of samples (TE and TS modes). Impedance spectrum tendency analysis was performed according to the variables to develop a property estimation method. To determine the reliability of this method, the piezoelectric single crystal properties were evaluated and compared using the resonance method. Hence, it was confirmed that high-accuracy piezoelectric properties were obtained in a cost effective and timeous manner.
1. Introduction
Because piezoelectric single crystals have better properties, such as piezoelectric charge constant (d33) and electromechanical coupling coefficient (k33), than polycrystalline piezoelectric ceramics, they have been gradually incorporated into piezoelectric devices that require high performance, light weight, and small size [Citation1–14]. When producing these devices, structural design and performance prediction technologies using simulations for precise driving frequency and displacement control have been implemented as they have proven to be reliable [Citation15,Citation16]. Although several pre-processing technologies such as modeling, meshing, and boundary conditions are required for simulations, the accurate material properties have the most fundamental effects on the analysis results and final design.
Methods for measuring the material properties of piezoelectric ceramics include use of a d33 piezometer system, laser doppler velocimetry (LDV), and ultrasonic and resonance methods. The ultrasonic method measures the modulus of elasticity (cij) using the pulse echo technique, whereas the d33 piezometer system measures the amount of charge generated by an applied mechanical vibration, determining only the piezoelectric charge constant (dij). LDV uses a laser to measure surface displacement. However, it is possible to measure the piezoelectric charge constant, electromechanical coupling factor, and mechanical quality factor with a single method [Citation17]. Although such a method can accurately determine properties, it is limited in its ability to evaluate the overall piezoelectric properties for simulation applications. The piezoelectric properties required for development are material properties such as density, elasticity, piezoelectric charge constant, and permittivity. Typically, for piezoelectric ceramics, material properties are measured using the resonance method that analyzes the impedance characteristics of a sample with a specific vibration mode. However, the measurement of piezoelectric single crystals is sensitive to the environment when using the resonance method, owing to its high piezoelectric properties and crystal orientation [Citation18]. In addition, to obtain the overall piezoelectric constant, various vibration modes and several samples are required, and it is often difficult to measure piezoelectric properties consistently owing to the differences in phases generated during crystal growth, processing, and polarization. Therefore, to reduce errors caused by the deviation between samples, several attempts have been made to minimize the types of samples required for piezoelectric property measurements or to obtain piezoelectric properties by combining analytical methods [Citation19–24].
In this study, we developed a method for measuring the material properties of piezoelectric single crystals with a small sample, and verified the accuracy of the results. For the piezoelectric single crystal used in the study, a sample was grown using the solid-state single crystal growth (SSCG) method, and the piezoelectric properties were measured using a parameter estimation method based on the finite element method (FEM). Thickness extension (TE) mode samples were used for the vibration mode samples and the piezoelectric properties for parameter estimations were selected using the d33 piezometer system and resonance method. Based on the selected piezoelectric properties, the piezoelectric equations that can be derived from the TE mode sample were modified to evaluate the properties, which can be obtained in different vibration modes. The evaluated piezoelectric properties were set as initial values.
Through FEM analysis, the frequency electrical impedance resonance (fr) and anti-resonance (fa) characteristics and sensitivities according to the changes in the piezoelectric properties (sij, dij, εij) from the initial values were analyzed, and the results were obtained in the optimization analysis. The piezoelectric properties were derived using numerical analysis and parameter estimation techniques reflecting the sensitivity analysis results. In addition, samples of various vibration modes were manufactured, and their properties were measured using the resonance method and verified with the properties evaluated by the optimization analysis.
2. Piezoelectric property evaluation of piezoelectric single crystals
There are two typical methods for manufacturing piezoelectric single crystals, the Bridgman and SSCG methods. The Bridgman method is useful for the synthesis of piezoelectric single crystals as it grows single crystals directly from the melt, which is a simple and cost effective method. However, this method has a disadvantage in that it is difficult to apply to high melting point or volatile components. The SSCG method has been considered as an alternative approach to solve the Bridgman method problem, as it does not require complete melting of the major components. Thus, the SSCG method is useful for the single crystal growth of materials with high melting temperatures, volatile components, and incongruent melting [Citation25]. There are several types of piezoelectric single crystals which are categorized by their properties and components. The PMN-PT and PZN-PT single crystals with a low phase transition temperature and coercive electric field are classified as first generation piezoelectric single crystals, whereas those with an improved phase transition temperature and coercive electric field are classified as second-generation piezoelectric single crystals, such as PIN-PMN-PT and PMN-PZT. In addition, a single crystal is classified as third-generation if its piezoelectric properties are optimized according to a specific purpose by adding a donor or acceptor to the second-generation piezoelectric single crystal [Citation26].
The typical evaluation of the properties of a piezoelectric single crystal is achieved using a resonant method based on the IEEE standard [Citation27]. The resonant method calculates the piezoelectric characteristics by measuring the resonance and anti-resonance frequencies, impedance, and capacitance corresponding to the vibration mode in each sample with a shape that maximizes the vibration mode of the piezoelectric ceramic. The shape of the sample according to the vibration mode and the derived properties are shown in . ,
,
, and
are determined in TE mode;
,
, and
in longitudinal extension (LE) mode;
,
,
,
, and
in transverse shear (TS) mode; and
,
,
, and
are derived in the length thickness extension (LTE) mode. However, in the case of a piezoelectric single crystal, a sample is required in XZt 45° mode owing to the crystal orientation according to the poling direction of the piezoelectric single crystal. Because the crystal poled in the [001] direction has a 4 mm symmetrical shape,
is determined by deriving
from the sample cut at 45° to the XZ plane [Citation28–30].
Table 1. Sample shape and derived piezoelectric properties according to vibration mode.
However, this method requires several samples and a significant period to accurately determine properties. Moreover, for a piezoelectric single crystal, another challenge is the inaccuracies that occur owing to human error and high piezoelectric properties.
There have been several attempts to derive piezoelectric properties using simulations to eliminate the problems that occur during these experimental measurement methods. It is typical to use CAD tools to design electromechanical systems based on piezoelectric ceramics. The behavior of these systems can be reproduced with high accuracy using FEM or similar numerical tools [Citation31]. However, modeling accuracy is limited by the known material properties. Piezoelectric single crystals are anisotropic and require several elastic parameters to fully represent their behavior. Kaltenbacher et al. has optimized the electrical impedance in thickness mode using the developed Newton-CG algorithm by introducing elastic stiffness [Citation32]. Joo et al. investigated the sensitivity on the impedance by changing the elastic stiffness (, piezoelectric charge constant (eij), and permittivity (εs) in a piezoelectric transformer. Each parameter was changed and the influence of the factors on the impedance was analyzed. Hence, the experimental impedance and FEM simulation graphs were optimized by changing six parameters (c11, c12, c13, c33, e33, and εs) [Citation33]. Pérez et al. optimized the piezoelectric property based on the parametric estimation in TE mode using elastic stiffness [Citation34]. These studies either derived the properties using the resonance method, or the material properties required for simulation were supplied by the manufacturer. Recent studies have investigated methods applicable only to polycrystalline piezoelectric ceramics in deriving c66 and s66. This is difficult to apply to anisotropic piezoelectric single crystals because the c66 value is optimized by c11 and c12 which is based on isotropic piezoelectric ceramics. Therefore, it is necessary to devise a new property evaluation technique considering the crystal direction of the piezoelectric single crystal.
3. Optimization with FEM
shows the method for deriving overall piezoelectric properties with the least amount of samples. To set the initial value for the simulations, the piezoelectric equation was modified from the TE mode sample to measure the highest number of elastic moduli and piezoelectric constants. Based on the set initial values, additional piezoelectric properties were derived and optimized by numerical analysis and parameter estimation techniques.
Figure 1. Flow chart describing piezoelectric single crystal property optimization.
3.1. Initial value for the material parameters of piezoelectric single crystals
In piezoelectric single crystals, the parameter setting range is wide owing to the high piezoelectric coefficient. To evaluate the properties of high reliability, it is necessary to minimize the parameters and set a more accurate initial value. Therefore, the TE mode sample was typically selected to determine the initial value as the most convenient sample to manufacture. shows the measurement method according to the piezoelectric coefficient for the initial value setting. The piezoelectric charge constants (d33, d31) of the TE mode samples were measured using a d33-meter (PM-300, Piezotest). In particular, the d33 of the piezoelectric material is typically measured using a sample in LE mode; however, errors often occur owing to the small size and high voltage during the polarization of the sample. Furthermore, the measurement of the d33-meter is often used because the measurement of the LE mode sample is inaccurate owing to its high k33 value. The elastic stiffness and coupling factor were calculated by measuring the fr, fa, and capacitance () of the TE mode sample using an impedance analyzer (HP 4194A, Agilent) based on EquationEquations. (1
(1)
(1) –Equation3
(3)
(3) ). These properties were typically measured using the TE mode in the resonance method and were used as fixed properties.
Table 2. Measurement method according to piezoelectric coefficient for initial value setting.
where and t denote the density and thickness of the sample, respectively. The dielectric constants,
and
, were calculated by measuring the capacitance at 1 kHz and frequency over 2 fa [Citation28].
was calculated by EquationEq. (4)
(4)
(4) using the calculated dielectric constant. Hence, the piezoelectric properties measured in the LE mode were determined by calculating
and
using EquationEquations. (5)
(5)
(5) and (Equation6
(6)
(6) ).
Typically, is calculated using
,
, and
. However, in this study,
and
were derived by applying the above calculated constants to EquationEquations. (7)
(7)
(7) and (Equation8
(8)
(8) ).
was calculated by sequentially applying calculated constants to EquationEq. (9
(9)
(9) ), and
was calculated using EquationEq. (10)
(10)
(10) .
is calculated using the sample size, fr, and density in LTE mode; however, we predicted
using EquationEq. (11)
(11)
(11) in TE mode and calculated
and
using EquationEq. (11)
(11)
(11) .
can be obtained through 2(
) [Citation25] in the case of polycrystalline PZT ceramics; however,
from the XZt 45° sample is required to calculate
in a single crystal piezoelectric ceramic for a 6 mm point group as in EquationEq. (12)
(12)
(12) . However, to omit the XZt 45° sample,
is determined using the temporary
value and corrected in the optimization process by simulation. The temporary
value was used as 40 ± 10% of the
value. The determination of
is calculated by calculating
obtained in EquationEq. (12)
(12)
(12) by applying the Poisson’s ratio (0.4) of a typical piezoelectric single crystal.
The initial value is calculated to serve as an auxiliary for the further analysis and optimization of properties, and aims to present a standard rather than accurate data. Other properties such as ,
,
,
, and
are independently measured in TS mode and cannot be evaluated with TE mode or other vibration mode samples. Therefore, samples were prepared separately and reflected in the measurement of piezoelectric properties. Consequently, initial property values for the parameter estimation method were obtained.
3.2. FEM simulation for the piezoelectric property initial value
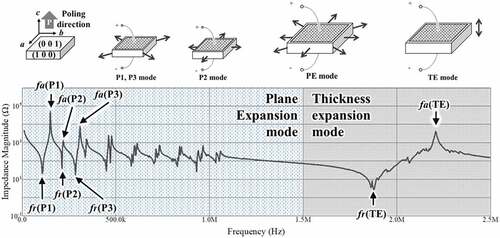
The prediction optimization of piezoelectric single crystal properties was performed using COMSOL Multiphysics® SW ver.6.0 software [Citation35], a multiphysics analysis program based on FEM. The target sample was intended to analyze the vibration modes of the TE mode sample, and the impedance spectrum of the piezoelectric single crystal was analyzed at a frequency range of 1 kHz to 2.5 MHz. Analysis was performed by dividing the vibration mode of the TE mode sample in TE and plane extension (PE) modes ().
Figure 2. Detailed vibration mode and frequency spectrum for parametric estimation.
By analyzing the relationship between the parameters and the impedance spectrum, the overall parametric estimation technique for optimizing piezoelectric properties was designed and established considering the order of analysis and the influence of the parameters.
The final piezoelectric single crystal properties optimization was performed using the initial values as parameters, and impedance spectra were obtained through FEM simulation analysis. The results were compared with the impedance spectrum measured experimentally on the TE sample, and the piezoelectric properties with the lowest errors were selected. Several analyses using elastic stiffness have been applied; however, in this study, elastic compliance (), piezoelectric charge constant (
), and permittivity (
) were applied. Analysis using elastic compliance can intuitively apply properties (
) and piezoelectric constants (
) by measurements. In addition, the selection of
and
is obtained using the equations, and the relationship between
,
,
, and
can be calculated sequentially using
calculated in thickness mode. To calculate
and
that can be measured in LTE mode, the plane mode of the TE sample was analyzed and calculated. In the plane mode, if the sample is circular, it will appear as a simple radial mode; however, the sample used for the measurements has a hexahedral shape of 10 × 10 × 1(t) mm3, exhibiting various vibration modes. The first to third vibration modes were defined as P1–P3, and fr and fa of the vibration board were analyzed. P1 and P3 are in the diagonal of the longest part, appear at the lowest frequency, and are primary and secondary vibration modes, respectively. P2 represents a mode of oscillation perpendicular to the polarization. Based on the impedance spectrum obtained, fr (P1–P3) and fa (P1–P3) of the plane mode and fr (TE) and fa (TE) of the thickness mode were compared with the simulated impedance spectrum. The piezoelectric properties, which show the results consistent with the experimental values and simulations, were determined as final properties.
Some properties such as ,
, and
that were measured in TS mode were independent piezoelectric properties, so they were excluded from the parameters and treated as constants.
4. Results and discussion
4.1. Sensitivity analysis and parameter selection
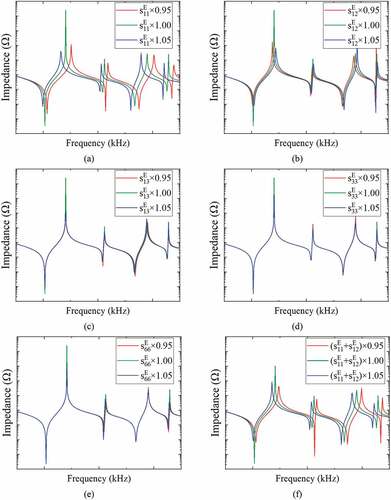
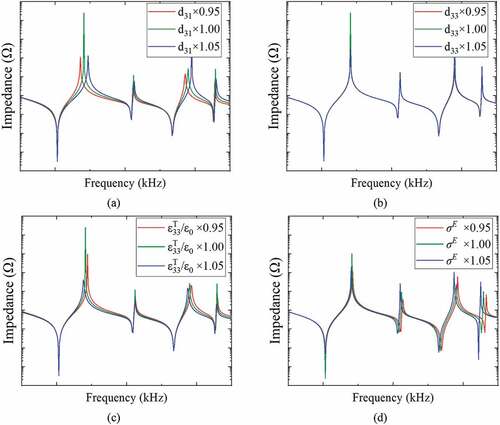
shows the displacements at fr and fa of the P1 and P2 modes, and it was confirmed that vibrations occurred in the predicted mode. shows the plane mode response frequency sensitivity when elastic compliance is used as a parameter based on the initial value. As shown in ), as increases, the fr and fa in the overall vibration mode decreases. This indicates that the
value has a more significant effect on the sub vibration mode than the main vibration mode. From ), it is evident that fr and fa decreases in all vibration modes as
increases, and ) show that there is no significant change in the response frequency according to
,
, and
. Furthermore, as shown in ),
exhibits a similar tendency to
as typically 2
>
. Therefore, to minimize the number of parameters during the calculation, a parametric sweep was performed until fr (P1) matched the measured value with
as a parameter.
Figure 3. FEM displacement shape analysis results according to the resonance of plane expansion mode.
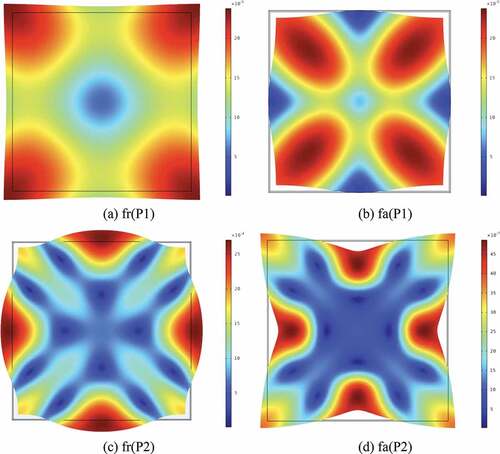
Figure 4. PE mode impedance characteristic simulation results according to the change in piezoelectric single crystal properties; (a) , (b)
, (c)
, (d)
, (e)
, and (f)
.
) shows that as Poisson’s ratio increases, fr (P1) remains constant; however, fr (P3) – fr (P1) decreases. The level of change was Δfr (P2) < Δfr (P3), and Δfa (P2) < Δfa (P3), and the higher the frequency mode, the more significant the change. In the case of fr (P3), the Poisson’s ratio was applied with and
using EquationEq. (13)
(13)
(13) as a parameter to allow the calculation to proceed.
For , the previously optimized
value was used as a constant, and
was used as a parameter to determine a value consistent with the P2 mode according to EquationEq. (12)
(12)
(12) . shows the simulation results according to the piezoelectric constants,
and
, and the change in permittivity. As
increased, it was confirmed that fa (P1) and fa (P3) decreased; however, d33 did not affect the frequency. This tendency seems to be because
affects the thickness of the matrix, whereas
affects the plane direction. As
increased, fa (P1) and fa (P3) tended to decrease, similar to
; however, their values are lower than the amount of change in
. Finally, as shown in , the piezoelectric properties of
,
,
, and
were optimized in plane mode by adjusting the parameters affecting P1, P2, and P3.
Figure 5. PE mode impedance characteristic simulation results according to the change in piezoelectric single crystal properties; (a) , (b)
, (c)
, and (d) Poisson’s ratio.
show the frequency change of the thickness mode according to the change of the elastic compliance. As shown in EquationEq. (14(14)
(14) ),
is significantly affected by fr and fa of the vibration mode in the thickness. This is because the kt value is determined only by the frequency. It was confirmed that
,
,
, and
affect the frequency response of the thickness mode. This is because, as shown in Eq. (15),
, which has an influence in the TE mode, is also affected by various
. Among the various
, it was confirmed that the parameter possessing the most influence in the thickness mode was
.
was the parameter that had the smallest change in fr (TE) simultaneously affecting fa (TE) – fr (TE).
Figure 6. PE mode impedance characteristic simulation results according to the change in piezoelectric single crystal elastic compliance; (a) , (b)
, (c)
, (d)
, and (e)
.
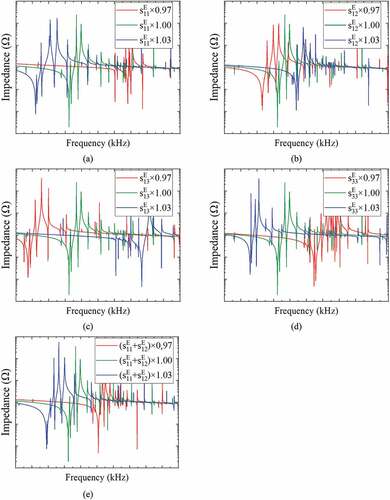
Figure 7. TE mode impedance characteristic simulation results according to the change in piezoelectric single crystal properties; (a) , (b)
, (c)
, and (d) Poisson’s ratio.
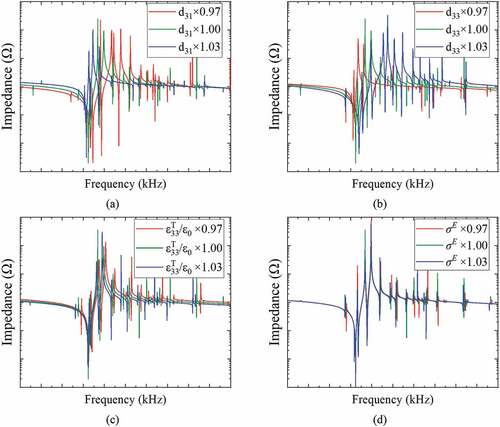
Therefore, was set as the parameter for optimizing the properties in TE mode.
is calculated using EquationEq. (14)
(14)
(14) and applied to the simulation automatically by taking
and
as constants which was derived from the plane vibration mode.
As shown in , the permittivity, Poisson’s ratio, and did not significantly affect frequency. However, as d33 increased, fa (TE) – fr (TE) increased.
In the process of parametric estimation, d33,,
, and permittivity, which were experimentally measured in TE mode, were set as constants. Because the values selected as constants can be obtained relatively easily from the experimental values, and the reliability is also high. In particular, in the case of d33, reliable measurement results are required because it has a very large effect on the thickness mode as a result of trend analysis, and this value was measured using a d33-meter. This is because when measuring d33 through the resonance method, a high d33 value reacts sensitively to the proficiency of the measurer or the shape of the jig, so there is a high possibility of error. In addition, the piezoelectric single crystal sample used in this study is a hard piezoelectric single crystal with high Qm(~500) and is less affected by frequency and domain movement, so it is assumed that the reliability of the value measured by the d33-meter is high.
summarizes the frequency change tendency according to the parameters used for parametric estimation.
Table 3. Sensitivity analysis results according to parameter increase of piezoelectric single crystal.
4.2. Analysis of optimized piezoelectric properties
summarizes the piezoelectric properties optimized through the parameter estimation method and the initial values calculated for optimization. The density, d33, dielectric constant, and TS-related properties have no deviation because the measured values were used as is; however, the optimized piezoelectric properties and initial values exhibited some differences. In the case of ,
, and
, it can be observed that the error is significant, as they were determined using a random Poisson’s ratio and
.
Table 4. Optimized piezoelectric properties of piezo single crystals manufactured using SSCG method.
shows the impedance spectrum comparisons of the initial values, optimized properties, and raw data which was measured with an impedance analyzer of a PMNT-1.0Mn piezoelectric single crystal. As shown in ), in the PE mode, the initial value shows the frequency characteristics similar to raw data and optimization properties. It is concluded that these results can be used as an initial reference using the initial value. However, as shown in ), the frequency characteristics of the initial values vary significantly from other data.
Figure 8. Comparison of impedance characteristics of piezoelectric single crystals using optimized material properties as a parameter estimation method; (a) Plane expansion mode, and (b) thickness expansion mode.
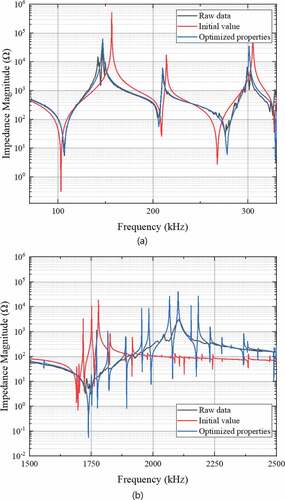
It can be observed in , in the thickness mode, that the frequency characteristics vary significantly, even with small changes in ,
,
, and
that affect
. It is considered that the error rate of
, which significantly affects fa (TE) – fr (TE), is significant (). However, in the case of fr (TE), it is suggested that the raw data and analysis results of the optimized properties are confirmed at a similar location and can be used as an initial value.
The parametric estimation method using the initial value setting developed in this study was implemented to derive properties using the determination of the piezoelectric properties. In addition, it was confirmed that it is a reliable evaluation method by deriving the optimal piezoelectric properties of the same frequency characteristics as that of the raw data.
4.2. Experimental validation of parametric estimation
The sample used in this study is a piezoelectric single crystal grown by Ceracomp co. (Korea) using the SSCG method. It is Mn-doped PMN-PZT single crystal, which has tetragonal crystal system cut from the (0 0 1) plane with multi-domains. In addition, as a hard single crystal, it has a value of Qm(≈500), which is about 10 times higher than the Qm (50 ~ 80) of the existing PMN-PT single crystal, and TC and TRT also have values about 140°C and 90°C, respectively. To compare the analysis results with the overall piezoelectric properties measured by the resonance method (), LE, LTE, and XZt 45° samples were manufactured. shows the error rates comparing the properties of the piezoelectric single crystals measured by the resonance method and the FEM optimized properties. The values of the piezoelectric property using the resonance method and that of the optimized property vary significantly. To analyze the difference, the raw data of the impedance spectra and FEM analysis was measured using the resonance method and compared (). In ), the analyzed fr (P1) appears at a higher frequency than the raw data in PE mode, indicating that the value was low. The difference in error rates between
and
indicates that the Poisson’s ratio is unsuitable, causing the difference in the interval and frequency between P1 and P3. In ), the FEM analysis applying the resonance method results, fr (TE), and fa (TE) are unclear, and there is a significant deviation from the raw data. This indicates that the results of
,
,
, and
are incorrect, and the large error rate can be explained. In addition, it can be considered that this is owing to the large error rate of the LE mode sample used when deriving 3–3 characteristics (
using the resonance method. For the LE mode sample, it is sensitive to the skill of the operator and the shape of the jig as it has a shape that maximizes the vibration in the longitudinal direction. For this reason, the LE mode samples tend to be less reliable.
Figure 9. Piezoelectric single crystal specimens prepared to derive piezoelectric properties using resonance method.
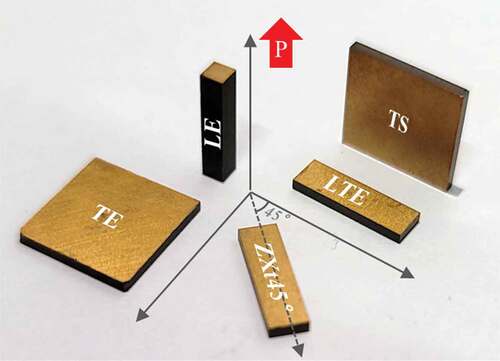
Figure 10. Comparison of the impedance spectrum plotted with the properties obtained using the resonance method and the raw data obtained by the impedance analyzer.
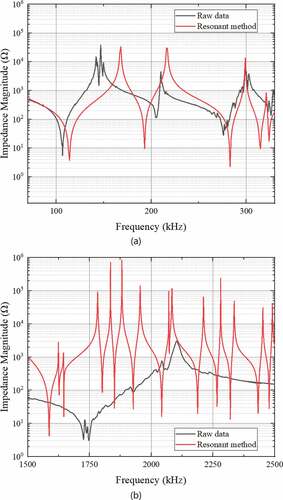
Table 5. Piezoelectric properties of piezoelectric single crystals measured using the resonance method and the error between optimized properties.
Using cross-validation, it was confirmed that inaccurate piezoelectric properties could be measured using the resonance method. It is expected that more reliable results can be obtained if piezoelectric properties are derived using the parameter estimation method developed in this study.
5. Conclusions
In this study, a technique was developed to derive reliable properties of piezoelectric single crystals with a minimum number of samples. The initial value was determined and applied to minimize the wide range of parameters and obtain more stable properties. The initial value was predicted using the properties which was measured using the resonance method and the d33 meter system in the TE mode sample. To develop an optimization technique, the change in the frequency response characteristic according to the change in elastic compliance (), piezoelectric charge constant (
), and permittivity (
) was analyzed. The analysis results were used as the basis for determining the FEM analysis sequence, the vibration mode for selecting parameters, and the extent of the measured values.
Based on the frequency sensitivity analysis results and the determined initial value, an attempt was made to derive the exact piezoelectric single crystal properties using FEM analysis and optimization techniques. The optimization of the piezoelectric single crystal properties was performed using a parameter estimation technique that compares the measured impedance spectrum raw data (Zexp) of the test sample and the analyzed impedance spectrum (ZFEM) according to the change of the piezoelectric constants (sij, dij). For the predicted and analyzed vibration modes, the thickness expansion and plane expansion modes were used. ,
,
, and
were determined in plane expansion mode, and
and
were determined in the thickness expansion mode to present the final piezoelectric single crystal properties.
In this study, a method was suggested to solve the inaccuracy of evaluation results according to the sensitive piezoelectric characteristics and the measurement environment (equipment, operator, sample deviation) when measuring the piezoelectric properties of a piezoelectric single crystal. By implementing such a technique, it is possible to reduce costs and time by omitting the production of several expensive piezoelectric single crystal samples for the evaluation of piezoelectric properties, and reliable piezoelectric properties are obtained.
Acknowledgments
The authors acknowledge the financial support from the Virtual Engineering Platform Project of the Ministry of Trade, Industry and Energy (MOTIE) of Korea (grant number: N0002599), and the KICET policy project.
Disclosure statement
No potential conflict of interest was reported by the author(s).
Additional information
Funding
References
- Lee JH, Kim TS, Park HH. Hybrid fabrication of screen-printed Pb(Zr,Ti)O3 thick films using a sol-infiltration and photosensitive direct-patterning technique. J. Microelectron. Packag. Soc 2015;22(4):83.
- Topolov V. Comment on ‘Complete sets of elastic, dielectric, and piezoelectric properties of flux-grown [011]-poled Pb(Mg1/3Nb2/3)O3−(28–32)% PbTiO3 single crystals’, [Appl. Phys. Lett. 92, 142906 (2008)]. Appl Phys Lett. 2010;96(19):196101.
- Sun EW, Cao WW, Han PD. Complete set of material properties of [011]c poled 0.24Pb(In1/2Nb1/2)O3-0.46Pb(Mg1/3Nb2/3)O3-0.30PbTiO3 single crystal. Mater Lett. 2011;65(19–20):2855.
- Yin JH, Jiang B, Cao W. Elastic, piezoelectric, and dielectric properties of 0.955Pb(Zn1/3Nb2/3)O3/-0.45PbTiO3 single crystal with designed multidomains. IEEE Trans Ultrason Ferroelectr Freq Control. 2000;47(1):285.
- Zhang R, Jiang B, Jiang WH, et al. Complete set of properties of 0.92Pb(Zn1/3Nb2/3)O3–0.08PbTiO3 single crystal with engineered domains. Mater Lett. 2003;57(7):1305.
- Liu XZ, Zhang SJ, Luo J, et al. Complete set of material constants of Pb(In1/2Nb1/2)O3–Pb(Mg1/3Nb2/3)O3–PbTiO3 single crystal with morphotropic phase boundary composition. J Appl Phys. 2009;106(7):074112.
- Wang F, Luo L, Zhou D, et al. Complete set of elastic, dielectric, and piezoelectric constants of orthorhombic 0.71Pb(Mg1∕3Nb2∕3)O3–0.29PbTiO3 single crystal. Appl Phys Lett. 2007;90(21):212903.
- Zhang YY, Liu DA, Zhang QH, et al. Complete set of material constants of 〈011〉-poled rhombohedral single-crystal 0.25Pb(In1/2Nb1/2)O3-0.47Pb(Mg1/3Nb2/3)O3-0.28PbTiO3. J Electron Mater. 2011;40(92):92–96.
- Li S, Jiang WH, Zheng LM, et al. A face-shear mode single crystal ultrasonic motor. Appl Phys Lett. 2013;102(18):183512.
- Kim K, Zhang SJ, Jiang XN. Surface load induced electrical impedance shift in relaxor-PbTiO 3 crystal piezoelectric resonators. Appl Phys Lett. 2012;100(25):253501.
- Dong SX, Yan L, Wang N, et al. A small, linear, piezoelectric ultrasonic cryomotor. Appl Phys Lett. 2005;86(5):53501.
- Dong SX, Yan L, Viehland D, et al. A piezoelectric single crystal traveling wave step motor for low temperature application. Appl Phys Lett. 2008;92(15):153504.
- Chen Z, Song L, Zhao H, et al. Temperature- and electric field-dependence of polarization hysteresis for a [001]c poled PMN-PT single crystal. J.Asian.Ceram.Soc. 2022;10(1):203–214.
- Le PG, Pham TL, Nguyen DT, et al. Solid state crystal growth of single crystals of 0.75(Na1/2Bi1/2)TiO3-0.25SrTiO3 and their characteristic electrical properties. J.Asian.Ceram.Soc. 2020;1–12. DOI:10.1080/21870764.2020.1847426
- Wu DH, Chien WT, Yang CJ, et al. Coupled-field analysis of piezoelectric beam actuator using FEM. Sens Actuators A. 2005;118(1):171–176.
- Di Gaeta A, Glielmo L, Giglio V, et al. Modeling of an electromechanical engine valve actuator based on a hybrid analytical–FEM approach. IEEE ASME Trans Mechatron. 2008;13(6):625–637.
- Liao X, Qiu Z, Jiang T. Functional piezocrystal characterisation under varying conditions. Materials. 2015;8(12):8304–8326.
- Kim YS, Park JH, Lee J, et al. Effect of measuring method on the evaluation of piezoelectric and dielectric properties of PMN-PT single crystal. J. Microelectron. Packag. Soc. 2019;26(4):69–74.
- Li S, Zheng L, Jiang W, et al. Characterization of full set material constants of piezoelectric materials based on ultrasonic method and inverse impedance spectroscopy using only one sample. J Appl Phys. 2013;114(10). DOI:10.1063/1.4821107
- Perez N, Andrade M, Buiochi F, et al. Identification of elastic, dielectric, and piezoelectric constants in piezoceramic disks. IEEE Trans Ultrason Ferroelectr Freq Control. 2010;57(12):2772.
- Wang HF, Cao W. Determination of full set material constants from phase velocities. J Appl Phys. 2002;92(8):4578.
- Joo H, Lee C, Rho J, et al. Identification of material constants for piezoelectric transformers by three-dimensional, finite-element method and a design-sensitivity method. IEEE Trans Ultrason Ferroelectr Freq Control. 2003;50(8):965.
- Rupitsch S, Lerch R. Inverse method to estimate material parameters for piezoceramic disc actuators. Appl Phys A. 2009;97(4):735.
- Zhu S, Jiang B, Cao W. Characterization of piezoelectric materials using ultrasonic and resonant techniques. Proc SPIE. 1998;3341(154). DOI:10.1117/12.307996
- Lee HY. Development of high-performance piezoelectric single crystals by using solid-state single crystal growth (SSCG) method. Handbook of Advanced Dielectric, Piezoelectric and Ferroelectric Materials. 2008;158–172. DOI:10.1533/9781845694005.1.158
- Zhang S, Li F, Jiang X, et al. Advantages and challenges of relaxor-PbTiO3 ferroelectric crystals for electroacoustic transducers – a review. Pro Mater Sci. 2015;68:1–66.
- IEEE standard on piezoelectricity. ANSI/IEEE Standard. 1987; 176. doi: 10.1109/IEEESTD.1988.79638.
- Joh C, Kim J, Roh Y. Determination of the complex material constants of PMN–28%PT piezoelectric single crystals. Smart Mater Struct. 2013;22(12):125027.
- Zhang S, Li F. High performance ferroelectric relaxor-PbTiO3 single crystals: status and perspective. J Appl Phys. 2012;111(3):031301.
- Liao X, Qiu Z, Jiang T, et al. Functional piezocrystal characterisation under varying conditions. Materials. 2015;8(12):8304–8326.
- Pérez N, Buiochi F, Brizzotti Andrade M, et al. Numerical characterization of piezoceramics using resonance curves. Materials. 2016;9(2):71.
- Kaltenbacher B, Kaltenbacher M, Lerch R, et al. “Identification of material tensors for piezoceramic materials” 2000 IEEE Ultrasonics Symposium. Proceedings. An International Symposium (Cat. No. 00CH37121), October 22-25, 2000. San Juan, Puerto Rico (n.d.). DOI: 10.1109/ultsym.2000.921501
- Joo HW, Lee CH, Rho JS, et al. Identification of material constants for piezoelectric transformers by three-dimensional, finite-element method and a design-sensitivity method. IEEE Trans Ultrason Ferroelectr Freq Control. 2003;50(8):965–971.
- Pérez N, Buiochi F, Brizzotti Andrade M, et al. Numerical characterization of piezoceramics using resonance curves. Materials. 2016;9(2):71.
- COMSOL Multiphysics® v. 6.0. Stockholm, Sweden: COMSOL AB; 2021. www.comsol.com