
 ?Mathematical formulae have been encoded as MathML and are displayed in this HTML version using MathJax in order to improve their display. Uncheck the box to turn MathJax off. This feature requires Javascript. Click on a formula to zoom.
ABSTRACT
High-temperature stability and reliability are in high demand for ultra-thin multilayer ceramic capacitors (MLCCs), which are ubiquitous in electronic industries. Here, two doping matrices of BaTiO3 (BT) and Ba0.97Ca0.03TiO3 (BCT) are chosen to prepare ultra-thin MLCCs, whose effects on the microstructure, nonlinear dielectric properties, temperature stability, and reliability of the capacitors were investigated. Compared with BT-based MLCCs, BCT-based MLCCs possess better core-shell structures, thus, leading to a higher Schottky barrier for inhibiting carrier migration and improving aging performance. For the 1.5 μm-thickness capacitors using the BCT doping matrix rather than BT, the temperature coefficient of capacitance reaches the X7R standard, and the breakdown field increases from 148 to 172 V/μm. Moreover, the ability to resist insulation resistance degradation has been significantly improved. This work demonstrates the great potential of using BCT as the doping matrix to prepare ultra-thin MLCCs with excellent temperature stability and reliability.
1. Introduction
Barium titanate (BaTiO3, BT) is a ferroelectric compound material with high dielectric constant and low dielectric loss and its Curie temperature point is slightly higher than that of practical applications, which rendered it extensively used in multilayer ceramic capacitors (MLCCs). In order to broaden the operational temperature range of BT-based MLCCs, the strategies including doping elements such as Mg-Y [Citation1,Citation2] and Nb-Co [Citation3] to reduce the volume of ferroelectric phase near the phase transition point and increase the volume of non-ferroelectric phase, and form a stable temperature-dielectric curve, increasing the sintering temperature [Citation4,Citation5], or enlarging the grain size to increase the Curie temperature point [Citation6], were generally adopted. However, with the rapid development of 5 G communications, consumer electronics, and new energy vehicles, the consumption of ultra-miniature high-capacity MLCCs has increased dramatically and many domestic manufacturers gradually focus on the reliability requirements of MLCCs, especially ultra-thin MLCCs. Compared with the previous methods, a new approach to change the matrix material has recently emerged and gradually attracted researchers’ attention. Particularly of broad interest is the BCT matrix system, which can be achieved by doping Ca at the A site in the ABO3-perovskite type BT [Citation7–9]. It is easier to control the occupation site of Ca-doped BT by this method, and the matrix system has the characteristics of dispersed-phase transition, in contrast to the pristine matrix [Citation10,Citation11]. Moreover, the range of Tc movement can be manipulated, and the breakdown strength can also be adjusted appropriately by controlling the amount of Ca dopant [Citation12,Citation13].
Recently, the research on BCT has mainly focused on tuning the content of the Ca dopant and the occupation site of the Ca element. Most of the studies have expounded on the effect of Ca doping on dielectric temperature stability, and few types of research addressed the issues of breakdown strength and high-temperature resistance degradation. For example, Yoshihiro et al. [Citation14,Citation15] studied (Ba0.94Ca0.06)TiO3 matrix core-shell structure model in 2008 and found that BCT formed a high tetragonal core and a low tetragonal shell thus stabilizing the overall tetragonality. In 2013, the origin of the temperature point change at which the ferroelectric phase transforms into the cubic phase in BCT (Ca = 0 − 20 at.%) was explored by Synchrotron Radiation Powder Diffraction and revealed that the solid solution limit of Ca is 6 at.%, and the main reason for the change in TC is that Ca affects the electron density between Ti and O atoms. However, Fu et al. [Citation16] found the tetragonality of BCT is more stable than BT; the reason is that the calcium ion deviates from the central position to form an electric dipole moment, which cooperates with the electric dipole moment formed by the displacement of Ti ions. Meanwhile, Mitsui et al. [Citation17] found that when the Ca content in BCT was 8.0 at.%, the Tc (~136.1 ℃) reached the highest, and the Ca atom had greater atomic polarizability. However, the Ca ion has a smaller radius than the Ba ion, and the hydrostatic pressure formed will reduce Tc with the increase of doping amount. The behavior of Curie’s point was to be a compromise between these two effects. Banno et al. [Citation18] found that (1-x) BaTiO3-xCaTiO3 (Ca = 0 − 100 at.%), the insoluble component of Ca content in the range of 0.3 − 0.85 at.% is much higher than that of the other Ca content and the space charge is easier to form at this time, thus improving the breakdown strength of the product.
The aforementioned research studies suggest that there are many explanations for the solubility limit of Ca and the underlying mechanism of the effect of Ca doping on Tc. In this study, Ca = 3.0 at.% is selected, mainly because the doping limit of Ca is about 6.0 − 8.0 at.%. If it is too high, it is prone to produce oxygen vacancies because of Ca occupying Ti sites. And if it is too low, it is not enough to improve Tc to meet the expected standards of X7R. In this study, we mainly explore the relationship between dielectric temperature stability and raw materials by fixing the doping system and process system, unveil the mechanism of the starting powder affecting the TCC, and rationalize the influence of the Ca element on the reliability, completing the selection of raw materials for ultra-thin layer MLCCs. It is expected that the present work could provide new concepts for the design of excellent reliability and temperature stability for ultra-thin BME-MLCC applications.
2. Experimental procedure
2.1. Sample fabrication
Commercial BT (Shandong Sinocera Functional Material Co., Ltd., Dongying, China, 99.9%, D50 = 250 nm) and Ba0.97Ca0.03TiO3 powders (99.9%, Sakai Chemical Industry Co., Ltd., Japan, D50 = 250 nm) were used as raw materials. In all, 2.2 at.% SiO2, 0.15 at.% V2O5, 0.8 at.% MgO, 0.6 at.% Dy2O3 and 0.4 at.% ZrO2 were adopted as additives: they are referred to as BT-based and BCT-based samples, respectively. The mixtures were ball-milled in ethanol with ZrO2 ball (φ = 2 mm) for 24 h and tape-cast into green sheets. And then green sheets were prepared by screen-printing with Ni-electrode, stacking, pressing, and cutting. These chips were heated at 550 ℃ for 2 h to remove the organics, cofiring at 1150 ℃ for 1 h in a pO2 of ~10−10 atm followed by annealing at ~800 ℃ in a pO2 of ~10−8 atm. Finally, an ultra-thin MLCCs chip (2.00 mm × 1.25 mm× 1.25 mm) with a dielectric layer thickness of 1.5 μm and layer numbers of 350 were produced.
2.2. Characterization
The grain size distribution of the dielectric layer was investigated by measuring 300 grains via field-emitting scanning electron microscope (FEI, NOVA NANOSEM450, USA). Over 10 layers of electrodes were measured, and the average intercept length of holes is divided by the total electrode length to calculate the continuity of the electrode. Raman spectroscopy was performed with 785 nm excitation light (LabRAM HR Evolution, HORIBA Scientific, Paris, France) in the temperature range of −55 − 125 ℃. The tetragonality of specimens was computed using the FullProf suite program through Rietveld refinements based on XRD data by the micro-X-ray diffraction (Bruker AXS, Karlsruhe, Germany) with Cu Kα1 (1.5406 Å) radiation. Microstructures of core-shell and selected area diffraction patterns (SADPs) of domains in BT grains were characterized by transmission electron microscope (Thermo Fisher Scientific, Thermofisher Spectra 300, US) and energy-dispersive analysis system. Dielectric constants were recorded by an LCR meter (4980A, Keysight, Palo Alto, CA) in an AC field range of 0 − 2.2 V/μm at −55 ℃, 25 ℃, 85 ℃, 125 ℃ with a common application frequency of 1 kHz. The polarization-electric field (P-E) loops were obtained by a ferroelectric analyzer (Radiant Precision Multi-Ferric II) at −55 ℃, 25 ℃, 85 ℃, and 125 ℃ with a maximum field of 30 V/μm. The first-order reversal curves (FORC) distributions were tested as descending curves of minor P-E loops by applying a sinusoidal field that decreased to a negative saturation field of −30 V/mm and then cycled between −30 V/μm and (−30 + 0.5 n) V/μm and n increased from 1 to 80 so that the 80th loop was a P-E loop cycled between −30 V/μm and +30 V/μm. The frequency for each minor loop was 103 Hz. FORC distributions were calculated using the home-made program based on MatlabR2020b. The high-temperature insulation resistance (IR) was obtained by a high-resistance meter (Keysight Technologies, 2985A, USA) with a plane heater. Oxygen vacancy concentration and activation energy enable semi-quantitative analysis by thermally stimulated depolarization current (TSDC). The specimen was heated to a polarization temperature (Tp). Meanwhile, the polarization electric field (Ep) was applied to the specimen for 20 min, then rapidly cooled to an initial temperature T0 of 0 ℃ and the dc polarization field was still maintained in the process of decreasing temperature. By removing the polarization field, the electrodes were short-circuited for 5 min to depolarize the polarization mechanisms with a short relaxation time. Thereafter, the specimen was heated with a heating rate of 4 ℃/min to record the depolarization currents. A gradually increasing direct current (DC) voltage was applied to the specimens until the leakage current reached 2 mA, which was considered as a breakdown. The breakdown voltages of at least eight specimens were recorded, and the breakdown strengths of the BT-based and BCT-based samples were calculated by linear fitting using the Weibull distribution. The current and voltage (I–V) curves of the two devices were tested by a semiconductor tester (708B, Keithley, USA), setting a linear increase of the dc voltage from 0 to 50 V/μm in 1 V/μm step.
3. Results and discussions
3.1. Crystal Structure and Phase Transitions
In order to explore the local crystal structure of the dielectric layer, XRD spectra are collected on the two different raw materials and the MLCCs chips with different raw materials. It can be seen in that the diffraction peaks are completely matched with the BT phase of the tetragonal phase with JCPDS 79–2264. The splitting peak at 45 o in is the diffraction peak of the (002) crystal plane and the (200) crystal plane of the BT phase. The greater the value of the difference between the lattice parameters c and a, the greater the corresponding tetragonality c/a. The c/a ratio, determined by the FullProf refinement program from XRD patterns, is 1.0101 and 1.0103 for pure BT and BCT raw material, respectively. The peaks are also shifted to a higher angle, indicating that the Ba site in Ca-doped BT leads to lattice shrinkage, which is consistent with the information we obtained for the original BCT raw powder [Citation19].
Figure 1. XRD patterns of 20–80 ° and 42–46 ° for (a1)(a2) BT raw sample and BCT raw sample and (b1)(b2) BT-based sample and BCT-based sample.
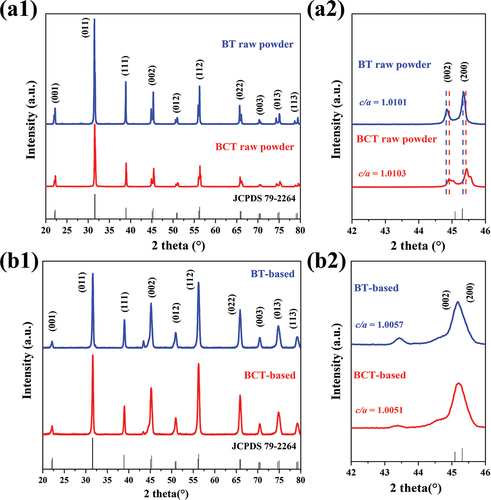
As shown in , the diffraction peak at ~45° narrowed and finally overlapped with each other, representing the coexistence of tetragonal and pseudo-cubic phases in BT dielectrics for all the specimens. The c/a ratio, determined by the FullProf refinement program from XRD patterns, is 1.0057 and 1.0051 for the BT-based and BCT-based dielectric layers, respectively. In the process of preparing MLCCs devices from the original powder by doping and sintering, the tetragonality of the original powder decreases sharply and the reduction of the tetragonality of the original BCT powder is more obvious. This maybe because of the fact that Ca-doping Ba sites lead to lattice shrinkage, which further shortens the space for Ti-O bond vibration, reduces the volume of [TiO6]-octahedron, and overall weakens the long-range interaction between Ti and O atoms [Citation15].
To further derive more details on the phase mixture in BT and BCT, Raman spectra were calendared for the two samples in the temperature range of −55 ℃−150 ℃. ) shows the temperature-dependent Raman spectra of BT raw powder. The observed phonon vibrations are basically consistent with those reported in the literature [Citation20–22]. The splitting of phonon modes A1(TO1) at 160 cm−1 and E(LO1+ TO2) at 182 cm−1 in −55 oC represents the R phase of BT and in ). As the temperature increases to 0 ℃, the peaks gradually broaden and even disappear and the other phonon modes A1(LO1) at 190 cm−1 in 0 oC, which corresponds to the O structure, can be found. As the temperature further increases to 25 ℃, the phonon mode A1(LO1) starts merging with the A1(TO2) at 260 cm−1 and beyond 25 ℃; the peak continues to broaden until it disappears, and it shows that the O to T phase transition occurs at about 5 ℃ [Citation23]. With a further increase in temperature from 25 ℃ onwards, the tetragonality of BT along with an increase in broadening of E(LO+TO)/B1 ~ 305 cm−1 and E(TO)/A1(TO) ~ 515 cm−1. Furthermore, at 125 oC, the only presence of phonon modes A1(TO2) at 252 cm−1 and E(TO)/A1(TO) at 517 cm−1 indicates the transition from T to C phase [Citation24].
Figure 2. Raman Spectrum of (a) BT-based sample and (b) BCT-based sample from −55 ℃ to 150 ℃. Raman Spectrum Zoom of BT-based sample and BCT-based sample (c) at the temperature of −55 ℃, 0 ℃, 25 ℃ and 125 ℃, respectively.
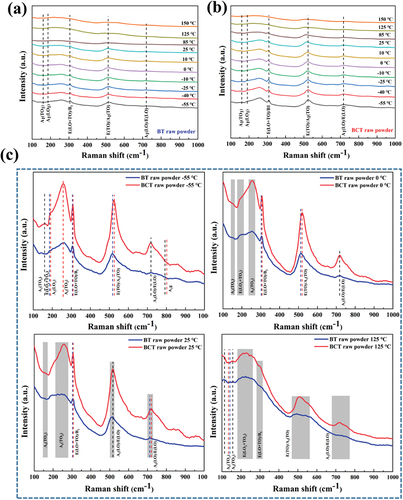
) shows the temperature-dependent Raman spectra of BCT raw powder. Comparing BT and BCT Raman Spectra, A1(TO1) phonon mode shifts toward a higher wavenumber and A1(LO1) has appeared with Ca-doping Ba sites in BT. The reason is that the unit cell volume is reduced and the Ti-O phonon vibrational distance narrowed in the TiO6 octahedron as Ca2+ is doped into Ba sites, which delays the disappearance of R and C phases and suppresses the long-range ferroelectric properties of BCT-based samples [Citation25]. Along with the increase in temperature from −55 to 150 oC, the line width of all the Raman peaks also increases for BCT raw powder, which indicates a decrease in structural coherence. In comparison with BT raw powder, the BCT raw powder exhibits O and T phases that exist in a wider temperature range and the temperature point at which the T phase transforms into the C phase also moves in the high-temperature direction. This confirms that the stability range of the T phase increases with Ca substitution [Citation17].
3.2. Microstructures and nonlinear dielectric properties
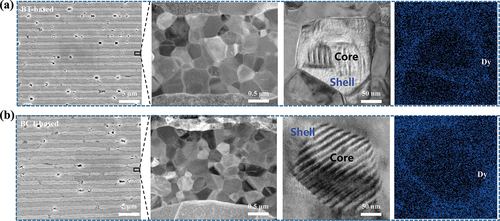
The microstructure of ultra-thin MLCCs is revealed by FESEM, and the samples are chemically etched in a mixture of H2O: HCl: HF for 5 seconds pores of the metal layers are visible for the two samples ()), which would increase the contraction of Ni electrodes and then induce a mismatch between Ni layer and BT layer. Hence, the BT layer would inhibit the shrinkage of the Ni layer to obtain high compatibility of hetero-structural layers, which is beneficial for generating tensile stress and promoting larger residual stress in MLCCs chips. It should be pointed out that the discontinuity of metal electrodes also plays a key role in determining the local failure site and high porosity of Ni electrodes leads to significant local electric field contributions of failure.
Figure 3. (a)(b) FESEM micrograph of BT-based dielectric layer and TEM micrograph, EDS mapping of core-shell structure and map scanning of the Dy distribution for (a) BT-based sample and (b) BCT-based sample, respectively.
The continuity of metal electrodes can be explained by the following equation [Citation26]:
where S is the electrode continuity of the internal electrode layer, L0 is the total length of the electrode, and L1 is the length of the lost electrode. Here, for MLCCs specimens, the continuity of Ni electrodes increases from 92.5% (BT-based) to 95.6% (BCT-based), indicating that the discontinuity of metal electrodes is greatly suppressed using the BCT as raw material [Citation27,Citation28]. Furthermore, the average grain size of MLCCs is estimated to be 263 nm and 254 nm corresponding to BT-based and BCT-based, respectively, with almost the same size each other, but the particle size uniformity (φ2 = 0.07186) of the BCT-based sample is better than the BT-based sample (φ2 = 0.08745) in ), because of the BCT pure powder with a high tetragonal core and low tetragonal shell structure [Citation16].
Figure 4. Temperature dependence of (a) the dielectric constant and dissipation factor and (b) TCC curves of BT-based sample and BCT-based sample from −75 ℃ to 200 ℃. Grain size distributions for (c) BT-based sample and (d) BCT-based sample.
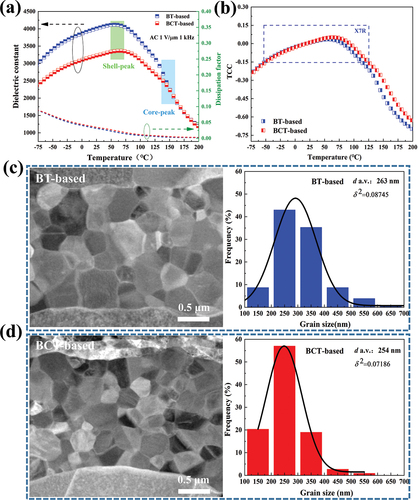
The temperature dependence of the dielectric constant and dielectric loss are given in ). The BCT-based sample exhibits EIA-X7R specifications (variation of permittivity is within ±15%) from −55 to 125 ℃, but the BT-based sample does not meet the X7R characteristics at high temperatures. From ), the shell peaks are clearly observed, and the less obvious core peaks are mainly distributed around the Curie temperature point [Citation29,Citation30]. At the low temperature, no obvious disparities in TCC curves of the BT-based sample and the BCT-based sample are observed in ), maybe the domains of the core are frozen and thus unable to contribute to the permittivity [Citation31]. While the high-temperature TCC curves of the BCT-based sample show a significant lift. This indicates that the thickness and doping concentration of the shell in the core-shell structures is different [Citation32]. From ), the core-shell structure is observed by the peripheral distribution of Dy elements from the shell part to the core part for MLCCs chips, in which the total concentration of Dy elements is approximately 0.6 at.%. Specifically, the BCT-based sample has a thinner shell part, as compared to the BT-based sample, which has a much greater separation between the shell part and the core part. This implies that the presence of Ca in BCT can significantly inhibit the infiltration of Dy elements and increase the concentration of Dy in the shell [Citation33]. Many works of the literature [Citation34–36] have reported that the electronic properties and related reliability of the capacitors were attributed to solubility, distribution of rare-earth oxides, and their occupation sites in BT, especially diffusion and dissolution of rare-earth elements are directly related to their ionic radius. However, the radius of calcium ion is also between barium ion and titanium ion, so it also has the function of doping A/B sites of rare earth elements to balance the Ba/Ti ratio. Under the same conditions, the A/B site in BCT will reach equilibrium more easily than BT, which makes it difficult for the Dy element to be doped into the A or B site, inhibiting the diffusion of the Dy element, and it is easy to form a thinner and higher concentration shell [Citation37]. Through TEM-EDS scan results, it is observed that the BCT-based sample has higher shell concentrations and lower thicknesses relative to the BT-based sample, and the actual data is consistent with the above theory.
Additionally, the room-temperature dielectric constant is about 4100 and 3500 for the BT-based sample and the BCT-based sample, respectively. Thus, the BCT-based sample shows a relatively small dielectric constant. Because of the similar c/a ratio and grain size, the decrease in dielectric constant can be attributed to the synergistic displacement of Ca2+ and Ti4+, resulting in the interaction of electric dipole moments, stabilizing the domain structure and reducing the mobility of the domain wall [Citation38]. As shown in ), the dissipation factor of the BCT-based sample is higher than that of the BT-based sample at room temperature, possibly related to the higher domain-wall density [Citation39], and it is also related to the extra contribution of polarization or mobility [Citation40] to the dielectric permittivity.
To further investigate the mechanism, the dependence of dielectric permittivity on AC electric field was investigated. The variable field TCC curve was measured and shown in ). It is found that the change of dielectric constant with temperature under different AC electric fields. Below the Curie temperature, the dielectric constant increases gradually with the increase in the magnitude of the AC electric field. This shows that the contribution of domain flipping starts to increase gradually with increasing driving field and the degree of change reflects the increasing degree of reversible and irreversible domain contribution. It is shown in ) that the increasing slope from zero ac field to 1 V/μm is quite different between BT-based and BCT-based samples, but the increasing slope beyond 1 V/μm is similar to each other. The dielectric constant of the BCT-based sample is much lower near zero ac field and increases sharply with increasing ac field, and more significantly with decreasing temperature. As the temperature increases from −55 to 85 ℃, the zero ac field dielectric constants of the BT-based sample exhibit an increased behavior followed by a slightly decreased behavior, and those of the BCT-based sample show an increasing behavior, respectively. When the temperature increases to 125 ℃, the dielectric constants of both samples become independent of the ac field, mainly due to the disappearance of the domain contribution. When the ac electric field is less than 1 V/μm, the dielectric constants of the two samples are mainly determined by the contribution of the reversible domain wall motion. In the low-temperature range, the dielectric constant of the BCT-based sample is much lower than that of the BT-based samples, suggesting that Ca incorporation reduces the overall domain mobility and thus the reversible domain wall density.
Figure 5. (a) Dielectric constant dependence of AC-electric field and schematic sketches of domain configuration for BT-based sample and BCT-based sample at −55 ℃, 25 ℃, 85 ℃ and 125 ℃, respectively. (b) Evolution of reversible FORC distributions for BT-based sample and BCT-based sample at −55 ℃, 25 ℃, 85 ℃ and 125 ℃, respectively.
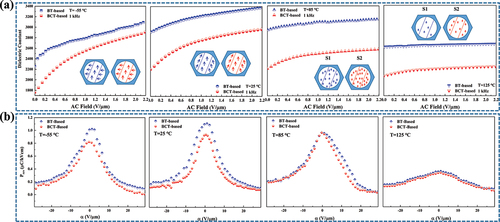
In order to characterize the dielectric non-linearity as observed in ), the FORCs were measured and the FORC distributions were calculated. ) shows the calculated reversible FORC distributions, prev(α) for the BT-based sample and BCT-based sample, as a function of α at the temperature of −55 ℃, 25 ℃, 85 ℃, and 125 ℃, respectively, where α is the switching field. As the temperature increases from −55 ℃ to 85 ℃, the reversible FORC distributions of the BT-based sample show an increasing and then slightly decreasing behavior and the BCT-based sample shows a gradually increasing behavior. The reversible FORC distribution value of the BCT-based sample is lower than that of the BT-based sample in the entire α range and in all temperature ranges. When the temperature is increased to 125 ℃, the reversible distribution of the BT-based sample and BCT-based sample decreases substantially at the same time and tends to be consistent. The reversible FORC distribution of ) and the zero- or low-field dielectric constant of ) shows almost the same temperature dependence, which demonstrates that the low-field dielectric constants are correlated with the reversible domain wall contributions.
) show the calculated irreversible FORC distributions, pirr(α,β) of the BT-based sample and BCT-based sample for the temperature of −55 ℃, 25 ℃, 85 ℃, and 125 ℃, respectively. The highest intensities of pirr(α,β) are observed at −55 ℃ in ). However, its non-reversible domains are frozen and do not play a role in contributing to the dielectric constant. When the temperature increases from −55 to 125 ℃, the intensities of the irreversible FORC distributions decrease slowly, which could be caused by the decreased interaction of reversible domain walls with the weakly pinning centers by the increase in temperature. Due to the disappearance of the ferroelectric nature of the spontaneous polarization at 125 ℃, there is little intensity of the irreversible FORC distribution, and no difference is observed between the bt-based samples and the BCT-based samples.
Figure 6. (a)(b) Evolution of irreversible FORC distributions for BT-based sample and BCT-based sample at −55 ℃, 25 ℃, 85 ℃ and 125 ℃, respectively.
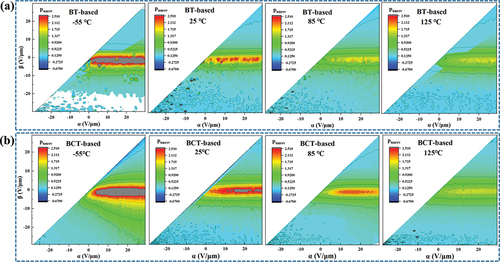
Compared with these two samples, the intensities of the irreversible FORC distribution near the origin at the temperature of −55 ℃ and 25 ℃ are higher for the BCT-based sample. The density of the weakly pinning centers is larger for the BCT formed by Ca-doped Ba sites in barium titanate and thereby the increase in the portion of the irreversible domain walls, which becomes more significant with the decrease in temperature and results in small dielectric constants at low ac field and a steep increase of them by the increase of ac field. When the temperature further increases to 85 ℃ and 125 ℃, then almost no intern of the pirr(α,β) is observed due to the disappearance of polar components for the BT-based sample, but a small number of non-reversible domains can still be found in the BCT-based sample. The off-center Ca2+ ions in the crystal generate an effective electric dipole moment that works cooperatively with neighboring dipoles generated by the displacement of Ti4+. These cooperative dipole–dipole interactions are supposed to have a stabilization effect on the domain structure, which would cause a decrease in the overall domain wall mobility resulting in a decrease in reversible domain wall density and also the stabilization of the tetragonal phase in BCT crystal [Citation16,Citation41,Citation42].
3.3. Reliability characteristics
As shown in ), two 0805 MLCCs were prepared from different doping matrices. To verify the pressure resistance of ultra-thin MLCCs in practical applications, the slope of the breakdown field vs. dc-bias plots is shown in ). A linear curve is fitted between ln(-ln(1-p)) vs. lnE for BT-based samples and BCT-based samples, implying better reliability of specimens. Moreover, the breakdown field (EB) and correlation coefficient of Weibull distribution (Pearson’s r) are calculated by equation [Citation43,Citation44]:
Figure 7. (a) Photograph of BT-based sample and BCT-based sample. (b) Breakdown field and Weibull distributions of BT-based sample and BCT-based sample, respectively. (c) The high-temperature IR degradation curves of BT-based sample and BCT-based sample, respectively.
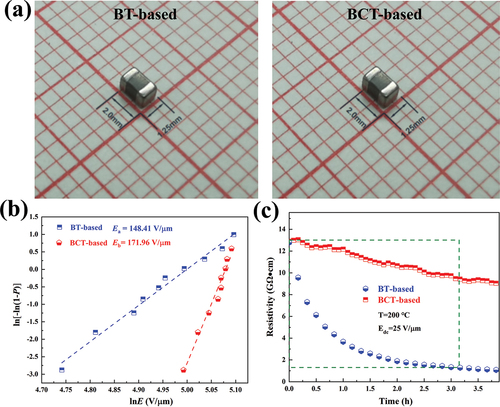
where E is the variable of the breakdown field, p means the probability of failure of specimens with breakdown voltage less than or equal to E, and the scale parameter α represents the breakdown voltage at a failure probability of 0.632, which is approximate to mean of the normal distribution EB, and shape parameters β means the measured values for voltage ranges. The experimental data of ln(-ln(1-p)) vs. lnE is fitted to be a line by equations:
where Xi and Yi are the two parameters in the Weibull distribution function, Ei is the specific breakdown voltage of each specimen in the experiments, n is the sum of specimens of each specimen (here n = 10), and i is the rank of specimens. From ), Xi and Yi are fitted to a straight line by the Weibull distribution, and the value of E is calculated at Y = 0 as Eb. The breakdown field strength of the BCT-based sample is larger than that of the BT-based sample, which mainly depends on the grain boundary density and the Schottky barrier of the BT–Ni interface layer. The grain boundary provides a double Schottky barrier, and the interface layer contributes more than 60% of the resistance value of the product, which exists as the main withstand voltage region. The FESEM measurement results show the thickness of the dielectric layer of the two samples is about 1.5 μm. Depending on the grain size, it can be estimated that the BT-based sample has 5.703 crystal grains in one dielectric layer and the BCT-based sample has 5.905 crystal grains in one dielectric layer. It can be inferred that the grain boundary density of the BCT-based sample is greater than that of the BT-based sample. Thus, the smaller the grain size, the larger the grain boundary area so the partial pressure is higher under the same voltage. Therefore, a medium with a high proportion of grain boundaries has a higher apparent breakdown strength, assuming that the electric field strengths leading to local breakdown are comparable. The breakdown field strength of the BCT-based sample with a smaller grain size is significantly higher than that of the BT-based sample with a larger grain size.
) are the in situ I–V curves and lnJ/T2 vs. E1/2 curves of the BT-based sample and the BCT-based sample, respectively. The leakage current of the BT-based sample also changes greatly with the increase in temperature and the leakage current of the BCT-based sample is smaller than that of the BT-based sample. When the leakage current in the device is dominated by the electric field excitation mechanism, its leakage current variation with temperature can be expressed as [Citation45,Citation46]:
Figure 8. (a) The TSDC spectra of BT-based sample and BCT-based sample from 150 to 300 ℃ (the fixed polarization fields of 12 kV/cm, the polarization time of 10 min and the heating rate is 3 ℃/min). (b)(c) The fitting plots of lnJ v.s. 1/T of oxygen vacancies migrated from core and shell and grain boundaries at the temperature of 300 oC for BT-based sample and BCT-based sample, respectively. (d) I–V curves and (e)(f) lnJ/T2 v.s. E1/2 curves of BT-based sample and BCT-based sample.
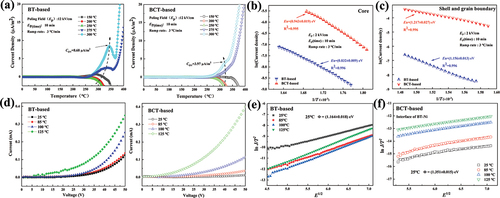
where m is the electron mass, k is the Boltzmann’s constant, h is the Planck's constant, Φ is the work function, ε is the permittivity of the dielectrics, and T is the absolute temperature. A plot of log J/T2 v.s. E1/2 would be linear if Schottky emission occurred in the dielectrics. The Schottky barriers at 25 ℃ for the BT-based sample and BCT-based sample are 1.164 eV and 1.351 eV, respectively [Citation47]. It is clear that the BCT-based sample is significantly better than the BT-based sample and the effect of temperature on the Schottky barrier at the interface is also relatively small, which is beneficial to the reliability of the BME-MLCCs.
The time dependence of the insulation resistivity of chips at high temperatures and dc-bias field (HALT) [Citation48,Citation49] are also measured and investigated. It is observed from ) that the resistivity of the BT-based sample is almost the same as the BCT-based sample in the absence of the DC field, but a significant difference between the two specimens appears within a few hours when the DC field is applied. During the first 3.2 h, the resistivity of the BT-based sample occurred with a dramatic decrease as time passed, the resistivity of the BT-based sample changed from 1.3 × 10¹¹ to 1.3 × 10¹⁰, and we can classify the specimen with the phenomenon as a failed product, but the resistivity of the BCT-based sample occurred with a slight decrease as time passed.
The defect carriers in the dielectric are activated under the action of temperature and electric field, thus leading to leakage behavior. TSDC was adopted to identify the type of defects. ) shows TSDC measurement with the fixed dc polarization field of 12 kV/cm, and the polarization temperature (Tp) varies from 150 to 300 ℃ for the BT-based sample and BCT-based sample. ) shows that a weak TSDC peak appears with a lower relaxation peak temperature (Tm) of about 313 ℃ when Tp increases to 275 ℃. When Tp increases to 300℃, the value of the TSDC peak increases (Cov = 8.68 μA/m2) and the relaxation peak temperature moves to the right at about 343 oC. ) shows that a weak TSDC peak appears with a lower relaxation peak temperature (Tm) of about 325 ℃ when Tp increases to 275 ℃. When Tp increases to 300 ℃, the value of the TSDC peak increases (Cov = 3.97 μA/m2) and the relaxation peak temperature moves to right about 318 ℃. This indicates that the oxygen vacancy concentration of the BCT-based sample is lower than that of the BT-based sample, which is mainly due to the increase in the concentration of partial oxygen vacancies CaTi”-VO¨ induced by Ca-doping Ti sites. The lattice distortion induced by Ca dope at the Ti site leads to a decrease in the mobility of oxygen vacancies, thereby increasing the activation energy for the migration of oxygen vacancies inside the grain-core, the data in can be further verified.
Table 1. The relaxation activation energies of TSDC curves for BT-based sample and BCT-based sample, respectively.
The polarization phenomenon is a typical characteristic of space charge migration. Therefore, these TDSC peaks should be associated with the relaxation of oxygen vacancies, after a spatial redistribution under the polarization conditions. According to the TSDC spectra and the previous reports, the TSDC peak with the lower Tm appears first and shows a slight decrease under higher polarization temperatures. It can be concluded that the weak peak originates from the ingrain-core electromigration of oxygen vacancies and the subsequent sharp rise in the current density with the high relaxation temperature is caused by the cross grain-shell and grain-boundary oxygen vacancies. The TSDC with a single relaxation can be mathematically described by the following equation [Citation50,Citation51]:
where J is the current density, C is the geometric constant, s is a frequency factor related to the vibrational frequency of the material, and a is a parameter related to the heating rate during the measurement. n0 is the concentration of trapped carriers, E is the activation energy, k is the Boltzmann constant, and T is the absolute temperature. Taking the logarithms of both sides of EquationEquation (6)(6)
(6) , the resulting equation describes the peak region of the TSDC as a curve of the following equation [Citation52]:
where Tm corresponds to the temperature at which the current peaks. The first term of EquationEquation (8)(8)
(8) dominates during the rising phase of the current peak so there is approximately [Citation53].
The activation energy for each relaxation process can be obtained using EquationEquation (8)(8)
(8) . The activation energy data are shown in . The IR characteristics mainly depend on the Schottky barrier of grain boundaries and it can be found by comparison that the activation energy in the BCT-based sample is larger than that in the BT-based sample, which is the fundamental reason for the BCT being a better doping matrix.
4. Conclusion
BME-MLCCs with high reliability were successfully prepared by doping the same system with the original BCT powder. In the temperature range of −55 − 125 ℃, X7R-TCC curves of the BCT-based sample are believed to have better temperature stability. The TCC curve shows better temperature stability when the shell with higher doping element concentration and smaller thickness is formed. Smaller grain sizes with higher grain boundary density caused a larger space charge polarization, which leads to a lower dielectric constant and higher dissipation factors. The presence of Ca in the BCT is prone to doping in Ti sites leading to an additional increase in the defect concentration of CaTi”-VO¨, but the lattice distortion induced by Ca would prevent the migration rate of oxygen vacancies, thereby increasing the activation energy of oxygen vacancy migration, prolonging the resistance degradation time of BCT-based sample, improving the overall reliability of ultra-thin MLCCs. Both the experimental and calculated results showed that BCT raw materials are promising candidates for ultra-thin MLCCs with excellent permittivity-temperature stability and reliability.
Acknowledgments
This study was supported by the National Key Research Program of China (Grant No. 2022YFB3807400), Natural Science Foundation of Guangdong Province (Grant No. 2022A1515012604), Foundation of State Key Laboratory of New Electronic Components and Materials (Grant Nos. FHR-JS-202011012, FHR-JS-202011013, and FHR-JS-202011014), and Joint Innovation Center of Advanced Electronic Components and Materials (Grant No. FHR-JS-202103001).
Disclosure statement
No potential conflict of interest was reported by the author(s).
Additional information
Funding
References
- Chang CY, Wang WN, Huang CY, et al. Effect of MgO and Y2O3 doping on the formation of core–shell structure in BaTiO3 ceramics. J Am Ceram Soc. 2013;96(1):2570–2576.
- Berthelot R, Basly B, Buffiere S, et al. From core–shell BaTiO3@MgO to nanostructured low dielectric loss ceramics by spark plasma sintering. J Mater Chem C. 2014;2(20):683–690.
- Liu Y, Cui B, Wang Y, et al. Core–shell structure and dielectric properties of Ba0.991Bi0.006TiO3@Nb2O5–Co3O4 Ceramics. J Am Ceram Soc. 2016;99(2):1664–1670.
- Yoon SH, Randall CA, Hur KH. Effect of acceptor (Mg) concentration on the resistance degradation behavior in acceptor (Mg)-Doped BaTiO3 bulk ceramics: impedance analysis. J Am Ceram Soc. 2009;92(2):1758–1765.
- Hong K, Lee TH, Suh JM. Perspectives and challenges in multilayer ceramic capacitors for next generation electronics. J Mater Chem C. 2019;7(3):9782–9802.
- Mizuno Y, Hagiwara T, Chazono H. Effect of milling process on core-shell microstructure and electrical properties for BaTiO3-based Ni-MLCC. J Eur Ceram Soc. 2001;21(2):1649–1652.
- Yoon SH, Kang SH, Kwon SH, et al. Resistance degradation behavior of Ca-doped BaTiO3. J Mater Res. 2010;25(3):2135–2142.
- Krishna PSR, Pandey D, Tiwari VS. Effect of powder synthesis procedure on calcium site occupancies in barium calcium titanate: a Rietveld analysis. Appl Phys Lett. 1993;62(2):231–233.
- Yang Y, Hao H, Zhang L, et al. Structure and enhanced dielectric temperature stability of BaTiO3-based ceramics by Ca ion B site-doping. Ceram Int. 2018;44(3):11109–11115.
- Sharma P, Berwal N, Ahlawat N, et al. Study of structural, dielectric, ferroelectric and magnetic properties of vanadium doped BCT ceramics. Ceram Int. 2019;45(2):20368–20378.
- Ouni IB, Chapron D, Aroui H. Ca doping in BaTiO3 crystal: effect on the Raman spectra and vibrational modes. J Appl Phys. 2017;121(4):114102.
- Chen CS, Chou CC, Lin IN. Microstructures of X7R type base-metal-electrode BaTiO3 capacitor materials prepared by duplex-structured process. J Eur Ceram Soc. 2005;25(4):2743–2747.
- Yoon SH, Park Y, Kim CH, et al. Effect of Ca incorporation on the dielectric nonlinear behavior of (Ba, Ca)TiO3 multi layer ceramic capacitors. Appl Phys Lett. 2014;105(6):242902.
- Iwahori Y, Tanaka HM, Takata Y. Core/shell structure of ferroelectric (Ba0.94Ca0.06)TiO3 grains. J K Phys Soc. 2009;55(5):830–834.
- Moriyoshi C, Takeda S, Magome E. Origin of Composition Variation of Ferroelectric Phase Transition Temperature in (Ba,Ca)TiO3 by Synchrotron Radiation Powder Diffraction. Jap J Appl Phys. 2013;52(8):09KF02.
- Fu D, Itoh M, Koshihara S, et al. Anomalous phase diagram of ferroelectric (Ba,Ca) TiO3 single crystals with giant electromechanical response. Phys Rev Lett. 2008;100(2):227601.
- Mitsui T, Westphal WB. X-Ray Studies of CaxBa1−xTiO3 and CaxSr1−xTi O3. Phys Rev Lett. 1961;124(2):1354.
- Banno K, Koga T, Takeda T. Melanogenesis and natural hypopigmentation agents. T T Pub Ltd. 2009;388(3):225–228.
- Yamamoto Y, Kawamura K, Sugimoto H, et al. Significant displacement of calcium and barium ions in ferroelectric (Ba0.9Ca0.1)TiO3 revealed by x-ray fluorescence holography. Appl Phys Lett. 2022;120(1):052905.
- Sidorov TA. Structure of BaTiO3 phases is studied by comparing neutron diffraction and Raman spectroscopy data. Russ J Inorg Chem. 2011;56(1):1957–1966.
- Smith MB, Page K, Siegrist T. Growth of 0.1 (Bi,Na)TiO3–0.9BaTiO3 epitaxial films by pulsed laser deposition and their electric properties. J Am Ceram Soc. 2018;130(5):6955–6963.
- Perry CH, Hall DB. Temperature Dependence of the Raman Spectrum of BaTiO3. Phys Rev Lett. 1965;15(2):700.
- Dobal PS, Dixit A, Katiyar RS. Micro-Raman scattering and dielectric investigations of phase transition behavior in the BaTiO3–BaZrO3 system. J App Phys. 2001;89(2):8085–8091.
- Wang CZ, Yu R, Krakauer H. Polarization dependence of Born effective charge and dielectric constant in KNbO3. Phys Rev B. 1996;54(2):11161.
- Deluca M, Vasilescu CA, Ianculescu AC. Investigation of the composition-dependent properties of BaTi1−xZrxO3 ceramics prepared by the modified Pechini method. J Eur Ceram Soc. 2012;32(2):3551–3566.
- Polotai AV, Yang GY, Dickey EC. Utilization of Multiple-Stage Sintering to Control Ni Electrode Continuity in Ultrathin Ni-BaTiO3 Multilayer Capacitors. J Am Ceram Soc. 2007;90(3):3811–3817.
- Nakamura T, Yao T, Ikeda J, et al. Improvement of the Reliability of Dielectrics for MLCC. M S E. 2011;18(2):092007.
- Yang G, Yue ZX, Sun TY, et al. Evaluation of residual stress in a multilayer ceramic capacitor and its effect on dielectric behaviors under applied DC bias field. J Am Ceram Soc. 2008;91(3):887–892.
- Tian Z, Wang XH, Gong HL, et al. Core–shell structure in nanocrystalline modified BaTiO3 dielectric ceramics prepared by different sintering methods. J Am Ceram Soc. 2011;94(2):973–977.
- Ogihara H, Randall CA, Trolier-Mckinstry S. High‐energy density capacitors utilizing 0.7BaTiO3–0.3BiScO3 ceramics. J Am Ceram Soc. 2010;92(4):1719–1724.
- Ortega N, Kumar A, Scott JF, et al. Relaxor-ferroelectric superlattices: high energy density capacitors. J Phys B-Condens Mat. 2012;24(3):445901.
- Jeon SC, Yoon BK, Kim KH. Effects of core/shell volumetric ratio on the dielectric-temperature behavior of BaTiO3. J Adv Ceram. 2014;3(5):76–82.
- Iwahori Y, Tanaka H, Takata M. Core/shell structure of ferroelectric (Ba0.94Ca0.06) TiO3 grains. J K Phys Soc. 2009;55(3):830–834.
- Molak A, Winiarski A, Szeremeta AZ, et al. Electrical features of ferroelectric (Ba0.83Ca0.17)TiO3 ceramics with diffused phase transition under pressure. J Alloy Compd. 2020;856(3):158216.
- Palaimiene E, Macutkevic J, Banys J. Crossover from Ferroelectric to Relaxor Behavior in Ba1−x CaxTiO3(x= 0.17) System. Materials. 2020;13(3):2854.
- Veerapandiyan VK, Khosravi S, Canu G. B-site vacancy induced Raman scattering in BaTiO3-based ferroelectric ceramics. J Eur Ceram Soc. 2020;40(4):4684–4688.
- Lee S, Saw SH, Lee PCK. Schmidt, Computing plasma focus pinch current from total current measurement. Appl Phys Lett. 2008;92(4):111501.
- Hong K, Lee TH, Suh JM, et al. Perspectives and challenges in multilayer ceramic capacitors for next generation electronics. J Mater Chem C. 2019;7(7):9782–9802.
- Hoshina T, Takizawa K, Li J, et al. Domain size effect on dielectric properties of barium titanate ceramics. Jpn J Appl Phys. 2008;47(6):7607–7611.
- Tutuncu G, Li B, Bowman K. Domain wall motion and electromechanical strain in lead-free piezoelectrics: insight from the model system (1-x)Ba(Zr0.2Ti0.8)O3-x (Ba0.7Ca0.3)TiO3 using in situ high-energy X-ray diffraction during application of electric fields. J Appl Phys. 2014;115(3):1153–1348.
- Yoon SH, Park Y, Kim CH. Effect of Ca incorporation on the dielectric nonlinear behavior of (Ba,Ca)TiO3 multi layer ceramic capacitors. Appl Phys Lett. 2014;105(4):242902.
- Levin I, Krayzman V, Woicik JC. Local-structure origins of the sustained Curie temperature in (Ba,Ca)TiO3 ferroelectrics. Appl Phys Lett. 2013;102(2):162906.
- Nagayoshi M, Matsubara K, Fujikawa N. Analyses of microstructure at degraded local area in Ni-multilayer ceramic capacitors under highly accelerated life test. Jpn J Appl Phys. 2020;59:3.
- Masuduzzaman M, Xie S, Chungv J. The origin of broad distribution of breakdown times in polycrystalline thin film dielectrics. Appl Phys Lett. 2012;101(3):153511.
- Yoon SH, Kim SH, Kim DY. Correlation between I(current)-V(voltage) characteristics and thermally stimulated depolarization current of Mn-doped BaTiO3 multilayer ceramic capacitor. J Appl Phys. 2013;114(3):074102.
- Sze SM, Ng KK. Physics of Semiconductor Devices. Johy Wiley & Sons. 2007;199(2):20–26.
- Heidary DSB, Qu W, Randall CA. Electrical characterization and analysis of the degradation of electrode Schottky barriers in BaTiO3 dielectric materials due to hydrogen exposure. J Appl Phys. 2015;117(3):124104.
- Yoon SH, Lim JB, Kim SH. Influence of Dy on the dielectric aging and thermally stimulated depolarization current in Dy and Mn-codoped BaTiO3 multilayer ceramic capacitor. J Mater Res. 2013;28(3):3252–3256.
- Yoon SH, Lim JB, Kim SH, et al. Influence of Dy on the dielectric aging and thermally stimulated depolarization current in Dy and Mn-codoped BaTiO3 multilayer ceramic capacitor. Appl Phys Lett. 2013;103(2):042901.
- Yoon SH, Randall CA, Hury KH. Correlation between resistance degradation and thermally stimulated depolarization current in acceptor (Mg)‐doped BaTiO3 submicrometer fine‐grain ceramics. J Am Ceram Soc. 2010;93(4):1950–1956.
- Yoon SH, Randall CA, Hury KH. Effect of acceptor (Mg) concentration on the resistance degradation behavior in acceptor (Mg)‐doped BaTiO3 bulk ceramics: iIThermally stimulated depolarization current analysis. J Am Ceram Soc. 2010;92(3):1766–1772.
- Kamel FE, Gonon P, Jomni F. Thermally stimulated currents in amorphous barium titanate thin films deposited by RF magnetron sputtering. J Appl Phys. 2006;100(2):054107.
- Liu WY, Randall CA. Thermally stimulated relaxation in Fe‐doped SrTiO3 systems: single crystals. J Am Ceram Soc. 2008;91(5):3245–3250.