
ABSTRACT
The enteroinvasive bacterium Shigella flexneri is known as a highly host-adapted human pathogen. There had been no known other reservoirs reported until recently. Here 34 isolates obtained from animals (yaks, dairy cows and beef cattle) from 2016 to 2017 and 268 human S. flexneri isolates from China were sequenced to determine the relationships between animal and human isolates and infer the evolutionary history of animal-associated S. flexneri. The 18 animal isolates (15 yak and 3 beef cattle isolates) in PG1 were separated into 4 lineages, and the 16 animal isolates (1 yak, 5 beef cattle and 10 dairy cow isolates) in PG3 were clustered in 8 lineages. The most recent human isolates from China belonged to PG3 whereas Chinese isolates from the 1950s–1960s belonged to PG1. PG1 S. flexneri may has been transmitted to the yaks during PG1 circulation in the human population in China and has remained in the yak population since, while PG3 S. flexneri in animals were likely recent transmissions from the human population. Increased stability of the large virulence plasmid and acquisition of abundant antimicrobial resistance determinants may have enabled PG3 to expand globally and replaced PG1 in China. Our study confirms that animals may act as a reservoir for S. flexneri. Genomic analysis revealed the evolutionary history of multiple S. flexneri lineages in animals and humans in China. However, further studies are required to determine the public health threat of S. flexneri from animals.
Introduction
Shigella is a member of the family Enterobacteriaceae, and is the primary agent of shigellosis, or bacterial dysentery, which mostly affects children under the age of five years [Citation1,Citation2]. This bacterium has evolved from Escherichia coli multiple times, through parallel acquisition of key virulence factors including the invasion plasmid pINV to become pathogenic [Citation3]. Shigella currently stands as a genus with 4 species [Citation4]. Shigella flexneri is predominant in low and lower middle-income countries, accounting for more than 50% of all cases of shigellosis in these countries, whereas S. sonnei mainly occurs in high-income countries [Citation5–7]. Complex factors contribute to the successful spread of Shigella, including unreliable sanitation systems, unavailability of clean drinking water, the ability of the organism to invade and subvert host defences, and the acquisition of antimicrobial resistance (AMR) [Citation2,Citation5]. Shigella pathogenesis-associated genomic regions are chromosome pathogenicity islands (PAIs) and the large virulence plasmid (pINV) [Citation8–10]. pINV carries a 37 kb “entry region” that encodes the Type III secretion system (T3SS) and the T3SS effectors which are essential for Shigella the bacteria to infect host cells [Citation11,Citation12]. Chromosome-encoded pathogenicity islands SHI-1 and SHI-2 also play an important role in virulence [Citation9,Citation13,Citation14].
S. flexneri shows considerable diversity with more than 17 recognized serotypes [Citation15], and serotype 2a predominates in endemic countries [Citation16]. The most S. flexneri circulating in China belonged to sequence type (ST) 91 with serotypes 2a and Xv prevalent [Citation17,Citation18]. A global genomic study divided the S. flexneri population into 7 phylogenetic groups (PGs) [Citation19]. These different PGs were found in all geographic regions with some geographic restrictions. Although Shigella is known as a highly host-adapted human pathogens [Citation5], a recent study reported the isolation of S. flexneri from animals [Citation20,Citation21]. In this study, we isolated and performed genome sequencing of 34 S. flexneri isolates obtained from animals (yaks, dairy cows and beef cattle) from 2016 to 2017 and 268 human S. flexneri isolates from China. We further discussed the relationships between the animal- and human -associated S. flexneri and inferred their evolutionary history. Our work contributes to the development of appropriate measures for the surveillance and control of S. flexneri infections.
Materials and methods
Sampling from animals and isolation of S. flexneri
Samples from dairy cows and beef cattle were collected from the Gansu, and Shanxi provinces during 2016–2017. Domestic yaks were sampled from Qinghai and Gansu provinces of the Qinghai–Tibet Plateau. Rectal swab were the preferred sampling choice, followed by the faecal samples. An improved method for traditional isolation and culture was developed. Anaerobic culture enrichment was performed using Shigella broth (SB) with 0.5 μg/ mL novobiocin at 37°C for 8–10 h (0.2 ml of each sample was inoculated into 10 mL of SB). All the enriched samples were screened for Shigella using a PCR assay targeting the ipaH gene [Citation22]. The ipaH PCR positive samples were inoculated onto 2 different types of selective agar medium media (Hektoen enteric agar (HEA) medium and xylose lysine deoxycholate (XLD) agar medium, Oxoid, Basingstoke, UK) to detect Shigella spp. [Citation23]. Typical colonies were selected and recultured on brain heart infusion (BHI) agar plates (Oxoid, UK) at 37 °C for 24 h.
Shigella flexneri human-associated isolates
In total of 268 human isolates from China were selected including 7 human isolates from the 1950s to 1960s and 261 human isolates from 1997 to 2017, 59 of which were sequenced in a previous study [Citation17]. These isolates with different serotypes were collected from 17 provinces of China. As it was the major cause of shigellosis in China since 2000, more isolates of serotype Xv were selected. We also included 346 genome sequences of human isolates from public databases from Africa, Asia, Latin America, Europe, and North America (Publicly available at the NCBI BioProject (PRJEB2846, PRJEB2460 and PRJEB2542)) [Citation19]. The isolates used in this study are listed in supplementary Table S1.
Whole genome sequencing and detection of single nucleotide polymorphisms (SNPs)
DNA was extracted using the Wizard® Genomic DNA Purification Kit (Promega, USA) according to the manufacturer’s instructions. Library preparation was performed using the Nextera XT Library Prep Kit (Illumina, USA) according to the manufacturer’s instructions. The libraries were sequenced on an Illumina/Solexa platform with a minimum 100-fold coverage at the Tianjin Biochip Corporation (Tianjin, China).
After quality control and read trimming using FastQC [Citation24], the high-quality reads were assembled using Spades 3.13.0 [Citation25]. Sequencing reads were mapped to the reference genome (S. flexneri serotype xv strain 2002017: accession number: CP001383.1) using BWA v0.7.17 with the default settings. Snippy v4.4.5 was used to call SNPs between the reads and reference genome with the default parameters: snippy -cpus 16 -outdir mysnps -ref 2002017.gbk -R1 R1.fastq.gz -R2 R2.fastq.gz (https://github.com/tseemann/snippy) [Citation26].
Construction of phylogenetic relationships
To mitigate the effect of recombination on phylogenetic analyses, we identified the recombinant regions with high SNP densities using Gubbins v3.0.0 [Citation27], and removed them for phylogenetic analysis of the 648 S. flexneri isolates (34 animal isolates, 268 Chinese isolates sequenced by us and 346 publicly available genomes including 4 from mainland China). To infer a maximum likelihood tree based on the non-recombinant genome region SNPs, we ran FastTree v2.1.11 with the generalized time-reversible model and a gamma distribution for modelling the site rate variation[Citation28]. We estimated the phylogenetic patterns with 100 bootstrap replicates. To further determine the shared patterns of sequence variation, we used fastbaps v1.0.6, which is based on hierarchical Bayesian clustering, to partition the phylogeny into phylogenetic groups (PGs) [Citation29].
Temporal analysis
To assess the timing of divergence among S. flexneri isolates, we performed molecular clock analysis using BEAST2 v2.6.3 [Citation30,Citation31]. All the strains were used to capture the complete temporal and geographical range. BEAST2 was run independently across at least 2 chains of 100 million generations, each of which was sampled at every 1000 iterations to ensure agreement. Maximum likelihood trees constructed using PhyML v.3.0 [Citation32] or Iqtree v.1.6.9 [Citation33] were used for the initial evaluations of the presence of temporal signals in the dataset by regressing the root-to-tip distances versus sampling years in TempEst [Citation34]. All Bayesian phylogenetic inferences were performed using BEAST 1.10 [Citation35] and BEAGLE v.3 [Citation36]. We used a GTR + Gamma substitution model [Citation37], and the skygrid model [Citation38] was specified as a flexible-tree prior. In the exploratory analyses, branch lengths were rescaled into time units using a strict or relaxed [Citation39] clock model. A host-specific local clock model [Citation40,Citation41] was used to test for a host effect on the evolutionary rate. As it was unclear to which host category (human or animal) the branches basal to animal clades should be assigned, we integrated over both alternatives using a model averaging procedure to evaluate support for the hypotheses [Citation42].
Convergence and mixing properties were evaluated in Tracer v1.7 [Citation43], which was also used to determine the appropriate number of samples to be discarded as burn-in. Maximum clade credibility (MCC) summary trees were obtained using TreeAnnotator distributed in BEAST v1.10. The trees were visualized either using FigTree v.1.4.4 (https://github.com/rambaut/figtree) or iTol [Citation44].
Virulence factors and antimicrobial resistance determinants
The presence of virulence genes located in pINVs and PAIs and the AMR genes were identified using BLAST against the reference loci described in the VFDB [Citation45], PAIDB v2.0 [Citation46] and CARD databases [Citation47] (CARD; https://card.mcmaster.ca). The virulence plasmid pCP301 of S. flexneri 2a str. 301 was used as the reference (accession number: AF386526.1).
Analysis of host-associated accessory genes
The assembled contigs of each isolate were annotated using the Prokaryotic Genome Annotation System (Prokka) pipeline v1.14.5 [Citation48]. The resulting annotations of all the isolates in GFF3 format were fed into the Roary v3.13.0 pangenome pipeline to identify the core and accessory genes [Citation49]. We chose a percentage identity of 95% to distinguish the core genes from the accessory genes. Scoary v1.6.16 was used to determine the accessory genes that were associated with humans and animals [Citation50]. We further confirmed the presence of putative animal-associated accessory genes in both animal and human isolates using BLASTN v2.11.0 [Citation51].
Results
The serotype distribution of S. flexneri in China
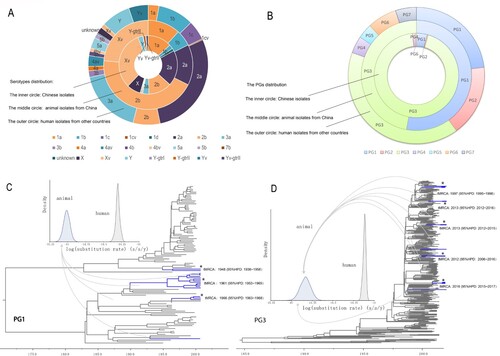
The 34 S. flexneri isolates were obtained from 2,102 samples screened, with 16 from yaks, 10 from dairy cattle, and 8 from beef cattle. The detection rate was 1.22% (16/1311) in yaks, 2.11% (10/474) in dairy cows, and 2.52% (8/317) in beef cattle. Most isolates (61.76%, 21/34) were collected from calves with diarrhoea, with 6 from yak calves and 15 from other calves. Five different serotypes (2b, 2a, 1b, 1a and Xv) were identified among these animal-associated isolates, with serotype 2b being the most common, followed by serotype Xv ((A)). The 268 human isolates from China belonged to 17 serotypes, with serotype Xv being the most predominant (32.09%) ((A)).
Figure 1. Characteristics and phylogenetic groups distribution, and maximum clade credibility (MCC) trees of PG1 and PG3 clades. A. Serotype distribution of the isolates used in this study. The inner, middle, and outer circles depict the proportion of human isolates from China, animal isolates, and human isolates from other countries by serotype. Serotypes were based on genome sequence predictions. Y-gtrI, Y-gtrIII and Yv-gtrII denotes the gtrI, gtrIII and gtrII genes detected in these isolates. B. Phylogenetic group (PG) distribution of the isolates used in this study. The inner, middle and outer circles depict the proportion of human isolates from China, animal isolates, and human isolates from other countries by the PGs. C: Maximum clade credibility (MCC) tree of PG1 isolates. The branches of animal isolates lineages are coloured in blue. For details of the phylogenetic relationships among the isolates, see supplementary figure S1. D: Maximum clade credibility tree of PG3 isolates. The branches of animal isolate lineages are coloured in blue. For details of the phylogenetic relationships of the isolates, see supplementary Figure S2.
Phylogenetic structure of S. flexneri
Phylogenomic analysis revealed that the 648 S. flexneri isolates were divided into the previously defined 7 PGs reported by Connor et al. [Citation19] ((B), 2A). The 272 human isolates from China (268 sequenced by us and 4 from public database) were clustered into 5 PGs. Most isolates fell into PG3 (91.54%, 249/272), as the majority of the isolates were from 2001 to 2012. Only 8.46% of the isolates were clustered into other PGs (6.62% in PG1, 1.10% in PG4, 0.37% in PG2, and 0.37% in PG6). No Chinese isolates were found in PG5 and PG7 ((B)).
Isolates from animal hosts were found in 2 PGs, with 52.94% (18/34) in PG1 and 47.06% (16/34) in PG3 ((B)). The 18 animal isolates (15 yak and 3 beef cattle isolates) in PG1 were separated into 4 lineages ((C)) with each containing one (serotype 1a), two (both serotype 1b), four (all serotype 2b), and 11 (all serotype 2b) isolates respectively and were not identical to any human isolates (Figure S1). The only serotype 1a animal isolate was closest to a 1978 France serotype 1a isolate; the 2 serotype 1b isolates were grouped together with three Chinese serotype 1b isolated isolated between 1997 and 2003 and one Chinese serotype 3a isolate from 2001; the four serotype 2b isolates grouped together with a 1965 serotype 2b human isolate from China and the 11 serotype 2b isolates were grouped with two 1950s serotype 2b human isolates from China (Figure S1). The 16 animal isolates (1 yak, 5 beef cattle and 10 dairy cow isolates) in PG3 were clustered in 8 lineages ((D)). Five lineages contained two to four isolates wheras three lineages contained a single isolate. The animal lineages were grouped with different Chinese isolates sequenced in this study. Most PG3 animal isolates were obtained from Gansu province. Interestingly they were not grouped with human isolates from the Gansu province. There are 4 animal isolates from 2 different province grouped together (one from Gansu and three from Shanxi), and were closer to each other than to human isolates from Gansu (Figure S2).
Temporal signals and evolutionary rates in the different host populations
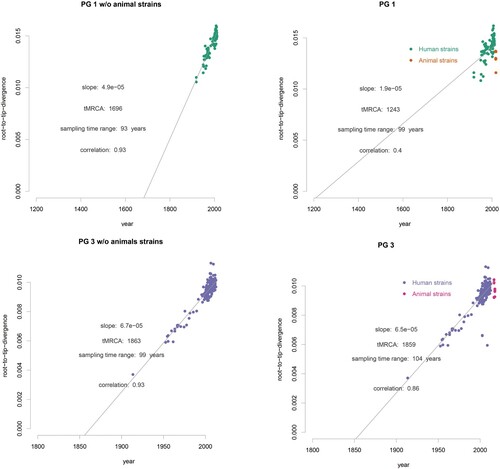
Using BEAST [Citation30], we performed molecular clock analysis to estimate the time to the most recent common ancestor (tMRCA) of isolates from different animal lineages within PG1 and PG3 as all animal isolates and the most humane isolates in China fell within these 2 two clades ((B,C)). Using the date of isolate collection to calibrate the respective phylogenies, the temporal signal varied among clades ((B)). We computed the root to tip divergence using TempEST [Citation34] and obtained a strong correlation between the time of sampling and the root-to-tip distances ((B)), indicating a strong temporal signal for molecular clock analysis. The correlations were highly significant following 10,000 date randomizations (PG1: R2 = 0.4; PG3: R2 = 0.86). The residuals does not vary much without animal strains (without animal R2 = 0.93, with animal and human R2 = 0.86) in PG3 than in PG1 (without R2 = 0.93, with R2 = 0.4) (). However, there was no correlation of root to tip divergence and sampling time for animal only isolates (data not shown). The evolutionary rates for PG1 and PG3 total isolates (human and animal isolates) were 6.0×10⁻⁷, (95% HPD: 5.8×10⁻⁷−7.3×10⁻⁷) and 6.1×10⁻⁷ (95% HPD: 5.9×10⁻⁷−6.3×10⁻⁷) substitutions per nucleotide site per year, respectively. For PG1 and PG3 human only isolates were 5.7×10⁻⁷ (95% HPD: 5.3×10⁻⁷–6.2×10⁻⁷) and 7.3×10⁻⁷ (95% HPD: 7.1×10⁻⁷–7.6×10⁻⁷). There was marginal difference in the rates with and without animal isolates (). We also calculated evolutionary rates for PG1 and PG3 animal isolates only which were PG1: 9.7×10⁻⁹ (95% HPD: 5.7×10⁻⁹–1.4×10⁻⁸) and 3.4×10⁻⁸ (95% HPD: 1.5×10⁻⁸–5.5×10⁻⁸). The rates of animal only isolates were significantly slower than those of the human only isolates. Based on the evolutionary rate for the total human and animal isolates, the age (year) of the most recent common ancestor (tMRCA) for each of the 4 animal lineages within PG1 ranged from 1948 to 1966 ((C), S1) and that for the 8 animal lineages within PG3 ranged from 1997 to 2016 ((D), S2).
Figure 2. Population structure of the 648 S. flexneri isolates. A: PGs of the 648 S. flexneri isolates. The PGs were identified from the maximum likelihood tree of the 648 isolates and nodes within the PGs are collapsed. B: Exploration of the temporal signal in the data by regressing root-to-tip genetic distances against sampling times with residuals coloured by PG. Correspondence between the colours of the residuals and PGs is as indicated in the legend. The numbers between brackets indicate the strains obtained for this study in China from human and animal hosts, respectively for which information regarding sampling time was available. C: Maximum-likelihood tree of S. flexneri inferred from 61,581 single nucleotide polymorphisms (SNPs). All SNPs were recorded by their position in reference to the 2002017 genome. Potential genome-wide SNPs outside the recombinant regions were used. Coloured rings from the inside to outside indicate the study origin, geographical regions, and PG groups and hosts.
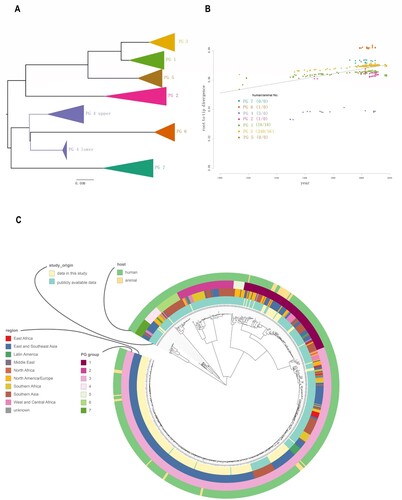
Figure 3. Clade-wise exploration of the temporal signals of PG1 and PG3 Root to tip divergence was computed using TempEST, with and without the animal isolates for PG1 and PG3 considered separately. The animal and human isolates are coloured as shown.
Virulence factors and antimicrobial resistance determinants in different PGs and animal-associated isolates
The virulence plasmid pINV which carries a 37 kb entry region encoding the Ipa-Mxi-Spa type III secretion system (T3SS) is essential for Shigella virulence. It enable the bacterium to invade intestinal epithelial cells, escape into the host cell to move in the cytosol of infected cells, undergo cell-to-cell spread, and result in pyroptosis in macrophages [Citation11,Citation12]. The presence of pINV in the 648 isolates across different PGs was markedly different (). Within PG 1 and PG3, the distribution of virulence factors between animal isolates and human isolates was similar (Figure S3). pINV was absent in 90.91%, 82.61% and 64.71% of the PG5, PG1 and PG4 isolates respectively, while pINV was not detected in 0%, 0%, 1.69% and 18.06% of the PG7, PG6, PG2 and PG3 isolates respectively. All PG1 isolates from animal sources harboured the 37 kb T3SS “entry region” deleted from the pINV. For other virulence factors, SHI-1 was mainly carried by PG3 isolates, and there was no difference in the presence of SHI-1 between human and animal PG3 isolates. The enterobactin iron acquisition system genes were widely present in PG3, but absent in 64.95% of PG1 isolates. The sit gene was occasionally absent in some human isolates, but was present in all animal isolates ().
Figure 4. Comparison of the distribution of virulence factors and antimicrobial resistance determinants of S. flexneri isolates from animals and Chinese human isolates within and between PG1 and PG3. The compositions of virulence factors and AMR determinants in each isolate are represented as the percentage identity of the best BLAST hit. The virulence factors/genes (in order) are SHI-1 (pic, set1A, set1B, and sigA), SHI-2 (iucA, iucB, iucC, iucD, and iutA), enterobactin genes (entA, entB, entD, entE,entF, fepA, fepB, fepC, fepD, and fepG), sit (sitA, sitB, sitC, and sitD), ics (icsA/virG, icsB, and icsP), ipa (ipaA, ipaB, ipaC, and ipaD), ipg (ipgA, ipgB1, ipgB2, ipgC, ipgD, ipgE, and ipgF), msbB2, mxi (mxiA, mxiC, mxiD, mxiE, mxiG, mxiH, mxiI, mxiJ, mxiK, mxiL, mxiM, and mxiN), osp (ospB, ospC1, ospC2, ospC3, ospC4, ospD1, ospD2, ospD3, ospE1, ospE2, ospF, and ospG), sepA, spa (spa13, spa15, spa24, spa29, spa32, spa33, spa40, spa47, and spa9), and vir (virA, virB, virF, and virK). The AMR genes are aac(3)-II, aadA1, aadA2, aadA5, strA, strB, and sat1 (aminoglycosides); blaCTX-M-24, blaOXA-1, and blaTEM-1 (β-lactams); catA1 and catB1 (phenicols); dfrA17, dfrA3b, dfrA1, dfrA5, dfrA14 and dfrA8 (trimethoprims); ermB, msrE, mphA,and mphE (macrolides); qacEΔ1 and qnrS1(quinolones); qepA, sul1, and sul2 (sulphonamides), and tetA(A), tetA(D), and tetA(B) (tetracyclines).
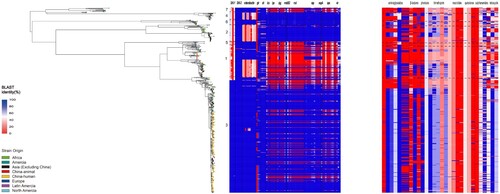
We also screened for all AMR genes using BLAST against the CARD databases. PG3 isolates carried significantly more AMR genes on average than those in PG1 isolates (, S3), with the inter-quartile range (IQR) of 53.53% for PG3 compared to an IQR of 25.50% for PG1. However, the carriage rate of resistance genes for tetracycline (tet (A)), trimethoprim (dfrA1, dfrA5, dfrA14, and dfrA17), β-lactam antibiotics (blaOXA-1), ammonium compounds (catA1) and aminoglycosides (strA, strB) by animal PG1 isolates was considerably lower than that in PG3 (, S3), with the rates being 2.62%, 29.76%, 33.75%, 35.63%, 32.39%, 0%, 5.56%, 0% and 0% in PG1 and 50.93%, 99.32%, 74.52%, 71.17%, 70.70%, 100%, 100%, 49.95% and 49.95% in PG3. The carriage rate of AMR genes by animal PG3 isolates was similar to that in the Chinese human PG3 isolates (, S3).
Host-associated accessory genes
We assessed whether there were any accessory genes were associated with animal associated S. flexneri, which may contribute to adaptation using Scoary [Citation50]. A 90% sensitivity and 90% specificity were used as the cut off and association analysis was performed for PG1 and PG3, separately. We identified 33 and 12 accessory genes that were significantly associated with animal isolates in PG3 and PG1 respectively (Table S2). However, BLASTn searches indicated that most of these genes were present in human isolates. One gene, ospE2 was confirmed to be present at very different frequencies of 82.35% and 13.36% in animal and human PG3 isolates, respectively. Multiple insertion sequences (ISs) were found to be genuinely associated with animal isolates in PG1 and PG3. A unique contig detected in 11 animal S. flexneri genomes (F9, F39, F38, F34, F28, F27, F26, F24, F21, F20, F14) in PG1 was found to be 100% identical to that in E. coli plasmid pLF82 [Citation52].
Discussion
Shigella spp., emerged from within E. coli multiple times [Citation3] is a human host-specific pathogen, which pose a significant health threat and with no known animal reservoir until recently [Citation5,Citation7]. In this study, we confirmed that animals were colonized by S. flexneri as a reservoir. A comparative phylogenetic analysis of the S. flexneri genome isolated from humans and animals showed a clear picture of the population structure of genomic diversity, as well as the relationships between geography, temporal signals, and hosts.
After PG3 was introduced into China, the dominant population of S. flexneri changed, and PG3 is nearly the only clade currently circulating in the human population in China. The animal S. flexneri population contained a mix of the PG1 and PG3 clades in different proportions to those in the current human S. flexneri population in China, suggesting that it is most likely that human S. flexneri was transmitted to the animal population at different times and then maintained in the animal population. Molecular dating suggested that the PG1 animal lineages date back to the 1940s to 1960s. Thus, it is likely that PG1 entered the animal population when they were predominantly circulating back and then remained in the animal population. The fact that two animal lineages shared a close relationship with human isolates from China from 1950s to 1960s supports this hypothesis. However, one animal lineage shared a close relationship with recent human PG1 isolates. Therefore, it is also possible that the transmission can be recent in either direction, but cannot be differentiated without more data. The PG3 animal isolates were similar to the isolates circulating in humans in recent years, and all of them belonged to ST91 which carried multidrug resistance and some belonged to the recently emerged novel Xv serotype [Citation17], providing more evidence that S. flexneri from humans was transmitted to the animal population. However, we could not identify any direct regional transmission events as none of the animal isolates was close to human isolates from the same region. Interestingly some animal lineages contained animal isolates from different provinces. One animal isolate (F15) from Gansu and three animal isolates (F11, F12 and F17) from Shanxi in PG3 grouped together and were closer to each other than to human isolates from Gansu. Overall, our results showed that animals are a reservoir of diverse S. flexneri isolates and that animal domestication is a key factor in the spread and host adaptation of pathogens. It seems that there was no animal to human transmission event in the studied population and/or time period. However, it is possible that animals are an important reservoir and many transmit S. flexneri to the human population as the number of analyzed samples were small.
The S. flexneri isolates from yaks were obtained from Qinghai and Gansu, which are important yak farming provinces in China, where the earliest domestications of yaks occurred [Citation53]. PG1 S. flexneri may have entered the yak population a long time ago, likely when PG1 was predominantly circulating in China. Yaks have a restricted distribution in China, mostly in the Qinghai-Tibet Plateau (QTP) and in the adjacent alpine and subalpine areas where human population density is relatively low and yaks have little contact with humans [Citation53,Citation54]. The yak S. flexneri may have been well separated from human population for direct transmission in recent years since the S. flexneri isolated from humans from these provinces was similar to human isolates from other parts of China than to yak S. flexneri. It would be interesting to conduct sampling of yaks in the less populated regions to further understand the S. flexneri evolution in the yaks. Further studies are also needed to determine any transmissions between yak and human populations.
We attempted to determine the genes involved in S. flexneri adaptation to the animal population. By analyzing PG1 and PG3 isolates separately, we found that 12 genes in PG1 and 33 genes on PG3 were significantly associated with animal isolates. However, further analysis of the genes revealed that most of these genes were present in human isolates and some were at lower proportions. The initial difference detected was likely because that these genes were not annotated as functional genes. These genes may have continued their degradation as Shigella genomes are known to contain many pseudogenes. IS expansion and the associated genome decay is a typical feature of host adapted pathogens [Citation55]. Whether any of the functional genes found to be differentially present in animal isolates are necessary for S. flexneri to live in animals remains to be determined. Very few genes that were common to PG1 and PG3 animal isolates were found, suggesting that even if these genes play an adaptive role, they are not essential for surviving in animals. Interestingly, 11 yak isolates belonging to the same lineage in PG1 carried an E. coli plasmid LF82, suggesting that this plasmid may have been acquired by their MRCA.
The ability of Shigella to cause bacillary dysentery has been attributed to its virulence factors, which are encoded on chromosomal pathogenicity islands and the 210 kb plasmid pINV [Citation13]. Virulence plasmids can provide S. flexneri with a competitive advantage to adapt to specific econiches and enhance their survival [Citation56]. The Shigella T3SS delivers effectors into the host cells and mediates entry of the bacterium. However, pINV or the invasion region on the plasmid is known to be unstable [Citation57]. During in vitro growth, an increased growth rate of S. flexneri happens after lose the PAIs or the entire plasmid, which highlighting the fitness cost of pINV to S. flexneri [Citation58]. The presence of the invasion region or the entire plasmid markedly differed between different PGs, suggesting the differences in the stability of the plasmid or invasion region in different PGs. Over 80% of PG1 isolates lost the plasmid or the invasion region but only 18% of the PG3 isolates lost these. The animal PG1 strain has lost the key virulence determinants similar to human PG1 isolates, meaning there is less of a threat of it spreading back to the human population. PG1 is an older lineage than PG3. It is thus possible that the inherent instability of the plasmid may have led to the disappearance of PG1. On the other hand, the increased stability and acquisition of other virulence factors such as SHI-1 may have enabled PG3 to expand globally. Nearly all recent isolates in China belonged to PG3 of ST91 which carried two drug resistance islands and an O antigen modifying plasmid [Citation17]. Acquisition of new drug resistance and the the more stable pINV plasmid may have given PG3 a competitive advantage to replace other PGs in China and can facilitate successful clonal expansion in most Asian and African countries [Citation59].
Animals were not considered a natural host of Shigella and the isolation rate from animals was low at 1.62%. Over 60% of the isolates were obtained from calves with diarrhoea, suggesting that S. flexneri can cause disease in young animals. Further studies are required to determine the virulence factors needed for them to cause disease in animals. Nearly all PG1 animal isolates lacked the invasion region or the entire pINV plasmid, suggesting that other virulence factors may have played a role in causing diarrhoea.
Examination and comparison of clades within the phylogeny of this lineage revealed different evolutionary rates between humans and animals. Our results suggested animal-associated strains evolve at a considerably slower rate than human-associated strains. It could be caused by multiple factors, such as different selective pressure suffered between the animal and human isolates and insufficient temporal signal in the animal isolates. It is thus plausible that these lineages, once entered the animal population, had evolved slower in the new host environment. The differences of animals in life-history traits may leave a measurable imprint on the isolates’ rate of evolution. However, the temporal signals in animal only isolates from both PG1 and PG3 datasets were insufficient for molecular dating (R2 was negative [data not shown]). The lack of temporal signals was likely to have been caused by the limited number of animal isolates sampled and a very short sampling time of only two years (2016–2017) with no animal isolates from any earlier years. Another possibility is that the tip date calibration underestimated the divergence of animal lineages. In particular, PG1 arose earlier than PG3 and had evolved for a longer evolutionary time with deeper branches. Underestimation of deep divergence times based on tip date calibration has been discussed recently in measles virus evolution [Citation42,Citation60]. Long term substitution rates are affected by long-term purifying selection and possible substitution saturation [Citation42]. Therefore, although our results strongly support a rate slow-down in animal isolates, further investigation using a dataset with animal strains sampled over a longer time period are needed to understand any possible effects of transmission between the two different hosts on the evolutionary rates.
In conclusion, there were multiple S. flexneri lineages in the animal populations and animals may act as a reservoir of S. flexneri. Different clades of S. flexneri may persist in the animal population. In particular, S. flexneri may have been circulating in the yak population for a long time or transmitted to the yaks during PG1 circulation in the human population in China. Other animal S. flexneri isolates were likely recent transmissions from human populations indicating that and animals are a potential reservoir for human infections. Further studies are needed to determine the potential transmission of S. flexneri from animals to humans as a public health threat.
Author contributions
Jianguo Xu and Ruiting Lan conceived the study. Zhen Zhu, Shan Lu, Dong Jin, Jing Yang, Jianping Wang, Kui Dong, Mingchao Xu and Junrong Liang collected the samples and isolated the strains. Bram Vrancken and Huaiyu Tian performed the temporal analysis. Junrong Liang, Jing Meng, Li Zhang, TaiJiao Jiang and Ji Pu performed the other bioinformatic analysis. Junrong Liang, Jianguo Xu, Ruiting Lan, Bram Vrancken and Li Zhang wrote the manuscript. Ruiting Lan, TaiJiao Jiang and Tian Qin provided critical analysis and discussions.
Supplemental Material
Download Zip (2.1 MB)Disclosure statement
No potential conflict of interest was reported by the author(s).
Data availability
Sequencing data were submitted to the Sequence Read Archive (SRA) with the project number PRJNA820478 (The strains used are listed in Supplementary file 1).
Additional information
Funding
Related Research Data
References
- Hosangadi D, Smith PG, Kaslow DC, et al. WHO consultation on ETEC and Shigella burden of disease, Geneva, 6–7th April 2017: Meeting report. Vaccine. 2019 Nov 28;37(50):7381-7390.
- Kotloff KL, Nataro JP, Blackwelder WC, et al. Burden and aetiology of diarrhoeal disease in infants and young children in developing countries (the global enteric multicenter study, GEMS): a prospective, case-control study. Lancet. 2013 Jul 20;382(9888):209–222.
- Yang F, Yang J, Zhang X, et al. Genome dynamics and diversity of Shigella species, the etiologic agents of bacillary dysentery. Nucleic Acids Res. 2005;33(19):6445–6458.
- Pupo GM, Lan R, Reeves PR. Multiple independent origins of Shigella clones of Escherichia coli and convergent evolution of many of their characteristics. Proc Natl Acad Sci U S A. 2000 Sep 12;97(19):10567–10572.
- Kotloff KL, Riddle MS, Platts-Mills JA, et al. Shigellosis. Lancet. 2018 Feb 24;391(10122):801–812.
- Thompson CN, Duy PT, Baker S. The rising dominance of Shigella sonnei: An intercontinental shift in the etiology of bacillary dysentery. PLoS Negl Trop Dis. 2015;9(6):e0003708.
- Bardhan P, Faruque AS, Naheed A, et al. Decrease in shigellosis-related deaths without Shigella spp.-specific interventions, Asia. Emerg Infect Dis. 2010 Nov;16(11):1718–1723.
- Walker JC, Verma NK. Identification of a putative pathogenicity island in Shigella flexneri using subtractive hybridisation of the S. flexneri and Escherichia coli genomes. FEMS Microbiol Lett. 2002 Aug 6;213(2):257–264.
- Ingersoll M, Groisman EA, Zychlinsky A. Pathogenicity islands of Shigella. Curr Top Microbiol Immunol. 2002;264(1):49–65.
- Niu C, Yang J, Liu H, et al. Role of the virulence plasmid in acid resistance of Shigella flexneri. Sci Rep. 2017 Apr 25;7:46465.
- Sansonetti PJ. Genetic and molecular basis of epithelial cell invasion by Shigella species. Rev Infect Dis. 1991 Mar-Apr;13(Suppl 4):S285–S292.
- Buchrieser C, Glaser P, Rusniok C, et al. The virulence plasmid pWR100 and the repertoire of proteins secreted by the type III secretion apparatus of Shigella flexneri. Mol Microbiol. 2000 Nov;38(4):760–771.
- Lan R, Lumb B, Ryan D, et al. Molecular evolution of large virulence plasmid in Shigella clones and enteroinvasive Escherichia coli. Infect Immun. 2001 Oct;69(10):6303–6309.
- Ingersoll MA, Moss JE, Weinrauch Y, et al. The ShiA protein encoded by the Shigella flexneri SHI-2 pathogenicity island attenuates inflammation. Cell Microbiol. 2003 Nov;5(11):797–807.
- Sun Q, Lan R, Wang Y, et al. Development of a multiplex PCR assay targeting O-antigen modification genes for molecular serotyping of Shigella flexneri. J Clin Microbiol. 2011 Nov;49(11):3766–3770.
- Nato F, Phalipon A, Nguyen TL, et al. Dipstick for rapid diagnosis of Shigella flexneri 2a in stool. PLoS One. 2007 Apr 18;2(4):e361.
- Zhang N, Lan R, Sun Q, et al. Genomic portrait of the evolution and epidemic spread of a recently emerged multidrug-resistant Shigella flexneri clone in China. J Clin Microbiol. 2014 Apr;52(4):1119–1126.
- Ye C, Lan R, Xia S, et al. Emergence of a new multidrug-resistant serotype X variant in an epidemic clone of Shigella flexneri. J Clin Microbiol. 2010 Feb;48(2):419–426.
- Connor TR, Barker CR, Baker KS, et al. Species-wide whole genome sequencing reveals historical global spread and recent local persistence in Shigella flexneri. Elife. 2015 Aug 4;4:e07335.
- Sestak K, Merritt CK, Borda J, et al. Infectious agent and immune response characteristics of chronic enterocolitis in captive rhesus macaques. Infect Immun. 2003 Jul;71(7):4079–4086.
- Zhu Z, Cao M, Zhou X, et al. Epidemic characterization and molecular genotyping of Shigella flexneri isolated from calves with diarrhea in Northwest China. Antimicrob Resist Infect Control. 2017;6:92.
- Vu DT, Sethabutr O, Von Seidlein L, et al. Detection of Shigella by a PCR assay targeting the ipaH gene suggests increased prevalence of shigellosis in Nha Trang, Vietnam. J Clin Microbiol. 2004 May;42(5):2031–2035.
- Uyttendaele M, Bagamboula CF, De Smet E, et al. Evaluation of culture media for enrichment and isolation of Shigella sonnei and S. flexneri. Int J Food Microbiol. 2001 Nov 8;70(3):255–265.
- de Sena Brandine G, Smith AD. Falco: high-speed FastQC emulation for quality control of sequencing data. F1000Res. 2019;8:1874.
- Bankevich A, Nurk S, Antipov D, et al. SPAdes: a new genome assembly algorithm and its applications to single-cell sequencing. J Comput Biol. 2012 May;19(5):455–477.
- Bush SJ. Generalizable characteristics of false-positive bacterial variant calls. Microb Genom. 2021 Aug;7(8):000615.
- Croucher NJ, Page AJ, Connor TR, et al. Rapid phylogenetic analysis of large samples of recombinant bacterial whole genome sequences using Gubbins. Nucleic Acids Res. 2015 Feb 18;43(3):e15.
- Price MN, Dehal PS, Arkin AP. Fasttree: computing large minimum evolution trees with profiles instead of a distance matrix. Mol Biol Evol. 2009 Jul;26(7):1641–1650.
- Tonkin-Hill G, Lees JA, Bentley SD, et al. Fast hierarchical Bayesian analysis of population structure. Nucleic Acids Res. 2019 Jun 20;47(11):5539–5549.
- Bouckaert R, Heled J, Kuhnert D, et al. BEAST 2: a software platform for Bayesian evolutionary analysis. PLoS Comput Biol. 2014 Apr;10(4):e1003537.
- Wu A, Su C, Wang D, et al. Sequential reassortments underlie diverse influenza H7N9 genotypes in China. Cell Host Microbe. 2013 Oct 16;14(4):446–452.
- Guindon S, Dufayard JF, Lefort V, et al. New algorithms and methods to estimate maximum-likelihood phylogenies: assessing the performance of PhyML 3.0. Syst Biol. 2010 May;59(3):307–321.
- Nguyen LT, Schmidt HA, von Haeseler A, et al. IQ-TREE: a fast and effective stochastic algorithm for estimating maximum-likelihood phylogenies. Mol Biol Evol. 2015 Jan;32(1):268–274.
- Rambaut A, Lam TT, Max Carvalho L, et al. Exploring the temporal structure of heterochronous sequences using TempEst (formerly Path-O-Gen). Virus Evol. 2016 Jan;2(1):vew007.
- Suchard MA, Lemey P, Baele G, et al. Bayesian phylogenetic and phylodynamic data integration using BEAST 1.10. Virus Evol. 2018 Jan;4(1):vey016.
- Ayres DL, Cummings MP, Baele G, et al. BEAGLE 3: improved performance, scaling, and usability for a high-performance computing library for statistical phylogenetics. Syst Biol. 2019 Nov 1;68(6):1052–1061.
- Yang Z. Maximum likelihood phylogenetic estimation from DNA sequences with variable rates over sites: approximate methods. J Mol Evol. 1994 Sep;39(3):306–314.
- Gill MS, Lemey P, Faria NR, et al. Improving Bayesian population dynamics inference: a coalescent-based model for multiple loci. Mol Biol Evol. 2013 Mar;30(3):713–724.
- Drummond AJ, Ho SY, Phillips MJ, et al. Relaxed phylogenetics and dating with confidence. PLoS Biol. 2006 May;4(5):e88.
- Worobey M, Han GZ, Rambaut A. A synchronized global sweep of the internal genes of modern avian influenza virus. Nature. 2014 Apr 10;508(7495):254–257.
- Vrancken B, Rambaut A, Suchard MA, et al. The genealogical population dynamics of HIV-1 in a large transmission chain: bridging within and among host evolutionary rates. PLoS Comput Biol. 2014 Apr;10(4):e1003505.
- Dux A, Lequime S, Patrono LV, et al. Measles virus and rinderpest virus divergence dated to the sixth century BCE. Science. 2020 Jun 19;368(6497):1367–1370.
- Rambaut A, Drummond AJ, Xie D, et al. Posterior summarization in Bayesian phylogenetics using Tracer 1.7. Syst Biol. 2018 Sep 1;67(5):901–904.
- Letunic I, Bork P. Interactive tree Of life (iTOL) v4: recent updates and new developments. Nucleic Acids Res. 2019 Jul 2;47(W1):W256–W259.
- Liu B, Zheng D, Jin Q, et al. VFDB 2019: a comparative pathogenomic platform with an interactive web interface. Nucleic Acids Res. 2019 Jan 8;47(D1):D687–D692.
- Yoon SH, Park YK, Kim JF. PAIDB v2.0: exploration and analysis of pathogenicity and resistance islands. Nucleic Acids Res. 2015 Jan;43(Database issue):D624–D630.
- Jia B, Raphenya AR, Alcock B, et al. CARD 2017: expansion and model-centric curation of the comprehensive antibiotic resistance database. Nucleic Acids Res. 2017 Jan 4;45(D1):D566–D573.
- Seemann T. Prokka: rapid prokaryotic genome annotation. Bioinformatics. 2014 Jul 15;30(14):2068–2069.
- Page AJ, Cummins CA, Hunt M, et al. Roary: rapid large-scale prokaryote pan genome analysis. Bioinformatics. 2015 Nov 15;31(22):3691–3693.
- Brynildsrud O, Bohlin J, Scheffer L, et al. Rapid scoring of genes in microbial pan-genome-wide association studies with Scoary. Genome Biol. 2016 Nov 25;17(1):238.
- Benson DA, Karsch-Mizrachi I, Clark K, et al. Genbank. Nucleic Acids Res. 2012 Jan;40(Database issue):D48–D53.
- Miquel S, Peyretaillade E, Claret L, et al. Complete genome sequence of Crohn's disease-associated adherent-invasive E. coli strain LF82. PLoS One. 2010 Sep 17;5(9):e12714.
- Chai ZX, Xin JW, Zhang CF, et al. Whole-genome resequencing provides insights into the evolution and divergence of the native domestic yaks of the Qinghai-Tibet Plateau. BMC Evol Biol. 2020 Oct 27;20(1):137.
- Ma L, Xu S, Liu H, et al. Yak rumen microbial diversity at different forage growth stages of an alpine meadow on the Qinghai-Tibet Plateau. PeerJ. 2019;7:e7645.
- Hawkey J, Monk JM, Billman-Jacobe H, et al. Impact of insertion sequences on convergent evolution of Shigella species. PLoS Genet. 2020 Jul;16(7):e1008931.
- Runyen-Janecky LJ, Hong M, Payne SM. The virulence plasmid-encoded impCAB operon enhances survival and induced mutagenesis in Shigella flexneri after exposure to UV radiation. Infect Immun. 1999 Mar;67(3):1415–1423.
- Sayeed S, Brendler T, Davis M, et al. Surprising dependence on postsegregational killing of host cells for maintenance of the large virulence plasmid of Shigella flexneri. J Bacteriol. 2005 Apr;187(8):2768–2773.
- Pilla G, McVicker G, Tang CM. Genetic plasticity of the Shigella virulence plasmid is mediated by intra- and inter-molecular events between insertion sequences. PLoS Genet. 2017 Sep;13(9):e1007014.
- Muthuirulandi Sethuvel DP, Mutreja A, Pragasam AK, et al. Phylogenetic and evolutionary analysis reveals the recent dominance of ciprofloxacin-resistant Shigella sonnei and local persistence of S. flexneri clones in India. mSphere. 2020 Oct 7;5(5).
- Lythgoe KA, Fraser C. New insights into the evolutionary rate of HIV-1 at the within-host and epidemiological levels. Proc Biol Sci. 2012 Aug 22;279(1741):3367–3375.