
 ?Mathematical formulae have been encoded as MathML and are displayed in this HTML version using MathJax in order to improve their display. Uncheck the box to turn MathJax off. This feature requires Javascript. Click on a formula to zoom.
ABSTRACT
We estimated 2011–2015 Alaska mortality from modifiable behavioural risk factors using relative risks, hazard ratios, and population attributable fraction estimates from a comprehensive review of peer-reviewed literature; prevalence estimates from government reports; as well as data from the Alaska Department of Environmental Conservation for 2011–2015. To identify the number of deaths attributable to specified risk factors, we used mortality data from the Alaska Division of Public Health, Health Analytics & Vital Records Section. Data included actual reported deaths of Alaska residents for 2011–2015 that matched relevant underlying International Classification of Diseases and Related Health Problems 10th Revision codes. The actual causes of death in Alaska in 2011–2015 were estimated to be overweight/physical inactivity (20% of all deaths, 26% of Alaska Native deaths), smoking (18%/18%), alcohol consumption (9%/13%), firearms (4%/4%), and drug use (3%/3%). Other actual causes of death included microbial agents (3%/4%), motor vehicles (2%/2%), and environmental pollution (1%/1%). This updated methodology reveals that overweight/physical inactivity was the leading cause of death in Alaska, followed closely by smoking. Just three preventable causes made up almost 60% of all deaths, and almost 70% of deaths among Alaska Native people, both highlighting disparities and underscoring prevention needs.
The number of people dying of modifiable risk factors such as overweight, smoking, and alcohol has not been comprehensively quantified in the peer-reviewed literature since 2004,[Citation1] and never at a state or regional level. The Centers for Disease Control and Prevention (CDC) lists the 2016 leading causes of death in the USA as heart disease, cancer, and accidents.[Citation2] This status quo framing was challenged in a ground-breaking 1993 article, provocatively titled “Actual Causes of Death”, that quantified major non-genetic causes of death [Citation3]. In 2005, Mokdad et al. published an updated assessment using 2000 data [Citation1]. Both studies reached similar conclusions; tobacco, poor diet/physical inactivity, and alcohol were the leading actual causes of death in the USA. Both studies examined population-level trends, without attention to disparities. In Alaska, as in the US., significant health disparities exist between racial groups, resulting in life expectancies 8.4 years shorter for Alaska Native people [Citation4]. This article updates the methodologies used to quantify actual causes of death, is the first known state-level analysis, and quantifies disparities in actual causes of death.
Methods
This study was a secondary analysis of existing publically available, de-identified, datasets, and was consequently exempt from IRB review. Our analyses took place in 2017–2019 using the most recent 5 years of data available from all sources: 2011–2015. We estimated deaths due to the “actual causes” identified in the two previous national studies: smoking; overweight/physical inactivity; alcohol; microbial agents; toxic agents; motor vehicles; firearms; sexual behaviour; and drug use [Citation1,Citation3]. We calculated estimates using relative risks (RRs), hazard ratios (HRs), and population attributable fractions from published peer-reviewed literature and government reports. We used pollution data from the Alaska Department of Environmental Conservation, and mortality data from the Alaska Division of Public Health, Health Analytics & Vital Records Section (HAVRS), with underlying and contributory International Classification of Diseases and Related Health Problems 10th Revision (ICD-10) codes [Citation5]. We obtained prevalence estimates from Alaska’s Behavioural Risk Factor Surveillance System (BRFSS) [Citation6] and the Pregnancy Risk Assessment Monitoring System (PRAMS) [Citation7]. We used SPSS Statistics 24 to analyse data, SAS 9.4 to attain prevalence estimates, and Microsoft Excel 2010 for data storage and simple calculations.
We conducted a comprehensive literature review of causes of death with multiple mortality end-points (i.e. alcohol, smoking, overweight/physical inactivity, environmental toxins). A PubMed and Google Scholar search of English-language research included the keywords: mortality, smoking, tobacco, alcohol, BMI (body mass index), obesity, overweight, physical inactivity, toxins, air pollution, and indoor air. We used the following formula to calculate attributable fractions: , where
is the percentage of Alaskans not engaging in a risk behaviour,
is the percentage engaging in categories of the risk behaviour, and
is the relative risk of death relative to those not engaging in the behaviour. We then multiplied estimates of the cause-attributable fraction of preventable deaths by total mortality. The contribution of a risk factor (such as smoking) to a disease (such as lung cancer) is quantified using population attributable fractions. These fractions are the proportion of deaths that wouldn’t happen if a given risk factor was eliminated (i.e. how much lower lung cancer levels would be if there were no tobacco use). While many diseases are caused by multiple risk factors and individual risk may be different, these fractions are used for generating population-level estimates to guide prevention efforts.
Further details on the methodology for each actual cause of death are described below.
Figure 1. Actual causes of death in Alaska, 2011-2015 (All Alaskans)
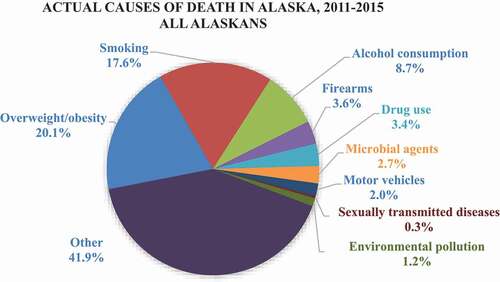
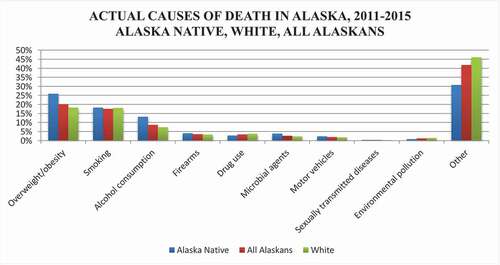
Figure 2. Actual causes of death in Alaska, 2011-2015 (Alaska Native, All Alaskans, White)
Results
Leading causes of the 20,242 Alaska deaths in 2011–2015 were malignant neoplasms (cancer), diseases of the heart, and unintentional injuries () (Personal communication with the Alaska Health Analytics and Vital Records Section, 27 November 2017). In 2011–2015, a larger percentage of white Alaskans died of cancer, heart disease, diabetes, and Alzheimer’s disease than Alaska Native people, while a greater percentage of Alaska Native people died of unintentional injuries, suicide, and chronic liver disease and cirrhosis. We estimate that 58% of all Alaska deaths, 69% of Alaska Native deaths, and 54% of white Alaska deaths were due to the risk factors examined in this paper (see and and ).
Table 1. Leading causes of death in Alaska, 2011–2015: n (%) of Deaths.
Table 2. Actual causes of death in Alaska, 2011–2015.
Overweight/obesity and physical inactivity
We used hazard ratio estimates from the most recent identified meta-analysis on the combined mortality impacts of overweight/obesity and physical inactivity, which examined the impact of cardiorespiratory fitness (assessed as fit/unfit), stratified by BMI categories, on all-cause adult mortality [Citation8]. The analysis found that, compared with normal weight fit individuals, fit individuals who were overweight or obese had no increased risk, while unfit normal weight individuals had a 2.10 HR, unfit overweight individuals had a 2.39 HR, and unfit obese individuals had a 2.46 HR. We used BRFSS estimates on the percentage of Alaskans in the study’s BMI categories: <25 (normal weight), 25 to <30 (overweight), and 30 or greater (obese) [Citation8].
“Fit” was estimated as the top four quintiles (80%), and we consequently used the BRFSS indicator with a similar percentage; Alaska adults who reported any leisure-time physical activity (79%). We used overweight/obesity and physical activity prevalence from 2001 to 2005 as the effects of overweight on mortality may not appear for several years. In Alaska in 2001–2005, an estimated 62.2% of adults had a BMI of 25 or greater [Citation9,Citation10].
We estimated that 4,074 deaths were due to overweight/obesity and physical inactivity; 20.1% of all Alaska deaths in 2011–2015, 18.2% of deaths among white Alaskans, and 25.9% of deaths among Alaska Native people.
As a validation of the chosen methodology, we also examined the impact of overweight/obesity alone, and physical inactivity alone. The most extensive recent meta-analysis located in our literature review on overweight/obesity and mortality was produced by the Global BMI Mortality Collaboration in 2016, although their results were consistent with numerous other studies [Citation11–Citation15]. The meta-analysis included 239 prospective studies and over 10 million participants, and limited confounding and reverse causality by restricting analyses to never-smokers and excluding pre-existing disease and the first 5 years of follow-up [Citation15]. BMI cut-points used in the analysis were 15 to <18.5, 18.5 to <20.0, 20.0 to<25.0, 25.0 to <30.0, 30.0 to <35.0, 35.0 to <40.0, 40.0 to <60.0. We applied their methodology using BMI prevalence estimates from 2001 to 2005, and attained an estimate of 3,694 deaths due to overweight/obesity, or 18.3% of all deaths in Alaska. As this estimate did not adjust for physical activity, it is likely an overestimate of the impact of overweight/obesity alone on BMI [Citation16,Citation17].
We also applied the relative risks and methodology described by the Lancet Physical Activity Series Working Group to examine the impact of physical inactivity on mortality [Citation17]. We used Alaska BRFSS estimates of individuals who met physical activity levels of 30+ minutes of aerobic activity at least 3 days a week or 20+ minutes of vigorous activity at least 2 days a week. This analysis resulted in an estimate of 2,166 deaths due to physical inactivity without controlling for weight, or about 10.7% of all deaths in Alaska in 2011–2015 [Citation17]. While it would be inappropriate to sum these two independent estimates given that physical inactivity and overweight/obesity are not independent variables, these findings are consistent with the idea that the total mortality should be somewhat higher than either independent estimate, but lower than the sum of the two.
The two previous national studies on actual causes of death also included deaths due to nutritional deficiencies. A total of 39 deaths in Alaska in 2011–2015 were estimated to have been caused by a lack of essential nutrients (ICD-10 codes E40-E64). However, as these deaths have a different aetiology than physical inactivity and overweight/obesity, they have not been added to the total for this category.
Smoking
We calculated smoking-attributable mortality using the 2014 Surgeon General’s report methodology [Citation18]. We estimated prevalence of current, former, and non-smokers from BRFSS data, and used SAS version 9.4 to estimate the prevalence of non-smoking Alaskans exposed to second-hand smoke from a supplemental BRFSS survey administered in Alaska. We used estimates of maternal smoking from PRAMS.
The prevalence of current smoking in Alaska in 2011–2015 was 21.0% overall (19.2% for white males, 16.2% for white females, 40.2% for Alaska Native males, and 35.1% for Alaska Native females) [Citation19]. We estimated 3,553 Alaska deaths in 2011–2015 attributable to smoking (17.6%), including 18.3% of deaths among Alaska Native people and 18.1% of deaths among white Alaskans (Table 3). Totals included 85 adult deaths due to second-hand smoking, 6 sudden infant deaths, and 3 infant deaths attributable to maternal smoking (associated with conditions like placenta previa and preterm delivery).
Alcohol consumption
We replicated the methodology of the CDC calculator “Alcohol-Attributable Deaths Due to Excessive Alcohol Use (ARDI)”, [Citation20] which includes both deaths due to acute alcohol-related conditions like alcohol poisoning, as well as attributable fractions for causes like suicide, homicide, motor vehicle accidents, etc. Attributable fractions for causes like oesophageal cancer, liver cancer, and hypertension relied on ARDI’s relative risks for low, medium, and high alcohol consumption prevalence, estimated from BRFSS data. We estimated 1,761 Alaska deaths (8.7%) due to alcohol consumption in 2011–2015, including 13.2% of deaths among Alaska Native people, and 7.4% of deaths among white Alaskans. The specific causes of alcohol death with the most fatalities were alcoholic liver disease (329 deaths), suicide (195), and alcohol abuse (179).
Firearms
There were 722 firearm-related deaths in Alaska in 2011–2015, 3.6% of all deaths, including 190 deaths among Alaska Native people (4.1%), and 465 among white Alaskans (3.3%). An estimated 554 of these deaths among all Alaskans (77%) were due to suicide (ICD-10 codes X72-X74), 116 due to homicide (U014, X93-X95), and 50 due to accidental discharge of firearms, undetermined intent, or legal intervention (W32-W34, Y22-Y24, Y35, Y890).
Drug use
We estimated 711 Alaska deaths attributable to drug use in 2011–2015 (3.4%), including 131 Alaska Native deaths (2.8%), and 526 white deaths (3.8%). Deaths included 585 drug overdoses (primary or contributory underlying ICD-10 code X40-X44, X60-X64, X85, Y10-Y14), 110 due to Hepatitis C (B171, B182, B192), and 16 drug-induced deaths.Footnote1 Drug overdoses may involve more than one substance; opioids were identified in 379 deaths (65%), sedatives in 145 (25%), methamphetamine in 102 (17%), and cocaine in 67 (11%).
Microbial agents
We aggregated deaths due to bacterial, parasitic, and viral infections, many of which are preventable through vaccines and hand washing. We estimated 547 Alaska deaths due to microbial agents in 2011–2015 (2.7%), including 181 Alaska Native deaths (3.9%) and 326 white deaths (2.3%). Deaths were due to pneumonia (266 of all deaths) (ICD-10 codes J12-J18), septicaemia (195) (A40-A41), intestinal infections (50) (A04, A07-A09), influenza and whooping cough (J09-J11, A37), tuberculosis (A16, A17-A19) and hepatitis A (B15).
Motor vehicles
Motor vehicles were an underlying or contributory cause of death in 398 Alaska fatalities (2.0% of all deaths) in 2011-2015, including 111 Alaska Native deaths (2.4%) and 254 white deaths (1.8%).Footnote2 We included alcohol-related motor vehicle deaths to emphasise the contribution of alcohol. The Alaska Department of Transportation and Public Facilities reported that 120 motor vehicle-related deaths were tested and confirmed with a blood alcohol content of.08 or higher, about 30% of all motor vehicle fatalities (personal communication with the Alaska Highway Safety Office, Alaska Department of Transportation and Public Facilities, 4 June 2018). Off-road motor vehicles were a causal factor in 96 deaths, including 50 involving an all-terrain vehicle (ATV) and 46 with a snow machine.
Sexually transmitted diseases
Sexually transmitted diseases (STDs) were estimated to have caused 69 Alaska deaths in 2011–2015 (0.3% of all deaths), including 19 Alaska Native deaths (0.4%) and 37 white deaths (0.3%). Vaccine-preventable cervical cancer accounted for about half of those deaths, with an estimated 35 fatalities (ICD-10 code C53). Remaining deaths were attributable to HIV/AIDS (B20-B24), Hepatitis B (B15), and syphilis (A50-A53).
Environmental pollution
This category was the most challenging to define and measure. We began with the national studies as a reference point; this category on the Mokdad study was termed “toxic agents”, with analyses limited exclusively to outdoor air pollution and occupational exposures (where most deaths were attributable to air pollution). To reflect changing understandings of environmental pollution, we referenced the World Health Organisation (WHO)’s 2016 “Preventing Disease Through Healthy Environments”. [Citation21] We explored each relevant WHO category in-depth, as shared in the online supplement. We estimated 251 deaths in 2011–2015 attributable to environmental pollution (1.2% of all deaths), including 37 Alaska Native deaths (0.8%) and 207 white Alaskan deaths (1.5%). However, limited evidence was available for many indicators, with limited attributable mortality found for most. Only areas where we estimated attributable deaths are included below:
Indoor air quality
We estimated 75 Alaska deaths from COPD in 2011–2015 attributable to poor indoor air quality, including 24 Alaska Native deaths and 55 white deaths. This relied on the liberal assumption that WHO relative risk estimates for developing countries applied to Alaska, and that 6% of Alaskans lived in homes with wood as the primary source of heat (American Community Survey 5-year estimates indicated that 6% of Alaskan homes used wood as their primary source of heat [Citation22]). Additionally, excluding intentional self-harm involving carbon monoxide, there were 18 Alaska deaths due to carbon monoxide (ICD-10 codes, underlying cause: X47, Y17; contributing cause: T58).
Outdoor air pollution
We estimate 57 Alaska deaths attributable to outdoor air pollution in 2011–2015, with about 46% in Anchorage and 35% in Fairbanks, including seven Alaska Native deaths and 45 white deaths. We used the WHO AirQ+ software tool for health risk assessment of air pollution [Citation23]. one-hour and 24 h 2011–2015 values provided by the Air Monitoring and Quality Assurance programme of the Alaska Department of Environmental Conservation included fine particulate matter of 2.5 micrometres and smaller (PM2.5), particulate matter of 2.5–10 micrometres (PM10), airborne nitrogen dioxide (mainly from burning fuel) (NO2) and ground-level ozone.
Ultraviolet radiation
We estimate that 76 Alaska deaths were attributable to ultraviolet radiation, including 70 white deaths and less than 5 Alaska Native deaths. We found 87 Alaska deaths in 2011–2015 due to skin cancer, including 67 due to melanoma, and 20 due to non-melanoma cancers (ICD-10 C43, C449, C443, C444, C445). Approximately 90% of non-melanoma skin cancers and 86% of melanoma are estimated to be attributable to ultraviolet radiation [Citation24–Citation26].
Occupational risks
While many outcomes of occupational exposures are due to multiple causes, pleural mesothelioma is largely due to occupational asbestos exposure [Citation27]. We included the 26 deaths in Alaska in 2011–2015 from mesothelioma (ICD-10 code C45) as attributable to occupational exposure, including 22 white deaths, and less than 5 Alaska Native deaths.
Discussion
A small handful of modifiable behaviours accounted for the majority of deaths in Alaska in 2011–2015 [Citation1,Citation3]. Just three factors; overweight/obesity, smoking, and alcohol consumption, caused almost 60% of all deaths, and almost 70% of deaths for Alaska Native people. These actual causes of death underlie the routinely reported causes of death like cancer, heart disease, and unintentional injuries. This analysis reframes the majority of deaths as preventable, encouraging public health practitioners and decision-makers to look at mitigating risk and alleviating disparities.
These analyses are highly dependent on the sources used, such as ICD-10 codes, BRFSS data, and estimates in peer-reviewed publications and government reports. Each source has its own challenges and levels of uncertainty. In a reassuring, but not exact, validation of attributable fractions used, we estimated 117 Alaska deaths from motor vehicle crashes attributable to alcohol using ARDI methods, while a conversation with the Alaska Department of Transportation and Public Facilities revealed 120 motor vehicle-related deaths that were tested and confirmed with a blood alcohol content of.08 or higher. However, to highlight the critical role of sources, while the methodologies of several peer-reviewed papers on overweight and mortality produced estimates of around 18–20% of Alaska mortality attributable to obesity [Citation8,Citation15,Citation17], a notable author in the field with highly divergent, controversial, results [Citation28,Citation29], produced an estimate of .2%. This highlights the potential variability of estimates given different methodologies and data sources, as well as reinforces the need for researchers to conduct a comprehensive literature review on each topic to choose the most credible sources for future analyses of actual causes of death.
Limited data also impact the ability to produce reliable estimates, although some may not impact the overall conclusions. For example, the online supplement on environmental pollution references numerous limitations, including that the analysis on outdoor air pollution did not include rural areas of Alaska. However, while PM10 (i.e. dust), may be present in rural communities at higher levels than in urban areas, it is unlikely to have large additional mortality estimates as there were 0 deaths found to be attributable to PM10 in Alaska’s more populous urban areas.
Changing understandings of disease aetiology also changes the categorisations of findings. For example, approximately 87% of newly diagnosed HIV cases in Alaska were estimated to have been transmitted through sex [Citation30], but it is unclear if this category will be the best for HIV/AIDS caused deaths, or if a different categorisation of this disease would be more appropriate in the future.
Several areas are important for future study, including investigating the morbidity burdens due to the same modifiable risk factors. Additionally, updating estimates for overweight/physical inactivity when a more rigorous study is published may produce more accurate results. The methodology we used is for all-cause mortality, and not specific end-points such as obesity-associated cancers, heart disease, diabetes, etc. Barry et al. also did not exclude individuals who were underweight, and there may consequently be misattribution of mortality among unfit “normal” weight individuals to a lack of fitness instead of pre-existing sickness.
Deaths attributable to overweight/physical inactivity were the estimated leading cause of death from this analysis. This marks a potential increase in the percentage of deaths due to overweight/physical inactivity; while poor diet and physical inactivity accounted for 14% of national deaths in 1990 and 16.6% of deaths in 2000 (less than smoking both years), we estimated 20% of deaths due to overweight/physical inactivity [Citation1,Citation3]. In contrast, the 18% of Alaska deaths estimated to be attributable to smoking is disappointingly similar to the national 1990 estimate of 19% and 2000 estimate of 18%. These findings are the lived realisation of increasing rates of overweight/obesity, and long-term consequences of tobacco use [Citation31]. We anticipate the percentage of mortality attributable to smoking to fall as smoking rates decline, with deaths attributable to overweight/physical inactivity to climb unless substantial efforts are dedicated to prevention.
A bright spot is the low percentage of mortality attributable to vaccine-preventable diseases. Since widespread vaccination began, there have been dramatic declines in infectious diseases, which has reduced unnecessary disability, and death [Citation32]. Vaccines provide both individual protection for those vaccinated as well as community protection by reducing the spread of disease when coverage rates are high.
This manuscript updates methodologies quantifying actual causes of death and presents the first state-level analyses. Many public health priorities are developed and administered at the state and local level, where national data may have limited relevance or be less actionable. This manuscript presents methodologies translatable to other states and regions, and calls attention to the small number of preventable factors that cause the majority of death to inform policy and quantify the urgent need for prevention.
Supplemental Material
Download MS Word (50.1 KB)Disclosure statement
No potential conflict of interest was reported by the authors.
Supplemental Material
Supplemental data for this article can be accessed here.
Notes
1 Primary or contributory underlying ICD-10 codes D521,D590,D592,D611,D642,E064,E160,E231,E242,E273,E661,F110-F115,F117-F119,F120-F125,F127-F129,F130-F135,F137-F139,F140-F145,F147-F149,F150-F155,F157-F159,F160-F165,F167-F169,F170,F173-F175,F177-F179,F180-F185,F187-F189,F190-F195,F197-F199,G211, G240, G251,G254,G256,G444,G620,G720,I952,J702-J704,L105,L270-L271, M102, M320, M804, M814, M835,M871,R502,R781,R782-R785
2 Underlying or contributory ICD-10 codes: V02-V04, V090, V092, V12-V14, V190-V192, V194-V196, V20-V79, V803-V805, V810-V811, V820-V821, V83-V86, V870-V878, V880-V888, V890, V892
References
- Mokdad AH, Marks JS, Stroup DF, Gerberding JL. Actual causes of death in the United States, 2000. JAMA. 2004;291(10):1238–8. doi:https://doi.org/10.1001/jama.291.10.1238
- CDC/National Center for Health Statistics. FastStats. Deaths and Mortality. Published March 17, 2017. Accessed June 9, 2017. https://www.cdc.gov/nchs/fastats/deaths.htm
- McGinnis JM, Foege WH. Actual causes of death in the United States. JAMA. 1993;270(18):2207–2212.
- Blake I, Provost E, Gibson D, Topol R. Patterns in Life Expectancy — Alaska, 1990–2015. State Alsk Epidemiol Bull. 2017;20:1.
- World Health Organization. The ICD-10 Classification of Mental and Behavioural Disorders: Clinical Descriptions and Diagnostic Guidelines. World Health Organization; 1992.
- BRFSS Methodology. Accessed August 23, 2017. http://dhss.alaska.gov/dph/Chronic/Pages/brfss/method.aspx
- CDC - Methodology - Pregnancy Risk Assessment Monitoring System - Reproductive Health. Published August 21, 2017. Accessed September 28, 2017. https://www.cdc.gov/prams/methodology.htm
- Barry VW, Baruth M, Beets MW, Durstine JL, Liu J, Blair SN. Fitness vs. fatness on all-cause mortality: a meta-analysis. Prog Cardiovasc Dis. 2014;56(4):382–390. doi:https://doi.org/10.1016/j.pcad.2013.09.002
- AK-IBIS - Query Result - Alaska’s Behavioral Risk Factors Surveillance System - (BRFSS_C) Query Module - Overweight or Obese (25+ BMI). Accessed October 12, 2017. http://ibis.dhss.alaska.gov/query/result/BRFSS23/BRFSS_C/XBMIOVOB.html
- AK-IBIS - Query Result - Alaska’s Behavioral Risk Factors Surveillance System - (BRFSS_05) Query Module - No Leisure Time Physi. Accessed October 12, 2017. http://ibis.dhss.alaska.gov/query/result/BRFSS23/BRFSS_05/XANYEXER.html
- Berrington de Gonzalez A, Hartge P, Cerhan JR, et al. Body-Mass Index and Mortality among 1.46 Million White Adults. N Engl J Med. 2010;363(23):2211–2219. doi:https://doi.org/10.1056/NEJMoa1000367
- Prospective Studies Collaboration. Body-mass index and cause-specific mortality in 900 000 adults: collaborative analyses of 57 prospective studies. Lancet. 2009;373(9669):1083–1096. doi:https://doi.org/10.1016/S0140-6736(09)60318-4
- Calle EE, Rodriguez C, Walker-Thurmond K, Thun MJ. Overweight, obesity, and mortality from cancer in a prospectively studied cohort of U.S. adults. N Engl J Med. 2003;348(17):1625–1638. doi:https://doi.org/10.1056/NEJMoa021423
- Pischon T, Boeing H, Hoffmann K, et al. General and Abdominal Adiposity and Risk of Death in Europe. N Engl J Med. 2008;359(20):2105–2120. doi:https://doi.org/10.1056/NEJMoa0801891
- Global BMI Mortality Collaboration, Di Angelantonio E, Bhupathiraju S, et al. Body-mass index and all-cause mortality: individual-participant-data meta-analysis of 239 prospective studies in four continents. Lancet Lond Engl. 2016;388(10046):776–786. doi:https://doi.org/10.1016/S0140-6736(16)30175-1
- Kokkinos P. Physical Activity, Health Benefits, and Mortality Risk. ISRN Cardiol. 2012;2012. doi:https://doi.org/10.5402/2012/718789
- Lee I-M, Shiroma EJ, Lobelo F, Puska P, Blair SN, Katzmarzyk PT. Impact of Physical Inactivity on the World’s Major Non-Communicable Diseases. Lancet. 2012;380(9838):219–229. doi:https://doi.org/10.1016/S0140-6736(12)61031-9
- National Center for Chronic Disease Prevention and Health Promotion (US) Office on Smoking and Health. Smoking-Attributable Morbidity, Mortality, and Economic Costs. In: The Health Consequences of Smoking - 50 Years of Progress: A Report of the Surgeon General. Centers for Disease Control and Prevention (US); 2014. Accessed August 23, 2017. https://www.ncbi.nlm.nih.gov/books/NBK294316/
- AK-IBIS - Query Result - Alaska’s Behavioral Risk Factors Surveillance System - (BRFSS_C) Query Module - Not Current Smoker. Accessed August 23, 2017. http://ibis.dhss.alaska.gov/query/result/brfss23/brfss_C/XRFSMOKE.html
- Centers for Disease Control and Prevention. Alcohol Related Disease Impact (ARDI) application. Published 2013. Accessed June 10, 2019. www.cdc.gov/ARDI
- Prüss-Üstün A, Wolf J, Corvalán CF, Bos R, Neira MP. Preventing Disease through Healthy Environments: A Global Assessment of the Burden of Disease from Environmental Risks. World Health Organization; 2016. Accessed June 29, 2018. http://apps.who.int/iris/handle/10665/204585
- U.S. Census Bureau. 2011-2015 American Community Survey 5-Year Estimates. Accessed July 10, 2018. https://factfinder.census.gov/faces/tableservices/jsf/pages/productview.xhtml?src=bkmk
- World Health Organization. Guidance and tools. Published 2019. Accessed June 11, 2019. https://www.who.int/sustainable-development/urban/guidance-tools/en/
- Saladi RN, Persaud AN. The causes of skin cancer: a comprehensive review. Drugs Today Barc Spain 1998. 2005;41(1):37–53. doi:https://doi.org/10.1358/dot.2005.41.1.875777
- Koh HK, Geller AC, Miller DR, Grossbart TA, Lew RA. Prevention and early detection strategies for melanoma and skin cancer. Current status. Arch Dermatol. 1996;132(4):436–443.
- Parkin D, Mesher D, Sasieni P. Cancers attributable to solar (ultraviolet) radiation exposure in the UK in 2010. Br J Cancer. 105:S66–S69.
- Britton M. The epidemiology of mesothelioma. Semin Oncol. 2002;29(1):18–25. doi:https://doi.org/10.1053/sonc.2002.30237
- Flegal KM, Kit BK, Orpana H, Graubard BI. Association of all-cause mortality with overweight and obesity using standard body mass index categories: a systematic review and meta-analysis. JAMA. 2013;309(1):71–82. doi:https://doi.org/10.1001/jama.2012.113905
- Manson JE, Bassuk SS, Hu FB, Stampfer MJ, Colditz GA, Willett WC. Estimating The Number of Deaths Due to Obesity: Can The Divergent Findings Be Reconciled? J Womens Health. 2007;16(2):168–176. doi:https://doi.org/10.1089/jwh.2006.0080
- Section of Epidemiology, HIV/STD Program. Alaska Integrated HIV Prevention and Care Plan; 2017-2021. Alaska Division of Public Health; 2016. Accessed November 26, 2018. http://dhss.alaska.gov/dph/Epi/hivstd/Documents/HIVPlan2017.pdf
- Centers for Disease Control and Prevention, National Center for Chronic Disease Prevention and Health Promotion, Division of Population Health. BRFSS Prevalence & Trends Data [online]. Accessed July 30, 2019. https://nccd.cdc.gov/BRFSSPrevalence/rdPage.aspx?rdReport=DPH_BRFSS.ExploreByLocation&rdProcessAction=&SaveFileGenerated=1&irbLocationType=States&islLocation=02&islState=&islCounty=&islClass=CLASS17&islTopic=TOPIC15&islYear=2004&hidLocationType=States&hidLocation=02&hidClass=CLASS17&hidTopic=TOPIC15&hidTopicName=Current+Smoker+Status&hidYear=2004&irbShowFootnotes=Show&rdICL-iclIndicators=_RFSMOK2&iclIndicators_rdExpandedCollapsedHistory=&iclIndicators=_RFSMOK2&hidPreviouslySelectedIndicators=&DashboardColumnCount=2&rdShowElementHistory=&rdScrollX=0&rdScrollY=200&rdRnd=17289
- Roush SW, Murphy TV, Group and the V-PDTW. Historical Comparisons of Morbidity and Mortality for Vaccine-Preventable Diseases in the United States. JAMA. 2007;298(18):2155–2163. doi:https://doi.org/10.1001/jama.298.18.2155