
ABSTRACT
The aim of this study is to detect ventilation corridors in three epochs (1992, 2002 and 2011) by mapping rough urban areas. The roughness parameters calculations are based on a 3D building database obtained from satellite imagery (SPOT) for thee epochs and are conducted accordingly to morphometric methods. Several ventilation paths are clearly recognisable for all three decades and based on the proximity analysis and roughness parameters (by calculating roughness length (z0) and zero-plane displacement height (zd)), we established their extent and analysed the structural and developmental changes. We conducted that changes occurred more rapidly in the second period – almost 90% of the study area was gradually built up, what obstructs the air flow. In addition, winds are blocked in the western part of the city – where the best wind conditions occur. The results urge to re-evaluate the current shape of ventilation corridors and suggest some new areas that should be included in the air ventilation system to improve citizens’ comfort and urban climate.
Introduction
Urban areas are clearly distinguishable from other landscape units and are perceived as one of the roughest surfaces (Suder & Szymanowski, Citation2014). Their aerodynamic properties influence city’s inhabitants immensely and have a huge impact on the city’s development. As Goldberg, Kurbjuhn, and Bernhofer (Citation2013b) argue, urban climate and its properties predispose our comfort of living in cities. Many circumstances determine decreased ability to rest in a city: lack of green areas, high-density living, increased air and noise pollution or urban heat islands (UHIs) (Ng, Citation2006), which in this case is a result of aforementioned factors. The growth of urban areas imposes great pressure on the environment; therefore, proper management of the city and its ecosystem needs to be a part of modern city planning (Markiewicz, Citation2015). Furthermore, since 2014 more than half of the human population lives in urbanised areas (United Nations, Citation2015). Whereas megacities such as Tokyo, Delhi or Shanghai caught much of scientific attention, growth will occur in smaller, but still significant agglomerations as well. Due to the lack of publicity, these areas have less resources to respond to the changes in settlements which is progressing for a couple of years now (United Nations, Citation2007). City’s planners and managers face many difficulties while designing future development areas. They are pressured by the inhabitants and investors to deliver lots of affordable living space to as many people as possible, which quite often take place at the expense of the environment and thus our comfort of living. However, there have been many ideas (Bożętka, Citation2014) to improve a city’s climate, such as the idea of a Garden City (Ebenezer, Citation1984) originating from the nineteenth century, green belts around cities (Drapella-Hermansdorfer, Citation2005) executed, that is, in Berlin and Paris, developing green corridors along streams (like in Seoul) (Mayer, Citation2012) or on conversion areas as well as introducing water bodies (fountains, ponds).
Although few of them were carried out in some cities, they did not mitigate the negative effects of dense, urban structure, that is, UHIs. In many cases, only the combination of few or all aforementioned ones might actually function. One of the ways to aid this fight is detecting areas of low roughness characteristics (which can be designated as ventilation corridors) and secure their extent from further building development. Ideally these areas would have been designated before the settlement developed and continue to facilitate the air flow into the centre as the city grew. This idea actually came up at the beginning of the twentieth century in Warsaw (Tołwiński, Citation1946) and was executed in the 1990s with many obstacles. Unfortunately, they have not been secured well enough, and now their performance is presumably greatly diminished. However, at the time their extent was established, city planners did not have knowledge and possibility to study the roughness characteristics in order to locate ventilation corridors at the areas where natural conditions or proper housing development management favour the air flow. Now, with the help of remote sensing historical data, it is possible to define their location based on the roughness of the city canopy and to observe how they have been built up. Warsaw, although located near few big woodlands and in generally described as having good wind conditions, is suffering from gradually decreasing air quality, lately particularly fast. It is of particular scientific interest, as Warsaw has good wind conditions and is located near few big woodlands and has the biggest river in Poland flowing through the city (natural ventilation corridor) and yet the air quality is gradually decreasing, lately particularly fast (Brendt, Citation2017; Kamiński, Citation2017; Kozlowska, Citation2017; Śmigiel, Citation2017). If other aspects (like UHI) contribute additionally to the city’s climate, the living comfort will deteriorate even further and make living in metropolitan areas even more burdensome. Therefore, all negative determinants should be discussed and explained, and mitigation measures researched to better comprehend the complicated urban ecosystem.
Urban heat islands
One of the biggest negative contributors to city’s climate is UHIs. UHIs are referred to as the spatially averaged difference in temperature between the urban area and its surrounding areas (Rizwan, Dennis, & Chunho, Citation2008). It might be, however, the difference between two different urban areas, or city centre and its suburbs, or simply the whole city and the surrounding rural area. It is determined thus by comparing the mean and the maximum temperature occurring within urban and rural areas. Sometimes the difference between two districts can vary up to 1.5°C (Giridharan, Lau, & Ganesan, Citation2005) or between city centre and outskirts was observed to differ by up to 12°C (Kłysik & Fortuniak, Citation1999). Rizwan et al. (Citation2008) designate controllable and uncontrollable determinants of UHI, which can be then further distinguished into temporary, cyclic and permanent effect variables. Temporary effect variables can be cloud cover or wind speed; permanent effect variables are building material, sky view factor or urban green areas system (urban areas contain less vegetation in comparison to rural areas). The cyclic effect variables are solar radiation (which can heat up the environment directly – albedo or indirectly, by absorbing the heat and emit it slower over time (Touchaei & Akbari, Citation2015)) and other anthropogenic heat sources (Rizwan et al., Citation2008). Those are mainly caused by heat released by cars, air conditioning systems or power plants. Higher roughness of the terrain is also an issue since air flow is impeded. Effects of UHI on the urban climate are: increase in energy use, deterioration of the environment, decreased pedestrian comfort or even rise of mortality rates (Tran, Uchihama, Ochi, & Yasuoka, Citation2006). As mentioned earlier, UHIs have their origin in the described, specific urban conditions. Those can be divided into controllable and uncontrollable factors. Those, which are manageable, are in many instances related to spatial planning and engineering, which therefore can be influenced, shaped and managed by city’s authorities. The uncontrollable factors, on the other hand, are connected to environment and climate, which consequently lie beyond our control. The warmth produced by anthropogenic sources heats up the urban environment directly, while the solar radiation is partially absorbed by the urban surface and heats up the environment indirectly, over a longer period of time (Touchaei & Akbari, Citation2015). It is worth to point out here that even though direct solar heating affects urban and rural surface in the same way, it is the indirect solar heating that is one of the biggest causes of UHI and makes the biggest difference. However, mitigating heat correlated to anthropogenic heat sources is easier, and reducing indirect solar heat is stated to play more important role and to bring more quantifiable results (Kłysik & Fortuniak, Citation1999).
Many studies have been carried out on achieving this goal by actions like design changes by using materials with higher albedo, cooler roofs, off air-conditions, roof spray cooling, photovoltaic canopies and ventilation through vegetation (Yu & Hien, Citation2006). The last example combined with planting more vegetation stood out while reviewing related literature and proved in simulation that it can reduce the cooling demand by 10% (Yu & Hien, Citation2006).
The redevelopment and restoration project of the Cheonggyecheon River in Seoul gave an evidence of improving living comfort and increased wind speed, therefore boosted air exchange, in the city of Seoul, and mitigated UHI was observed there (Mayer, Citation2012).
The Cheonggyecheon River restoration
To understand the needs and causes of the restoration carried out in Seoul, the complicated historical and political background has to be understood. Since 1953, when the Korean peninsula was divided into North and South Korea, the country struggled with the massive environment devastation and deforestation to secure development of agriculture and industry (Temperton et al., Citation2014). Such extensive defoliation over such short period of time created a “push” for many restoration projects aiming at mitigation of biodiversity loss. A fact worth noting: the Seoul metropolitan area (National Capital Area) gathers round 24 million people, is one of the most densely populated areas in the world and is remarkably ethnically homogenous (more than 99% of the population is Korean) (Yu & Hien, Citation2006). This contributed to promotion of extensive conservation and restoration agendas. Over the years, four main objectives have been set (Yu & Hien, Citation2006): reforestation, reconnecting fragmented natural green areas in the Demilitarised Zone, restoring areas of the west coast as well as biodiversity in cities. The Cheonggyecheon River restoration was one of the most outstanding renewal projects in the recent years. The project was prominent, not only due to environmental advantages it brought but also noticeable public–private partnership – it was led by Seoul Metropolitan Government (SMG) and Seoul’s Mayor Lee Myung-bak (who later became the president of South Korea – until 2013). It was accomplished by the partnership between SMG Research Support Group and the Seoul Development Institute and Citizens’ Committee (Mayer, Citation2012).
An almost 6 km part of the river located in the very heart of the city (Yu & Hien, Citation2006) had been polluted and degraded almost to the sewage system in the early twentieth century. The river was prone to flooding due to strong environment degradation, and an idea of covering the stream with concrete first came up round 1920 to be implemented in 1961. Since it has been used as a road, the traffic was increasing subsequently over the years. This led to a need of creating more unobstructed bypasses for vehicles, and in 1971 an elevated expressway (see ) was created (Mayer, Citation2012). It was 16 m wide and ran approximately for 5.8 km and for a time it created a necessary solution to reduce traffic congestion as well as created an attractive place for commercial buildings. Over the years however, safety issues emerged due to the deterioration of the concrete structure of the highway breaching its foundation. The year 1992 brought massive repair works, but even that did not solve the issue – from 1997 on, only small cars were allowed to drive on it (Temperton et al., Citation2014) and maintenance costs escalated enormously. The neighbourhood also lost the advantage – new business centres were moved to the Gangnam district and as a result the population and employment reduced. On the eve of a new century, a new paradigm of urban development was introduced, switching from a growth oriented, economic model, to a sustainable model. The city’s government decided then that rather than repairing the overpass they will restore the river using these circumstances to overcome escalating problems.
Figure 1. Part of the Cheonggyecheon River restoration before and after (source: http://www.globalrestorationnetwork.org/uploads/files/CaseStudyAttachments/123_seoul-1.jpg).
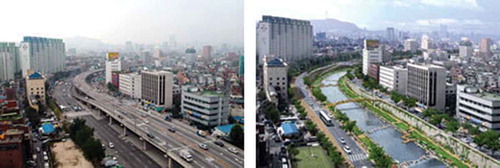
First works started in June 2003 and divided the area into three almost equal parts, each of which was supposed to mirror three concepts: Urban (history connected), Urban + Nature (culture and nature connected) and Nature (Mayer, Citation2012). Those concepts aimed to gradually transform from anthropogenic to a natural landscape, to create a new green corridor – West to East as well as to influence the local climate amplifying it by numerous waterfalls and fountains. It is estimated that approximately 1.14 million tons of waste were generated while demolishing and removing the highway and more than 70% of them were recycled to be used as landfill materials along the stream (Mayer, Citation2012). Although huge concerns about transport management arose while executing the project, the city introduced a new transportation scheme (Mayer, Citation2012), which improved traffic around the Cheonggyecheon area and in the whole metropolitan area. Public transport has also been upgraded – the subway system was enlarged and many bus lines were introduced all over the city. The city also blocked parking in the city centre by special campaigns and new, much higher fees. All of this contributed greatly to the urban sustainability – citizens now have access to almost 6-km-long semi-natural public space, as seen in , cars have almost vanished from the area, noise and air pollution reduced greatly and a number of fish and bird species were successfully reintroduced to the area (Yu & Hien, Citation2006). But what is most important in this case study is the fact that accordingly to many researches, the high city temperature was decreased, both in situ (In-Keun, Citation2006) as well as in the city scale (Hwang, Citation2004), and there was ~50% increase noticed in the wind speed after the restoration in the study area. Wind speed rise influences as well city’s air quality which was observed after introducing the project. What is more, according to Han, Mun, and Huh (Citation2007) the building cooling demand decreased approximately 2.14% (In-Keun, Citation2006) in the neighbourhood.
All in all, the green corridor, which leads directly into the city, reduces the UHI, helps with the air restoration and lowers the building’s cooling demand. The project finished in 2005 and ever since has positively influenced not only city’s climate but also its image. The project was one of the biggest mitigation measures taken in order to decrease the local temperature and aid air flow, and its success is directly connected with lowering the roughness characteristics in urban canopy. The connection between UHIs and roughness parameters will therefore be further discussed in the next section.
UHIs and roughness parameters
As already mentioned, nowadays urban population constitutes to more than a half of the human population. As UHI is present in the temperate zone cities (Baker et al., Citation2002; Kłysik & Fortuniak, Citation1999) as well as in tropical regions (González, Luvall, Rickman, Comarazamy, & Picón, Citation2006; Wong, Nichol, To, & Wang, Citation2010), it can be assumed that a significant part of people living in cities suffers from discomfort caused by UHI. Since air flow and exchange is one of the dependants of UHI formation (Haeger-Eugensson & Holmer, Citation1999; Oke, Citation1982), low wind speeds should be mitigated where possible. These are usually connected to high surface roughness, and as cities are one of the roughest surfaces in comparison to other landscapes, the wind speed decreases there. Thus, the air inflow depth depends on the roughness of the surface (Gál & Unger, Citation2009). Provided, there are areas of significantly low roughness statistics (parameters); they are more or less connected to each other and supply clean and cooled air from the suburbs; we can name them air exchange and restoration system. If they also penetrate the inner city with the country breeze, and therefore decrease urban–rural contrast of the temperature, they are called then ventilation corridors (Gál & Unger, Citation2009). These are characterised with many aerodynamic features and roughness parameters, best described by their geometry and surface (Davenport, Sue, Grimmond, Tim, & Wiering, Citation2000; Gál & Unger, Citation2009). Roughness parameters illustrate how efficiently wind travels above specified land cover. One of the most crucial and commonly used parameters are z0 (roughness length) and zd (zero plane displacement height) (Davenport et al., Citation2000; Gál & Unger, Citation2009; Grimmond & Oke, Citation1999; Suder & Szymanowski, Citation2014). Zero plane displacement height is a height at which wind speed decreases to zero due to obstacles in its way. Roughness length affects the magnitude of turbulence and the fluxes of varies quantities above the investigated cover; it depends on the frontal area index (Grimmond & Oke, Citation1999). Some other roughness parameters partially required to calculate z0 and zd are plan area ratio (λp) and frontal area ratio (λF).
If roughness parameters for the whole urban areas are calculated and assessed, the potential ventilation corridors might be found. As literature shows (Gál and Unger Citation2009; Matzarakis & Mayer, Citation1992, Citation1994; Suder and Szymanowski Citation2014; Wong et al. Citation2010), there are many requirements, which have to be met in order to qualify given area as possible ventilation-aiding. Matzarakis and Mayer (Citation1992) and Gál and Unger (Citation2009) set a number of criteria in order to characterise ventilation corridors, and these are:
z0 lower than 0.5 m;
zd should be negligible (according to Gál and Unger (Citation2009) this requirement is fulfilled if it is lower than 3 m);
length in one direction of at least 1 km;
sufficient width (which is relevant to the height of the obstacle), but not less than 50 m;
smooth corridor edges;
width of the obstacles might not exceed 1/10 of the corridor length;
obstacle height lower than 10 m; and
orientation of the obstacles longest front parallel to the corridor direction
The overall purpose of this research is to implement roughness mapping of the urban area (Warsaw) in order to locate the ventilation corridors in three different epochs – 1992 – 2002 – 2011, delineate their extend, detect the change, if one occurred and study the magnitude of it. The approach is based on morphometric methods to calculate the aerodynamical properties of Warsaw aided by remotely sensed data.
Roughness parameters determination
There are many possible ways to derive roughness parameters, like roughness length and zero-plane displacement, but most commonly (Grimmond Citation1998; Grimmond and Oke Citation1999; Davenport et al. Citation2000) three methods are used:
morphometric (or geometric) approach using morphometry parameters (like frontal area ratio);
micrometeorological (or anemometric) methods using in situ observations of wind and turbulence; and
roughness classification methods to asses roughness already measured in similar terrain.
Morphometric methods are based on surface morphology parameters. There are some approaches which use averaged parameters, like mean height or mean density (Counihan (Citation1975); Bottema (Citation1997)) or more detailed ones, which include the calculation of the frontal area ratio for each building group (Lettau (Citation1969); Macdonald, Griffiths, and Hall (Citation1998)).
The micrometeorological approach uses field observations from many stations distributed on the tall buildings (or towers) across the city and measures wind and turbulence to derive aerodynamical properties of the surface from the logarithmic wind profile (Grimmond & Oke, Citation1999). Although it delivers the most detailed data, it is prone to errors (Gál & Unger, Citation2009) and requires many stations to cover the whole city. This might create logistic problems (to allocate sensors on private buildings) and is expensive.
Roughness classification method uses previously derived classes for different land cover (Davenport et al., Citation2000) and human interpretation of imagery or maps to establish the extent of a given class. However, Davenport et al. distinguished only two classes for the urban canopy; therefore, it is considered not suitable for complex urban environments.
The most commonly used methods are morphometric methods, and they found their use in deriving ventilation corridors in many cities. Bottema and Mestayer (Citation1998) discussed this method in an almost 6 km2 urban environment (Strasbourg) assessing average roughness in pixels varying from 50 to 450 m. Ratti, Di Sabatino, and Britter (Citation2006) derived different roughness parameters using digital elevation models (in London, Toulouse and Berlin); however the investigated areas were rather small (400 m × 400 m). Wong et al. (Citation2010) used a grid-based approach of roughness mapping (Hong Kong), deriving z0 and zd from frontal area index computation and averaging it to the 100-m grid cell and deriving ventilation corridors by least cost path analysis. Gál and Unger (Citation2009) (Szeged) and Suder and Szymanowski (Citation2014) (Wroclaw) used an approach based on grouping buildings in building blocks and deriving lot areas – the computation is much more expensive, but it derives a more detailed output. It delivers roughness length and zero-plane displacement height values almost to the single building level. All these methods use cadastral data or airborne laser scanning data (light detection and ranging (LiDAR)) to derive building outlines and heights, which are then needed to perform roughness mapping calculation. We propose an expanded approach based on satellite imagery (Satellite Pour l'Observation de la Terre (SPOT)) and cadastral data (building database 2011) to derive building outlines for three decades (needed to perform roughness mapping calculations) in order to determine the ventilation paths and trace changes that occurred within them. This approach helps in identifying negative changes in development and the areas which may still contribute to the air exchange system and should be protected.
Study area
The area of study covers the administrative boundaries of Warsaw (52° 13′ N, 21° 2′ O), which is approx. 517 km2. It is located in east-central Poland, on the Masovian Plain with an average elevation of 100 m above sea level (Uchwała Rady m. st. Warszawy nr XCII/2689/Citation2010 z dnia 7 października 2010 r. – Studium uwarunkowań i kierunków zagospodarowania przestrzennego m.st. Warszawy ze zmianami, 2010). The altitude ranges from 75.6 to 122.1 m. The biggest river in Poland, Vistula, runs through Warsaw and thus divides the city into two parts, left and right bank. Due to the Vistula Rivers’ different terraces, Warsaw’s Escarpment emerged over the centuries, making it the biggest relief significance within Warsaw varying from 25 to 10 m (Uchwała Rady m. st. Warszawy nr XCII/2689/Citation2010 z dnia 7 października 2010 r. – Studium uwarunkowań i kierunków zagospodarowania przestrzennego m.st. Warszawy ze zmianami, 2010). As of 31 November 2015, Warsaw had almost 1,775,000 inhabitants (Central Statistical Office, Citation2016) which gives mean density of 3337 inh./km2. It is the capital of Poland and at the same time the biggest city in Poland. It is ranked the ninth largest city in EU, and together with the metropolitan area, more than 3 million people live and work there (Uchwała Rady m. st. Warszawy nr XCII/2689/Citation2010 z dnia 7 października 2010 r. – Studium uwarunkowań i kierunków zagospodarowania przestrzennego m.st. Warszawy ze zmianami, 2010).
The climate conditions of Warsaw are determined by its location in the transitional humid continental zone (Peel, Finlayson, & McMahon, Citation2007). Meteorological conditions in Warsaw show among others: average annual rainfall in the range of 500 mm, the mean annual air temperature of 7.7–9.3°C, the prevailing wind direction from west sector (25%) and north-west (11%) (Opracowanie Ekofizjograficzne do SUKiZ M.St. Warszawy, Citation2006). Features of the local climate in Warsaw are spatially varied and modified by the city’s’ internal structure. Thermal conditions are shaped by the microclimate factors. The decisive role is played by the amount of sunshine and the structure of the buildings, the green areas, water surface, and air pollution, including emissions of heat. The two most common types of land use include built up (housing, services, industrial, transportation) and green areas (green, water, agricultural) – respectively 50% and 42% (Uchwała Rady m. st. Warszawy nr XCII/2689/Citation2010 z dnia 7 października 2010 r. – Studium uwarunkowań i kierunków zagospodarowania przestrzennego m.st. Warszawy ze zmianami, 2010). A characteristic phenomenon observed in the central part of Warsaw (approx. 1/3 of the city) is the Warsaw heat island. This is the area with the highest intensity of heat emission, characterised by elevated temperatures (min. approx. 0.9°C, max. approx. 9°C) (Opracowanie Ekofizjograficzne do SUKiZ M.St. Warszawy, Urząd Miasta Stołecznego Warszawy, Citation2006) relative to the surrounding areas. The phenomenon is caused by the high heat emission to the atmosphere in the areas of compact and intensive development and the concentration of air pollutants in the central Warsaw area. Between December and March, the Warsaw heat island occurs constantly as a result of thermal effects and the development of artificial heat emissions (Opracowanie Ekofizjograficzne do SUKiZ M.St. Warszawy, Urząd Miasta Stołecznego Warszawy, Citation2006). In summer, the phenomenon is most noticeable in the evening and at night, when the heat absorbed during the day is emitted by buildings and artificial surfaces. The most adverse thermal conditions exist when the wind speed is less than 2 m/s. (Opracowanie Ekofizjograficzne do SUKiZ M.St. Warszawy, Urząd Miasta Stołecznego Warszawy, Citation2006).
The efficiency of air exchange in Warsaw depends on many factors: the arrangement of the wind corridors in relation to the prevailing wind direction, topography, the street network, as well as roughness parameters – vegetation cover, the degree of compactness of green- and built up areas and the height of buildings. An unfavourable phenomenon is observed primarily in the central districts – it is a strong slowdown (40%) of wind speed (in comparison to the suburb areas) resulting from the urban layout and its topography (Opracowanie Ekofizjograficzne do SUKiZ M.St. Warszawy, Urząd Miasta Stołecznego Warszawy, Citation2006). With such disadvantageous phenomena, Warsaw’s ventilation corridors should be delineated in order to protect and preserve air exchange and restoration system. As mentioned earlier, the recent air pollution levels have greatly exceeded the average and will continue to do so, unless firm policies are adhered to mitigate its sources. This research, studying the temporal changes in roughness parameters, might provide insight into misguided decisions in the past, which led to obstructed and decreased air flow throughout the city.
Data
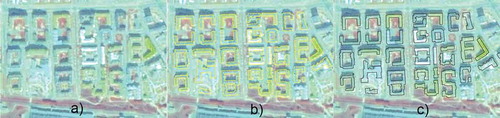
According to Gál and Unger (Citation2009), a georeferenced building database, with at least attributes of height or storey count, is essential to perform the roughness mapping. The spatial cadastral database for the whole city was acquired from the city council with the topicality of March 2011. Attributes pointed out the number of storeys, function, district or topicality. The presented approach assumed detecting the ventilation paths through temporal analysis in order to define their extent and establish the pace of changes within them. Unfortunately, the cadastral database was not available for the past decades. Therefore, historical high resolution satellite imagery (SPOT) was acquired for 10 September 1992 (SPOT 2 10 m resolution, pansharpened), 12 September 2002 and 26 August 2011 (both SPOT 5 2.5 m resolution, pansharpened) as base data. In addition, for some part of the central district Śródmieście, ALS data (2012, 12 p/m2) was acquired to evaluate main parameters (building footprint and height). As future ALS-campaigns are planned, the temporal analysis of changes with direct access to the building canopy layer will be much easier. The most up-to-date building footprints extraction is based on very high resolution optical satellite imagery aided by LiDAR data (Wurm, Taubenbock, Roth, & Dech, Citation2009). Here, however, the challenge was to derive reliable information from the high spatial resolution (2.5–10 m) multispectral imagery acquired from SPOT satellites. As vegetation might have proven to reduce the quality of deriving the building outlines, the vegetation was masked out by utilising the Normalised Differenced Vegetation Index in a pre-processing step. As mentioned earlier, the baseline for building information was a 2011 building footprint database. A subset of that building database was used as training input data for a support vector machine classification. The resulting outlines were subsequently simplified and all remaining artefacts erased (see example in ). The image processing resulted in three building databases for 1992, 2002 and 2011, respectively consisting of 114,828, 123,368 and 153,595 objects. These data were then manually refined and corrected in order to gain a realistic data set for each epoch. In order to derive the height attribute, we used the existing database for 2011. It was then assumed that existing buildings in 2011, if proven to be built already in 1992, preserved their height. For any buildings that were not discovered in database in 2011, manual analysis of the neighbourhood as well as shadow length (Cheng & Thiel, Citation1995) was performed in order to establish building heights. Naturally, the biggest challenge was to extract the outlines out of the SPOT imagery from 1992 – the pansharpened image had the resolution of 10 m, which made it particularly difficult with some smaller dwellings, that is, (semi-)detached houses or villas. Therefore, creating a building database for 1992 was the longest and most laborious part, as many buildings had to be added manually.
Figure 2. Building database creation steps: (a) SPOT 5 image from 2002, false composition; (b) derived buildings outlines; and (c) buildings’ footprints after artefact removal and edge smoothing.
Methods
In order to calculate roughness length and zero-plane displacement height, several approaches have been investigated. Bottema and Mestayer (Citation1998) suggest deriving roughness length according to
where CDh is the drag coefficient (constant of a value 0.8) (Bottema, Citation1997; Bottema & Mestayer, Citation1998), κ is von Karman’s constant (0.4) (Counihan (Citation1975); Bottema (Citation1997); Macdonald et al. (Citation1998)) and λF is a frontal area ratio for a grid cell, or an allotment/any corresponding lot as seen in , which is calculated according to
Figure 3. Lot and building statistics required for roughness parameters calculation.
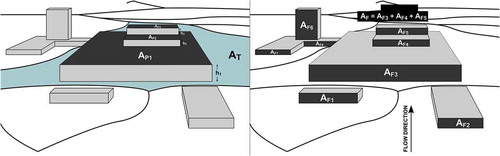
where AF represents frontal area and AT – lot area.
They have, however, designed the formula for the regular building groups, which is rarely seen in the urban canopy. According to Bottema and Mestayer (Citation1998), some neglections and approximations apply here, and the formula may be written into simpler form:
In order to calculate roughness length, the zero-plane displacement height must be derived. Bottema and Mestayer (Citation1998) described the method and approach and suggested
where λP is the plan-area ratio, derived from
where AP represents plan area and AT represents lot area.
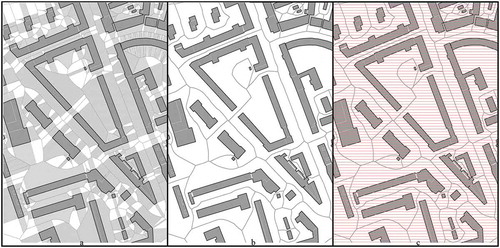
In order to determine the lot area, several approaches have been investigated. Burian, Brown, and Linger (Citation2002) referred to the lot area as a 100-m land use grid defined with help of the street network. Wong et al. (Citation2010) defined it as 100-m rectangular grid with an extent of the city. They argued that the polygon-based approach presented by Gál and Unger (Citation2009) was not suitable for the whole city. However, Gál and Unger (Citation2009) and Suder and Szymanowski (Citation2014) divided the whole study area into polygons, where each polygon represented the area on which adjacent buildings were located. This approach was adopted in the study and derived voronoi polygons (as seen in ), where the adjacent buildings were treated as centroids for the polygons. Therefore, each polygon consists of set of vertices, which are closer to the central, adjacent buildings, than to the others. With this concept, calculations are much more detailed, and there is no risk that the lot borders cut through the building, or the building is bigger than the lot area.
Figure 4. Development process of lot areas: (a) derived voronoi polygons; (b) computed lot areas; and (c) lot areas with overlaid parallel lines.
describes the process of roughness calculation in three decades in the study area. First, based on the number of storeys, the building height attribute was retrieved. Then, adjacent buildings were aggregated and based on the resulting voronoi polygons (lot areas) were created. That step reduced the complexity significantly and therefore makes the calculations more feasible. It was a key part for the whole process, as the roughness mapping is attributed to these.
Figure 5. Ventilation corridors calculation.
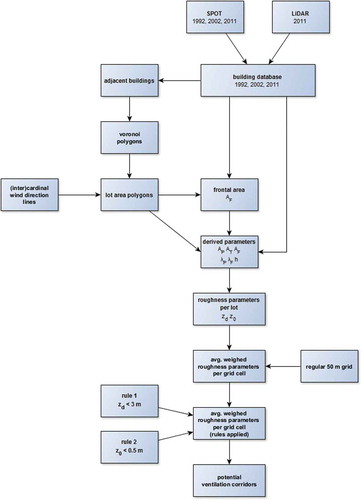
Depending on the wind direction, the frontal area of the building varies; therefore, the obstruction force varies as well. The same building might be blocking much more air in the south-west direction than in east direction. Thus, the calculation of roughness length and displacement height was carried out for all the (inter)cardinal directions. In order to achieve that, the front length of each merged buildings facing given direction needs to be calculated (as seen in). This step was realised by creating parallel lines in an interval of 5 m in each (inter)cardinal direction. The interval was established on a compromise between accuracy (maximal error of 5 m per facade) and computing time. For each line within one lot area the tallest building was found and added to the facade-width calculation. Based on that, the roughness parameters were calculated (Eq. (3) and (4)) for each lot area. Ratti et al. (Citation2006) suggest computing roughness parameters for each direction and then averaging them. However, taking the prevailing winds in Warsaw into account, each direction was weighted (Opracowanie Ekofizjograficzne do SUKiZ M.St. Warszawy, Urząd Miasta Stołecznego Warszawy, Citation2006).
Results
Spatial variability of roughness length and displacement height
As a result of the roughness parameters, mapping calculation, roughness length and displacement height for each lot area were obtained for three decades. In order to locate potential ventilation paths, the aforementioned (see Methods) requirements were applied:
roughness length lower than 0.5 m;
displacement height is negligible;
at least 1 km in length; and
at least 50 m width.
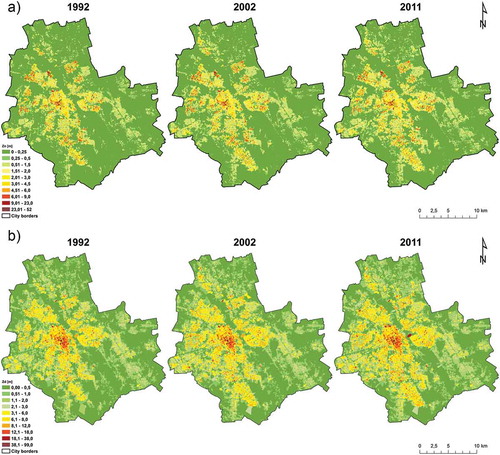
Literature research has shown that the zd value is negligible, when the value is lower than 3 m (Gál & Unger, Citation2009) and to fulfil the last requirement, (d), a 50-m grid was applied on the study area. Each grid was given an averaged and weighted (by area share) value of both roughness parameters if more than one lot area lied within one grid cell. As a result, three data sets (one for each decade) were obtained presenting different roughness parameters values. According to Opracowanie Ekofizjograficzne do SUKiZ M.St. Warszawy, Urząd Miasta Stołecznego Warszawy (Citation2006), there are several prevailing winds in Warsaw – the most common, 24.7% share in wind flow have western winds. A large share, also, have north-western winds (10.7%) during the warm seasons, and south-west (10.5%) in the cold season. Spring and autumn are dominated by eastern (12.8%) and south-eastern winds (13.9%), respectively. The smallest shares have northern (7.2%) and north-eastern (5.9%) winds. The Kampinos Forest and the Nieporecka Valley located in the north-east and north-west of Warsaw supply the city with air of the highest quality. Due to smaller air circulation (high vegetation) the latter plays a smaller role in the air exchange. This information was used to weigh the zd and z0 values accordingly for each (inter)cardinal wind direction, and three databases with weighted roughness parameters were obtained, as seen in .
Figure 6. Roughness parameters spatial distribution in three epochs in Warsaw. Here: (a) roughness length (z0) and (b) displacement height (zd).
Potential ventilation corridors
Several ventilation paths were clearly recognisable at the first sight for all three decades. Based on the proximity analysis and roughness parameters, several corridors were delineated, as seen in .
Figure 7. Potential ventilation corridors in three epochs.
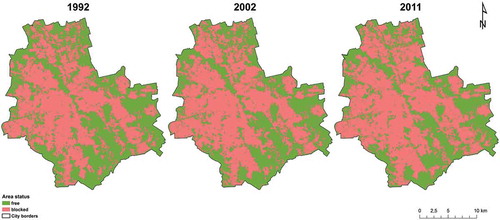
The natural ventilation path of the Vistula River is mostly unobstructed along its 28-km stretch within Warsaw’s city boundaries. The eastern corridor (partially covering areas of the eastern railway infrastructure) has a length of ca. 13 and 8 km, two southern corridors (parallel to the Vistula valley) with lengths, respectively, 9 and 10 km – all mostly unobstructed. South-western corridor with 11 km (but the continuity of the corridor is not preserved), very obstructed western corridor (6.2 km), north-west corridor of unobstructed length of 3.5 km (discontinued ca. 7 km) and two north-east corridors of 8 and 12 km length are all interrupted and their continuity is broken.
The spatial distribution of ventilation paths shows some correlation between the type of housing (CBD district vs suburban housing) and road density. Although the biggest shares in wind flow have western winds, the biggest areas with good ventilation qualities are located mostly on north–south axis. The biggest feature here is, of course, the Vistula River, but partially also Warsaw’s escarpment (southern part) as well as some major, wide transportation areas. The good ventilation potential is also quite visible at the edge of the city, where the suburban area starts; these areas still possess good ventilation properties and have a chance to aid circulation into the centre. The denser the buildings and the roads are, the higher the pollution level is and the worse air circulation is. The two southern corridors aiding Vistula corridors, although having great potential, show vast changes over almost 20 years. After the political change in Poland, in the early 1990s, and due to chaos in the spatial planning system (Opracowanie Ekofizjograficzne do SUKiZ M.St. Warszawy, Urząd Miasta Stołecznego Warszawy, Citation2006), many rural and/or green areas in Warsaw have been bought by private developers and built up, without taking many previous plans and assumptions into consideration. It is visible in many areas across the city, where rapid changes have occurred, damaging and obscuring the air exchange and regeneration system. What is more, the western part of the city, where the best wind conditions occur, is almost entirely blocked by dense development. The small and severely obstructed corridor is barely recognisable and is being gradually built up.
A detailed analysis of changes between the three epochs has shown disturbing changes. Not only the overall intensity was discovered throughout the city (see ), but also within the corridors themselves. As roughness length incorporates displacement height, changes between epochs were analysed only using the z0 value. Changes within first decade were rather moderate and constituted to 42% of whole city’s area. The most rapid changes at that time occurred in southern and south-western city districts like Ursynów, Włochy and Ursus, but also in northern parts, like Bemowo or Białołęka. However, as shows, the greatest area share has changed in the lowest group – more than 82% all development changed just up to 0.085 m.
Table 1. Share of changes between epochs in each class.
Figure 8. Roughness length difference between three epochs.
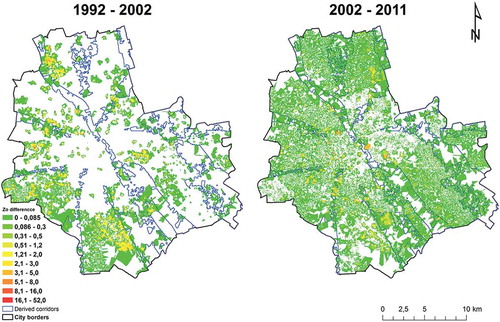
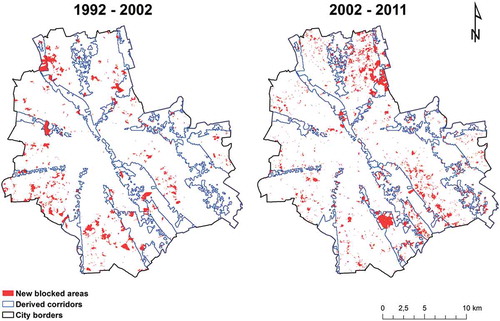
Nevertheless, some disturbing intensification can already be seen in the potential ventilation corridors – south-western, western and north-western. Particularly large and intense changes were observed in north-western corridor, where it reached more than 2 m in roughness length. These changes occurred due to the political shift after 1989 in Poland and have strongly influenced the real estate market (Królikowski & Ostrowski, Citation2009). This resulted in many private investors and developers taking advantage of the disordered planning law and building new housing estates, often not according to the regulations. The planning law was changed first in 2003, but it has not stopped the rapid development. In the second epoch, the changes occurred on over 87% of Warsaw’s area (in comparison to 2002). Despite the new planning bill and the comprehension study of Warsaw (Uchwała Rady m. st. Warszawy nr XCII/2689/Citation2010 z dnia 7 października 2010 r. – Studium uwarunkowań i kierunków zagospodarowania przestrzennego m.st. Warszawy ze zmianami, 2010), which was published 2006 and is an act of law, changes were proceeding rapidly. However, again, the biggest area-wise change occurred in the first class – over 87% of all changes increased the roughness length just by 0.085 m. But from our further analysis, it proved to be enough in some cases to increase both roughness parameters and block a given area from contributing to the air regeneration system, as shown in . It is clearly visible how new housing estates immensely obstructed airflow in one of the southern and north-eastern corridors. This has severely damaged air regeneration and exchange system, as these two corridors almost reached the city centre.
Figure 9. Newly blocked areas in comparison to 1992 and 2002.
Summary and conclusions
Through roughness parameters mapping aerodynamic properties of Warsaw could be calculated without the necessity of field campaigns. Investigating the height and shape of buildings in Warsaw, the spatial distribution of two most important roughness parameters was derived and therefore to locating the potential ventilation corridors. The approach presented by Gál and Unger (Citation2009) was adapted and extended to the temporal analysis. As historical cadastral databases are not available for Warsaw, ventilation corridors extents derived from historical data satellite imagery were established and the change, over the course of almost 20 years, was investigated. The continuous earth observation programmes enabled this study to research and focus on roughness characteristic changes that occurred and hopefully will lead to the better planning policies.
In Warsaw, the biggest city in Poland, the ventilation and air exchange system is of particular meaning, as it is a place to live and work for many people. Ventilation corridors play a crucial role in increasing the thermal comfort of inhabitants (Goldberg, Kurbjuhn, & Bernhofer, Citation2013a), by mitigation of the UHI and pollutants disperse.
The case study of the Cheonggyecheon River in Seoul has shown, unambiguously, that preservation and restoration of green areas lead to a better thermal conditions (Mayer, Citation2012). As Warsaw suffers from UHI, continuous transgression of air quality standards and a gradually decreasing share of green areas, this research focused on the changes that occurred from 1992 to 2011 that led to this state. This study pointed out exact places, where the continuity of air flow has been obstructed (western and north-western part where wind conditions are particularly favourable), which directly contributed to lowering the air quality. Based on the results, areas were pointed out, where the city council could consider alterations to the current land use and restore areas crucial to the circulation and exchange system. Not only would such renovation have influenced the thermal characteristics of the city but also improved comfort of living in Warsaw.
In future works, we would like to focus our efforts on investigating the influence of high vegetation in the circulation system, as it strongly influences the roughness parameters but does not entirely block the air flow and, at the same time, cleans and cools down the air. What is more, we would like to investigate other roughness parameters and methods to delineate potential ventilation corridors in order to find the easiest and least cost-expensive one. With such results, that approach could be transferred to other cities, ensuring and preserving proper ventilation, as many cities worldwide (i.e. Hong Kong, Paris, Stuttgart) suffer from the bad air quality and stagnation.
Disclosure statement
No potential conflict of interest was reported by the authors.
References
- Baker, L.A., Brazel, A.J., Selover, N., Martin, C., McIntyre, N., Steiner, F.R., … Musacchio, L. (2002). Urbanization and warming of Phoenix (Arizona, USA): Impacts, feedbacks and mitigation. Urban Ecosystems, 6(3), 254–267. doi:10.1023/A:1026101528700
- Bottema, M. (1997). Urban roughness modelling in relation to pollutant dispersion. Atmospheric Environment, 31(18), 3059–3075. doi:10.1016/S1352-2310(97)00117-9
- Bottema, M., & Mestayer, P.G. (1998). Urban roughness mapping–validation techniques and some first results. Journal of Wind Engineering and Industrial Aerodynamics, 74-76, 163–173. doi:10.1016/S0167-6105(98)00014-2
- Bożętka, B. (2014). Systemy zieleni miejskiej w Polsce‐ewolucja i problemy kształtowania. Problemy Ekologii Krajobrazu, 22(22). Retrieved from http://paek.ukw.edu.pl/pek/index.php/PEK/article/view/2661
- Brendt, J. (2017, January 14). Warsaw Grapples with Gloomy, Gray Smog. New York Times. Retrieved from https://www.nytimes.com/2017/01/14/world/europe/warsaw-air-pollution-smog.html?_r=0
- Burian, S.J., Brown, M.J., & Linger, S.P. (2002). Morphological analysis using 3D building databases: Los Angeles, California. Los Almos. Retrieved from Los Alamos National Laboratory website: https://www.researchgate.net/profile/Michael_Brown44/publication/260286741_Morphological_analyses_using_3D_building_databases_Los_Angeles_California/links/0046353083a2aef1ef000000.pdf.
- Central Statistical Office (GUS). (2016). Wyniki badań bieżących - liczba i struktura ludności. Retrieved from http://demografia.stat.gov.pl/bazademografia/Tables.aspx
- Cheng, F., & Thiel, K.-H. (1995). Delimiting the building heights in a city from the shadow in a panchromatic SPOT-image—Part 1. Test of forty-two buildings. Remote Sensing, 16(3), 409–415.
- Counihan, J. (1975). Adiabatic atmospheric boundary layers: A review and analysis of data from the period 1880–1972. Atmospheric Environment (1967), 9(10), 871–905. doi:10.1016/0004-6981(75)90088-8
- Davenport, A., Sue, C., Grimmond, B., Tim, O., & Wiering, J. (2000). Estimating the roughness of cities and sheltered country.
- Drapella-Hermansdorfer, A. (2005). Zielone osie i zielone pierścienie Berlina. Teka Komisji Architektury, Urbanistyki i Studiów Krajobrazowych, 1, 76–82.
- Ebenezer, H. (1984). Garden cities of tomorrow. Cambridge, Mass: MIT Press.
- Gál, T., & Unger, J. (2009). Detection of ventilation paths using high-resolution roughness parameter mapping in a large urban area. Building and Environment, 44(1), 198–206. doi:10.1016/j.buildenv.2008.02.008
- Giridharan, R., Lau, S.S., & Ganesan, S. (2005). Nocturnal heat island effect in urban residential developments of Hong Kong. Energy and Buildings, 37(9), 964–971. doi:10.1016/j.enbuild.2004.12.005
- Goldberg, V., Kurbjuhn, C., & Bernhofer, C. (2013a). How relevant is urban planning for the thermal comfort of pedestrians? Numerical case studies in two districts of the City of Dresden (Saxony/Germany). Meteorologische Zeitschrift, 22(6), 739–751. doi:10.1127/0941-2948/2013/0463
- Goldberg, V., Kurbjuhn, C., & Bernhofer, C. (2013b). How relevant is urban planning for the thermal comfort of pedestrians? Numerical case studies in two districts of the City of Dresden (Saxony/Germany). Meteorologische Zeitschrift, 22(6), 739–751. doi:10.1127/0941-2948/2013/0463
- González, J.E., Luvall, J.C., Rickman, D.L., Comarazamy, D., & Picón, A.J. (2006). Urban heat island identification and climatological analysis in a coastal, tropical city: San Juan, Puerto Rico. In Urban Remote Sensing (pp. 223–252). Boca Raton, FL: CRC Press.
- Grimmond, C.S. (1998). Aerodynamic roughness of urban areas derived from wind observations. Boundary-Layer Meteorology, 89(1), 1–24. doi:10.1023/A:1001525622213
- Grimmond, C.S., & Oke, T.R. (1999). Aerodynamic properties of urban areas derived from analysis of surface form. Journal of Applied Meteorology, 38(9), 1262–1292. doi:10.1175/1520-0450(1999)038<1262:APOUAD>2.0.CO;2
- Haeger-Eugensson, M., & Holmer, B. (1999). Advection caused by the urban heat island circulation as a regulating factor on the nocturnal urban heat island. International Journal of Climatology, 19(9), 975–988. doi:10.1002/(ISSN)1097-0088
- Han, S.-G., Mun, S.-H., & Huh, J.-H. (2007). Changes of the micro-climate and building cooling load due to the green effect of a restored stream in Seoul, Korea. In International Building Performance Simulation Association Conference and Exhibition (Vol. 10). Retrieved from http://www.ibpsa.org/proceedings/BS2007/p573_final.pdf
- Hwang, K.Y. (2004). Restoring Cheonggyecheon stream inthe downtown Seoul. Seoul: Seoul Development Institute, 3, 1–8.
- In-Keun, L. (2006). Cheong Gye Cheon Restoration Project. Retrieved from http://www.irbnet.de/daten/iconda/CIB7972.pdf
- Kamiński, S. (2017, January 28). Znowu wielki smog w Warszawie. Normy przekroczone nawet trzykrotnie. Gazeta Wyborcza. Retrieved from http://warszawa.wyborcza.pl/warszawa/7,54420,21303397,znowu-wielki-smog-w-warszawie-normy-przekroczone-nawet-trzykrotnie.html
- Kłysik, K., & Fortuniak, K. (1999). Temporal and spatial characteristics of the urban heat island of Łódź, Poland. Atmospheric Environment, 33, 3885–3895. Retrieved from http://www.sciencedirect.com/science/article/pii/S1352231099001314. Doi:10.1016/S1352-2310(99)00131-4
- Kozlowska, H. (2017, January 11). When it comes to air pollution, Poland is the China of Europe. QUARTZ. Retrieved from https://qz.com/882158/with-air-pollution-skyrocketing-warsaw-is-severely-hit-by-polands-smog-problem/
- Królikowski, L., & Ostrowski, M. (2009). Rozwój przestrzenny Warszawy: Mazowieckie Centrum Kultury i Sztuki.
- Lettau, H. (1969). Note on aerodynamic roughness-parameter estimation on the basis of roughness-element description. Journal of Applied Meteorology, 8(5), 828–832. doi:10.1175/1520-0450(1969)008<0828:NOARPE>2.0.CO;2
- Macdonald, R.W., Griffiths, R.F., & Hall, D.J. (1998). An improved method for the estimation of surface roughness of obstacle arrays. Atmospheric Environment, 32(11), 1857–1864. doi:10.1016/S1352-2310(97)00403-2
- Markiewicz, M. (2015). Determining Frankfurt’s suitability potential for the OnTop concept. Earsel Eproceedings, 13(S1), 106–112. Retrieved from http://eproceedings.org/static/vol13_S1/13_S1_markiewicz1.pdf
- Matzarakis, A., & Mayer, H. (1992). Mapping of urban air paths for planning in Munich. Wiss. Ber. Inst. Meteor. Klimaforsch. Univ. Karlsruhe, 16, 13–22.
- Mayer, H., Beckröge, W., & Matzarakis, A. (1994). Bestimmung von stadtklimarelevanten Luftleitbahnen. UVP-report, 5(94), 265–268. Retrieved from www.researchgate.net/publication/233758609_Bestimmung_von_stadtklimarelevanten_Luftleitbahnen/file/d912f50b48bf562309.pdf
- Mayer, N. (2012). The Cheonggyecheon River Restoration Project. Seoul, South Korea. Retrieved from https://sustainabilitywriter.wordpress.com/2012/07/04/the-cheonggyecheon-river-restoration-project-seoul-south-korea/ .
- Ng, E. (2006). Air ventilation assessment system for high density planning and design. In Proceedings of PLEA International Conference. Retrieved from http://plea-arch.org/ARCHIVE/2006/Vol1/PLEA2006_PAPER642.pdf
- Oke, T.R. (1982). The energetic basis of the urban heat island. Quarterly Journal of the Royal Meteorological Society, 108(455), 1–24.
- Opracowanie Ekofizjograficzne do SUKiZ M.St. Warszawy, Urząd Miasta Stołecznego Warszawy 2006.
- Peel, M.C., Finlayson, B.L., & McMahon, T.A. (2007). Updated world map of the Köppen-Geiger climate classification. Hydrology and Earth System Sciences Discussions, 4(2), 439–473. doi:10.5194/hessd-4-439-2007
- Ratti, C., Di Sabatino, S., & Britter, R. (2006). Urban texture analysis with image processing techniques: Winds and dispersion. Theoretical and Applied Climatology, 84(1–3), 77–90. doi:10.1007/s00704-005-0146-z
- Rizwan, A.M., Dennis, L.Y.C., & Chunho, L.I. (2008). A review on the generation, determination and mitigation of Urban heat island. Journal of Environmental Sciences, 20(1), 120–128. doi:10.1016/S1001-0742(08)60019-4
- Śmigiel, M. (2017, February 3). Smog w Warszawie. Stężenie pyłów rośnie. Będzie darmowa komunikacja? Gazeta Wyborcza. Retrieved from http://warszawa.wyborcza.pl/warszawa/7,54420,21329940,smog-w-warszawie-stezenie-pylow-rosnie-bedzie-darmowa-komunikacja.html
- Suder, A., & Szymanowski, M. (2014). Determination of ventilation channels in urban area: A case study of Wrocław (Poland). Pure and Applied Geophysics, 171(6), 965–975. doi:10.1007/s00024-013-0659-9
- Temperton, V.M., Higgs, E., Choi, Y.D., Allen, E., Lamb, D., Lee, C., … Zedler, J.B. (2014). Flexible and adaptable restoration: An example from South Korea. Restoration Ecology, 22(3), 271–278. doi:10.1111/rec.12095
- Tołwiński, T. (1946). Wstępna opinia o szkicowym planie Warszawy, wykonanym przez B.O.S. Warsaw: Studia Warszawskie.
- Touchaei, A.G., & Akbari, H. (2015). Evaluation of the seasonal effect of increasing albedo on urban climate and energy consumption of buildings in Montreal. Urban Climate, 14, 278–289. doi:10.1016/j.uclim.2015.09.007
- Tran, H., Uchihama, D., Ochi, S., & Yasuoka, Y. (2006). Assessment with satellite data of the urban heat island effects in Asian mega cities. International Journal of Applied Earth Observation and Geoinformation, 8(1), 34–48. doi:10.1016/j.jag.2005.05.003
- Uchwała Rady m. st. Warszawy nr XCII/2689/2010 z dnia 7 października 2010 r. - Studium uwarunkowań i kierunków zagospodarowania przestrzennego m.st. Warszawy ze zmianami, Rada m.st. Warszawy 07.10.2010.
- United Nations (2007). Urbanization: A majority in cities. Population Fund. Retrieved from https://www.unfpa.org/pds/urbanization.htm
- United Nations. (2015). World urbanization prospects: The 2014 revision. New York: United Nations Department of Economics and Social Affairs, Population Division.
- Wong, M.S., Nichol, J.E., To, P.H., & Wang, J. (2010). A simple method for designation of urban ventilation corridors and its application to urban heat island analysis. Building and Environment, 45(8), 1880–1889. doi:10.1016/j.buildenv.2010.02.019
- Wurm, M., Taubenbock, H., Roth, A., & Dech, S. (2009). Urban structuring using multisensoral remote sensing data: By the example of the German cities Cologne and Dresden. IEEE Xplore, 1–8. doi:10.1109/URS.2009.5137555
- Yu, C., & Hien, W.N. (2006). Thermal benefits of city parks. Energy and Buildings, 38(2), 105–120. doi:10.1016/j.enbuild.2005.04.003