
ABSTRACT
Humanitarian action has rapidly adopted Earth observation (EO) and geospatial technologies shaping them according to their needs. Protracted crises and large-scale population displacements require up-to-date information in many facets of humanitarian action support, from mission planning, resource deployment and monitoring, to nutrition and vaccination campaigns, camp plotting, damage assessment, etc. Even though nearly all assets of remote sensing apply in such demanding scenarios, it remains a challenge to fully implement and sustain a trustful and reliable information service. This paper discusses achievements and open issues in the use and uptake of EO technology, from a technical and organisational point of view, motivated by an information service for Médecins Sans Frontières (MSF) and its extension to other NGO’s information needs in the humanitarian sector. With a focus on EO-based population estimation based on (semi-)automated dwelling counting from very high-resolution optical satellite imagery as well as the exploitation of data integration (including radar sensors), the paper also covers potential service elements with respect to environmental and ground- or surface water monitoring. It investigates workflow elements in relation to information extraction and delivery by illustrating a broad range of application scenarios, and discusses first operational solutions of a customized service portfolio.
Introduction
EO and GI technology for (geo-)humanitarian action
The uptake of geospatial technologies within the humanitarian aid sector happened at an unprecedented rate over the last decade (Lang, Füreder, & Rogenhofer, Citation2018), attributed to an urgent need for updated information in humanitarian crises and conflict situations involving large-scale human displacement, either triggered directly by the conflict or indirectly through the adverse impact on the population (see section 1.2). Severity and pertinence of population displacement makes situational awareness (Voigt, Schoepfer, Fourie, & Mager, Citation2014) and effective aid work in complex humanitarian emergencies increasingly rely on satellite image mapping as a critical asset (Denis et al., Citation2016; Lang et al., Citation2015, Citation2018; Quinn et al., Citation2018). Strong democratisation effects emerged from the proliferation and the ubiquity of tools and the level of maturity of information services in the geoinformatics (GI) and Earth observation (EO) domain, as promoted by large intergovernmental programmes such Copernicus initiative (European Parliament & Council, Citation2014). This concerns (i) the uptake by the user community (Zeil, Ourevitch, Debien, & Pico, Citation2017) and (ii) the involvement of the public at large in VGI (volunteered geographical information) (Elwood, Citation2008) and crowd mapping activities (Albuquerque, Herfort, & Eckle, Citation2016; SBTF, Citation2011).
Geohumanitarian action, meaning the integrated usage of EO*GI in support to planning and deploying of humanitarian aid, is a field where most (or even all?) assets of this technology can tap their full potential. Obtaining reliable information by gathering evidence on the ground is often limited in crisis situations, due to limited accessibility and time criticality. Utilizing GI and EO technology and choosing among the most suitable of their toolkits, entails a proper match between both operational needs and service provision. Humanitarian aid organizations, in their everyday invaluable work, are the ones to adopt, test, improve and develop further any new technology, in close collaboration with those providing it. With respect to EO, on which we focus in this article, this translates into the basic requirement of turning the (massive) image data into relevant geospatial information products for humanitarian actors (Füreder, Lang, et al., Citation2015), which remains to be a challenge (Lang et al., Citation2018).
As one of the core EO technologies remote sensing (RS) captures data over large areas under similar conditions, taken from a constant orbital view, revealing the situation as is, non-distorted, non-manipulated, and potentially accessible to everyone. Regularly acquired RS data enables monitoring constant or changing ground conditions, in multiple scales and temporal frequencies (Hagenlocher, Lang, & Tiede, Citation2012; Kranz, Sachs, & Lang, Citation2015). Obtained from archives, RS data enable retrospective views, in cases when alternative tracks or records do not exist, for example on the growth of camps (Lang, Tiede, Hölbling, Füreder, & Zeil, Citation2010) or camp dismantling (Stängel, Tiede, Lüthje, Füreder, & Lang, Citation2014). In general, monitoring camps (Kemper & Heinzel, Citation2014) and their surroundings (Hagenlocher et al., Citation2012) as well as other ephemeral settlement structures are often achieved by very high (spatial) resolution (VHR) data (ground resolution ≤4 m, according to the Copernicus definitionFootnote1) due to the required detail. For an indicative analysis of general trends of camp growth and dynamics, high-to-medium resolution data (ground resolution >4 m and ≤300 m) with a high temporal frequency, such as Sentinel-2 (Wendt, Lang, & Rogenhofer, Citation2017) can be used. While for conflict hot spots in arid zones favourable weather conditions usually allow for obtaining high-quality images, independence of weather and daylight increases the versatile use of RS data in emergency response. The potential of active remote sensing using other energy sources than sunlight is increasingly tested. This includes synthetic aperture radar (SAR) (Braun, Lang, & Hochschild, Citation2016) and more comprehensive in Braun (Citation2019), or sensors capturing ground-emitted lights at night. Nightlight data have been used as direct indicators for conflicting activities (Witmer & O’Loughlin, Citation2011) or as indirect cues for ongoing conflicts and crises, as the examples of Syria and Yemen show (Jiang, He, Long, & Liu, Citation2017).
The benefits of remotely sensed data as compared to conventional field mapping () have made EO a critical decision-supporting tool for humanitarian professionals (Lang et al., Citation2015). Information products (see chapters “Service elements to meet the information needs” and “Towards an operational humanitarian EO information service”), tailored to the needs of actors in the field, enrich the pool of spatially aware technologies for humanitarian relief support. The characteristics of RS data shown in are key assets to increase efficiency in decision-critical information delivery.
Table 1. Characteristics, general, and specific assets [+] of remotely sensed data and EO technology for humanitarian aid (after Lang et al. (Citation2015), modified and extended). Characteristics are generic definition elements of the term “remote sensing” as found in textbooks, e.g. Campbell (Citation2002). Open challenges are indicated by an [°]. Note that for the sake of readability, this overview table has no intention to refer to specific work and consequently provides no references (cf. the following sections).
Human displacement and the information needs by humanitarian organisations
Large-scale population displacements within complex emergency situations caused by persecution, conflict or generalized violence over recent years, in particular in the Middle East, Sub-Saharan Africa and South Asia, has ever increased the need for more effective humanitarian assistance. According to official figures from the United Nations High Commissioner for Refugees (UNHCR), 68.5 million people were forced to flee their homes by the end of 2017, comprising 25.4 million refugees, 40 million internally displaced people (IDPs), and 3.1 million asylum seekers. The figures declare an unprecedented increase rate of 3 million people per year, with 16.2 million newly displaced, which corresponds to 44,400 every day (UNHCR, Citation2017). At the same time, the world is undergoing a process of rapid urbanization with more than half of the world’s refugee population under UNHCR mandate lives in urban settings (UnitedNations, Citation2014). Up-to-date high-resolution population distribution datasets are important for planning humanitarian operations. EO data is increasingly getting importance to provide such fine-scale population data (Stevens, Gaughan, Linard, & Tatem, Citation2015). On the contrary, population in rural areas is often scattered in relatively small numbers in village structures. Burning of tukuls (traditional family houses in East and Central Africa) is a method of warfare against civilians and often leads to mass population displacements. Many of these attacks occur in remote, insecure environments that cover large geographic areas, making it difficult or impossible to collect first-hand information (Al Achkar, Baker, Card, & Rayomond, Citation2015). The article points to the growing demand for satellite-derived information for human rights and humanitarian organizations (e.g. Human Rights Watch).
In response to the trends sketched above, many projects and initiatives have emerged over the last years, where research institutions, public bodies and humanitarian actors share both technological and practical experience in mutual exchange. In an introductory paper to a workshop called “EO4Hum”, held in Salzburg in 2017 the authors outline recent trends and related issues of the uptake of geospatial technology in the humanitarian aid sector (Lang, Schoepfer, Zeil, & Riedler, Citation2017). Overall, the aim of humanitarian actors is to make the best use of satellite-based information products supporting their operations. The availability of commercial VHR imagery, often deemed to be critical in terms of the required detail, has greatly increased, not only by the higher variety of VHR sensors/satellites and image products, but also by specific agreements and data access grants more and more offered by vendors in particular to non-governmental organizations (NGOs). Outside the established data provision mechanism in disaster situations (see below), such direct agreements are essential to make NGOs independent from existing (governmental) programmes and allow unhindered operations. With satellite imagery as an asset, the issue of sharing this information (raw images, and in particular derived information arises). In this respect, the following questions are of concern (Lang et al., Citation2017): (1) Who is going to use the derived information and for what? Sharing information between actors such as UN, NGOs, civil protection organisations, etc., may involve conflict of interest and potentially affect neutrality. (2) Dual use: military and humanitarian actors may deal with similar information products to protect people in armed conflicts. (3) In relation to this, sensitivity issues applying to the protection of rights (such as privacy, human rights, human security) or interests (such as security as defined by military operations). (4) Full and open access versus commercial satellite providers, who may operate under the legal conditions of national governments potentially restricting data access or dissemination.
Related programmes and initiatives
There are various initiatives, particularly emerged around the field of satellite-based emergency mapping (SEM) (Voigt et al., Citation2007) and in crowd-sourced geospatial information. This section briefly summarizes the state of play in this respect. Various SEM mechanisms have become well established (for an overview, see Lang et al. (Citation2017)), providing satellite imagery and value-added products, and operating at different levels, from national to international.
The International Charter Space and Major Disasters (short: the Charter), based on a cooperation of space agencies and space system operators to help manage crises arising from natural or technological disasters, have a global scope of action and for many years was the most widely active SEM mechanism. The Charter, with its primary objectives to (1) to supply critical data during periods of crisis for the management and anticipation of crises; and (2) to support emergency assistance, reconstruction, as well as subsequent operations (Voigt et al., Citation2016), is often a critical mechanism to compensate for missing or complementing domestic capacities (Lang et al., Citation2017). Recently, other regional initiatives have emerged, so that charter activations are relatively decreasing, like in China, National Disaster Reduction Centre (NDRCC) gained much in importance (Voigt et al., Citation2016) or for Europe, from where the Copernicus Emergency Management Service (see below) emerged. In Asia, the Sentinel Asia (SA) initiative has significantly grown, and parts of the world such as the Near East, Central America, the Caribbean and South America are widely covered by UNOSAT and REACH activities.
The Copernicus Emergency Management Service (CEMS), in operation since April 2012, provides maps and analyses based on satellite imagery (before, during or after a crisis), and early warning services for flood and fire risks, as well as droughts. In support to crisis managers, civil protection authorities and humanitarian aid actors dealing with natural disasters, man-made emergency situations and humanitarian crises, as well as those involved in recovery, disaster risk reduction and preparedness activities (European Commission, Citation2015). The work of Denis et al. (Citation2016) illustrates the evolution of the European EO-based emergency response service.
Next to the established SEM mechanisms, new initiatives involved in humanitarian mapping community have emerged over the last few years. Crowd-mapping initiatives are producing geospatial data on geographical features (e.g. information layers on roads, buildings, etc.) considered critical to deliver aid in humanitarian operations or gain awareness about the situation in general. Under the slogan “Mapping our World Together” the Humanitarian OpenStreetMap (OSM) Team (HOT) follows the mission of creating maps for humanitarian response strictly adhering to the principles of open source and open data sharing. It utilizes the OSM network, which forms the largest crowdsourcing community globally. It also enables collaborative mapping between different actors, governmental, organisational and the public at large.
Missing Maps is another humanitarian project founded by the American Red Cross, British Red Cross, HOT and Médecins Sans Frontières (MSF, Doctors Without Borders). It aims at “mapping the most vulnerable places in the developing world” using OSM to improve crisis response. A series of mapathons in the humanitarian sector is organised by the Missing Maps project, such as one jointly launched by the Austrian Red Cross and the Austrian sections of MSF. Missing Maps also developed the mobile app MapSwipe to enable fast classification of satellite images. It aims at identifying where communities are located by swiping through satellite images. This information is fed back to mappers, who can then map the settlements in more detail.
Nowadays, there are several initiatives with the aim to provide multi-purpose global population data sets, including: Gridded Population of the World (Center for International Earth Science Information Network (CIESIN), Citation2016), Global Human Settlement Layer (European Commission, Joint Research Centre (JRC), & Center for International Earth Science Information Network (CIESIN), Citation2015), Global Urban Footprint (German Aerospace Center (DLR), Citation2016), WorldPop (School of Geography and Environmental Science – Univ Southampton, Dept of Geography and Geosciences – Univ Louisville, Dept de Geographie – Univ Namur, & Center for International Earth Science Information Network (CIESIN), Citation2018) or LandScan Global Population Dataset (Oak Ridge National Laboratory, Citation2019). These data sets help estimate what proportion of the population is potentially at risk or in an emergency and to broadly assess how many people usually reside within an affected area.
In the following chapter, we first discuss what service elements are critical to meet the specific information needs by humanitarian actors, before we go in a more in-depth analysis of the technical elements that EO can provide to meet these. In the chapter ”Towards an operational humanitarian EO information service” we feature an example, where a humanitarian information service has been successfully implemented in a close service provider/user partnership, and complement this section with a series of demonstrator products, which help to expand the service portfolio in the near future. A brief summary and outlook conclude this article.
Service elements to meet the information needs
In the following section, we reflect on critical elements of a humanitarian information service based on the integration of EO satellite data and other auxiliary data. We start with briefly describing an operational service tailored to very specific user needs and then conceptually widen the scope showing additional potential to extend such a service portfolio.
Translating information needs
The need for effective information provision reaches to all stages of humanitarian assistance, from mission planning in the immediate emergency phase as well as safeguarding care and maintenance on the longer run, including the supply of natural resources like ground- and surface water and the nutrient capacity of the surroundings (see ).
Figure 1. Abstract view of information product portfolio in a humanitarian assistance.
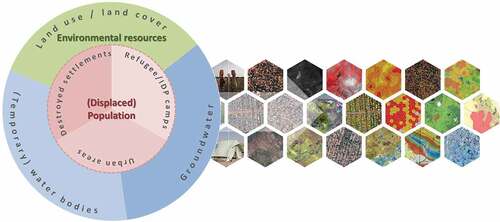
While the information on (displaced) population is the core of the service portfolio, the outer circle denotes the secondary information needs on environmental resources, hydrological conditions, land use changes, land degradation, etc. (see text for further explanation).
Population monitoring
The key to any humanitarian response action is to target aid to the right people at the right place at the right time. NGOs, in order to effectively plan, direct, or adjust their operations and logistics on the ground (Füreder et al., Citation2015) rely on up-to-date and often (near) real-time information, on a high level of confidence and trustfulness ( top). Population monitoring (Ehrlich et al., Citation2009), i.e. observing the number and composition of displaced population is critical in different phases of humanitarian crisis response, as briefly summarized in the following (Lang et al., Citation2018).
Emergency phase: rapid assessment of the situation on the ground, whether the people in need gather in distinct camps or more complex urban settings; to save time and resources (staff, logistics and cost) and to provide means of verification of human presence, and to direct humanitarian assistance.
Construction: reflecting camp dynamics and self-settling activities, monitoring camp evolution, planning logistical infrastructure and services such as health care or vaccination campaigns.
Care and maintenance. Spatial analysis can enrich the information obtained by extracting and characterising single dwellings as a proxy for population estimation. Density maps show areas where the actual distribution of dwellings may require optimisation. Distance maps (dwellings to boreholes, latrines, hospitals, etc.) may support camp infrastructure planning. Health indicators relating the number of people affected by a disease to the underlying population number of the camp help to better plan vaccination campaigns.
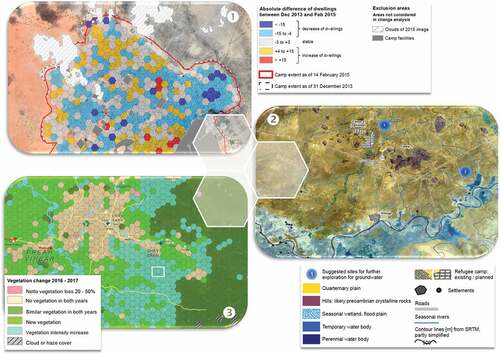
Figure 2. (1) Population monitoring (change between 2013 and 2015) in a refugee camp in Kenya. The figure shows the northern section of the camp and indicates increase (yellow to red tones), as well as decrease (blue tones) of dwelling density reported on a regular hexagon grid. White dashed polygons and dark spots indicate clouds and respective shadows. Data source: Worldview-2, 50 cm GSD, Analysis: Z_GIS. (2) Hydrogeological reconnaissance map for surface water abstraction in the vicinity of a camp site in Ethiopia, reflecting the situation in 2015. Data source: Landsat-8 and (hydro)geological data, Analysis: Z_GIS. (3) Vegetation change as an indication for land use conversion. Dark green – vegetation no change, bright green – vegetation increase, turquoise – veg. decrease, brown colour – no vegetation in both years. Data source: Sentinel-2, 10 m resolution 2016/2017. Analysis: Z_GIS.
Water availability
The supply with sufficient potable water is of paramount importance in any humanitarian response. While water trucking and purification of surface water can meet the immediate response, the more sustainable solution is the exploitation of local groundwater resources. Therefore, a key task is to assess the hydrogeological conditions, even in situations where detailed geological or hydrogeological maps are missing. Wendt et al. (Citation2014) discuss procedures to provide hydrogeological reconnaissance maps based on freely available remote sensing and geological data sets (, right). Remote sensing for groundwater exploration is tricky to accomplish, as groundwater is not directly visible by satellite remote sensing. Nonetheless, a desk study based on EO data and available geological reports and maps can provide useful information on the general hydrogeological context, depending on the local situation. In a crystalline rock setting, groundwater flow is constrained to fractures; these might be visible in remote sensing data as lineaments. In a setting with folded sedimentary rocks, outcrops at nearby locations could be traced into the subsurface to predict the rock type that may be encountered at a planned drilling site. In a sedimentary setting, the locations of clays, sands and gravel deposits might be identifiable and could give hints on location and sizes of water-bearing layers. Further, the presence, seasonality and flow direction of surface waterbodies, the occurrence of vegetation as an indication for groundwater upwelling, and the location of potential contaminants near water sources could be mapped. In practice, the operational value of remote sensing is very context-specific, and always has to be analysed in the light of groundwater information gathered in the field or from borehole records.
Surrounding land cover and land use
Updated information on land use and land cover (LULC) improves the understanding of the wider geographical context around camps or ephemeral settlements. This includes the potential supply of natural resources in terms of agricultural produce, fuelwood, building material, etc. (Lang et al., Citation2018), as well as the general environmental conditions, for example to estimate the risk of vector-borne diseases. Multiple sources of remotely sensed data can be used to accomplish this in a series of scale levels (Kranz et al., Citation2015). LULC change analysis (, bottom) can act as an early indicator of a hosting areas’ potential depletion of natural resources due to human presence in larger or more pertinent camps. Studies have shown the feasibility of using multi-temporal SAR data (Braun et al., Citation2016) or VHR optical data (Hagenlocher et al., Citation2012) for this purpose.
Information extraction and analysis
Manual-visual (incl. crowd-based) vs. automated techniques
As detailed above, humanitarian actors often do not have reliable information at hand about the number of people in need. Population estimation can be supported by EO data (Bjorgo, Citation2000; Checchi, Stewart, Palmer, & Grundy, Citation2013; Füreder et al., Citation2015; Giada, de Groeve, & Ehrlich, Citation2003; Kemper, Jenerowicz, Gueguen, & Poli, Citation2011; Lang et al., Citation2010; Tiede, Füreder, Lang, Hölbling, & Zeil, Citation2013). While using EO data individuals are not directly visible, but indicators of human presence (Ehrlich et al., Citation2009; Kelly, Citation1998) such as huts, tents and other infrastructure elements can be detected and the population can be estimated by multiplying each structure by an average structure occupancy rate (Füreder, Lang, Rogenhofer, Tiede, & Papp, Citation2015). Visual image interpretation, still the most common way of dwelling counting, is generally seen superior to algorithmic approaches in identifying complex features and structures (Checchi et al., Citation2013). Since visual interpretations are generally time-consuming, NGOs often engage volunteers, the HOT community or Missing Maps, as briefly described above. However, visual inspection becomes inefficient and prone to errors or coarse generalisations for repetitive, standardized tasks (Lang et al., Citation2015). Spröhnle et al. (Citation2014) showed that different interpreters achieve quite divergent results when image complexity is increasing. Albuquerque et al. (Citation2016) evaluated data from the Missing Maps project and found a high level of quality to identify buildings, but especially small buildings with low contrast to surroundings were often not identified. Elia, Balbo, and Boccardo (Citation2018) compared crowdsourced data from OSM with data from professional mappers from CEMS. In general, the quality of pre-event data from crowdsourcing was quite good, but on post-event data volunteer mappers tended to map many damages, which were not evident, meaning that they tended to include more commission errors.
In order to cope with the requirements of achieving reliable, transferable, yet quick and objective results, new methods of automated information extraction have been investigated in the humanitarian context in recent years (Laneve, Santilli, & Lingenfelder, Citation2006; Lang et al., Citation2010; Spröhnle, Fuchs, & Pelizari, Citation2017; Spröhnle et al., Citation2014; Tiede et al., Citation2013).
Object-based image analysis (OBIA)
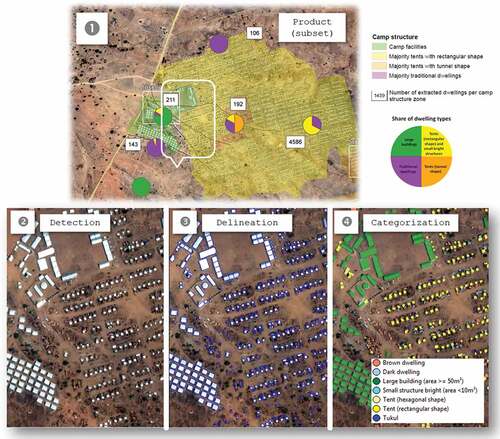
(Geographical) object-based image analysis (OBIA or GEOBIA) emerged as a paradigm for (semi-)automated satellite image analysis (Blaschke et al., Citation2014), incorporating spatial concepts as additional class descriptors. It usually works based on a segmentation routine that delineates the objects of interests and provides an augmented features space for classification based on – next to spectral features – geometric, spatial, hierarchical, relational ones. OBIA is especially powerful in discriminating distinct dwelling types (according to shape or size) from VHR data or other relevant structures (facilities, roads or agricultural fields) which allow for clear geospatial distinction (see )
Figure 3. Procedure of dwelling detection in an OBIA environment. (1) Subset of a camp structure map based on extracted dwelling types (product); (2) High contrast image for dwelling detection; (3) Automated delineation using segmentation; (4) Categorization into dwelling types by rules; Data sources for (1) to (4): WorldView-2, 50 cm, Analysis: Z_GIS.
Urban remote sensing includes urban morphology (Puissant, Zhang, & Skupinski, Citation2012) and indicators for informal settlements from VHR data using OBIA (Hofmann, Taubenböck, & Werthmann, Citation2015). Population estimation is mostly done on a 2-dimensional basis; however, in urban areas it is considered important to also include the 3rd dimension (Almeida, Oliveira, Rennó, & Feitosa, Citation2011), which can be retrieved from a detailed digital surface model (DSM), which can be obtained VHR stereo satellite images (Kulessa & Lang, Citation2016). In order to obtain true buildings’ or other objects’ heights, a correct digital terrain model (DTM) in addition to a DSM is needed. To derive a DTM from a DSM in areas where such detailed information does not exist, a semi-automated land cover (LC) strata sampling can be used together with OBIA techniques (Lüthje, Tiede, & Eisank, Citation2014).
Template matching, i.e. the process of finding a pattern in an image, is widely used in remote sensing to address a variety of problems including road extraction (Hu, Zhang, & Tao, Citation2004) or dwelling detection. The integration of stratified template matching methods in an OBIA workflow has shown to improve the accuracy of dwelling extraction (Laneve et al., Citation2006; Tiede, Krafft, Füreder, & Lang, Citation2017).
Machine/deep learning
There is a growing use of deep machine learning approaches such as convolutional neural networks (CNN) for object recognition (Zhu et al., Citation2017). Machine learning (Quinn et al., Citation2018) started with land cover classifications where often random forests or support vector machines were used. Now, most approaches are variations of deep learning methods. CNNs require large training datasets and computational power, but often achieve higher accuracies in object detection than classical object detection methods. CNNs were successfully applied for dwelling extraction by Quinn et al. (Citation2018), who analysed 13 refugee/IDP camps and Ghorbanzadeh, Tiede, Dabiri, Sudmanns, and Lang (Citation2018) who compared results of a CNN network with a semi-automated object-based dwelling extraction. Main difficulties for dwelling extraction are the high degree of variation between different camps, the objects to detect are small and often clustered together and the need for a high degree of accuracy. The mentioned authors conclude that it is difficult to transfer the models due to different sensors and variation of settlements and sample collection is quite time-consuming. (Chen, Zhou, Zipf, & Fan, Citation2018) tried to overcome the latter shortage by using multiple crowd-sourced data. The Signal Program on Human Security and Technology at the Harvard Humanitarian Initiative (HHI) developed a machine learning algorithm to automatically identify tukuls, the so-called “Tukul detector” (Harvard Humanitarian Initiative, Citation2015).
Multi-temporal, multi-sensor analysis
A regular update of the situation and monitoring of the changes occurring is one of the key assets of a standardized remote sensing system (see ). Post-classification change detection builds on comparative analysis of two or more time slices of images, classified by the same routine. Often such analysis combines different sensors of similar types (e.g. Landsat-8 and Sentinel-2), depending on availabilities. Increasingly, a blending of different sensor technologies, i.e. passive and active remote sensing techniques and multiple spatial resolutions, unite the advantages of each. Satellite images acquired by synthetic aperture radar (SAR) allow detecting additional properties of the earth’s surface due to considerably longer wavelengths. The combination of radar data and optical VHR data seems is promising for dwelling extraction (Spröhnle et al., Citation2017). To complement the weather- and daylight-depending availability of optical data, Braun et al. (Citation2016) investigate the potential of SAR data in assessing the environmental conditions around the Dadaab cluster of refugee camps in Kenya. The multi-temporal land cover classification studies the impact of refugee camps on their environment while demonstrating how to use multi-temporal C-band SAR data for LULC classification. The study used a mixed sensor approach of SAR (ERS-2 and Sentinel-1), and optical HR (Landsat TM and Landsat OLI) to cover a time span of 18 years in 7 time slots. An index was calculated to evaluate the environmental impact of land use transformation considering weighted distributions of land cover according to the FAO-LCCS scheme (Di Gregorio & Jansen, Citation2005) in the respective time slot (Braun, Citation2018).
As an example how to operationally analyse multiple time stacks organised in data cubes (Augustin, Sudmanns, Tiede, & Baraldi, Citation2018) is the remote sensing image understanding and querying system (Tiede, Baraldi, Sudmanns, Belgiu, & Lang, Citation2017). It integrates three elements, (1) multi-spectral image pre-processing (including radiometric calibration); (2) automatic, near-real time low-level (pre-) classification of multi-temporal multi-spectral images (pre-classification) based on the Satellite Image Automatic Mapper (SIAM) (Baraldi, Citation2011); (3) tracking of image objects or pixels through time (Sudmanns, Tiede, Wendt, & Baraldi, Citation2017).
Dissemination
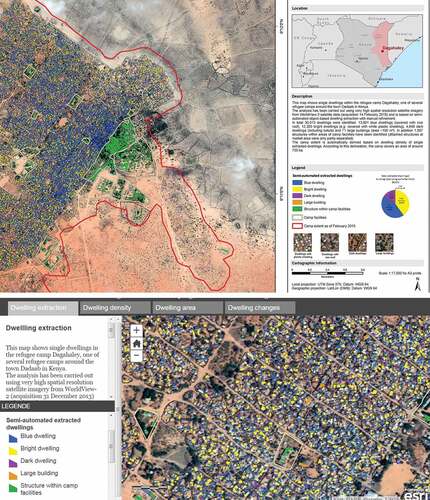
Depending on the user’s need we deliver the extracted information in different formats, including both proprietary and open-source solutions: geospatial PDF map (distance measures, retrieving coordinates, turning on/off single layers enabled), Google Earth’s KML/KMZ-format, interactive web service via ArcGIS Online and/or as individual GIS data layers in shapefile format (see ). Designed for a broad field of applications in the humanitarian sector, the OGC-conform, open-source collaborative mapping platform (CMap) presented by Schörghofer, Lang, Wendt, and Riedler (Citation2017) provides, in addition to data sharing, a dynamic and joined mapping environment with WebGIS functionalities of dynamic visualizations (Lang et al., Citation2017).
Figure 4. Ready-to-print map (top) vs. web services/applications (bottom), Source: WorldView-3, 50 cm, Analysis: Z_GIS The printed map has all relevant elements of a conventional cartographic product. For the interactive web map (e.g. ArcGIS Online), users can edit the data if needed, add their own data or perform basic spatial analysis functions. Using a set of configurable apps the map can be displayed in a well-designed, intuitive and user-friendly way.
Towards an operational humanitarian EO information service
Experiences from population estimation in operational context
We have outlined how mission-critical information supports planning of emergency response and relief using multi-temporal and multi-scale information from satellite imagery and GIS data. Drawing from this, an (EO-)based information service provides dedicated geospatial information products in support to humanitarian operations. The service delivers the developed products as tailor-made maps, online web services and advanced cartographic visualisations, utilized and validated by teams on the ground. The information service was set up and collaboratively designed with Médecins Sans Frontières (MSF), an independent and international humanitarian organisation operating around the world. The service runs operationally since 2012 under constant refinement on the product and information request level (Lang et al., Citation2017).
The population monitoring service component utilises VHR satellite imagery to derive information on amount and spatial distribution of dwellings, dwelling density, camp extent, internal camp structure as well as general growth of the camp (Füreder et al., Citation2015). Dwelling density measures show the distribution of population within a camp. Camp zones mapping supports camp planning and management. Camp structure analysis shows prevailing dwelling types within definable regular reporting unit (e.g. regular grids, hexagons) or working zones of NGOs, if available. Multi-temporal analyses and change assessments enables monitoring of camps evolving over time. Additional on-demand services refer to environmental resources including groundwater. The obtained information is used as a critical asset to better organise vaccination campaigns (against malaria, cholera, yellow fever, etc.), for medical, food- and-shelter logistics, for monitoring the habitat of resistant vector-borne diseases, for drilling water wells, estimations of casualties after camp attacks, as well as assessing damaged areas after floods or earthquakes.
As by end of 2018, the service has delivered over 500 maps detailing the situation on the ground at 60 locations in over 20 countries (predominantly in Eastern Africa, with more than 100 maps in South Sudan alone). Camp monitoring has been done for up to 9 times over the same location, for camps in Cameroon, Kenya and South Sudan. Almost 60% of the requests were completed within 15 calendar days (from request to delivery of map products). Data availability is a very crucial step in providing timely information. 80% of the data acquired for 60 sites was delivered within 5 calendar days as for the majority of requests archive data could be used. Time for image analysis mainly depends on the size and complexity of the data. Around 60% of the maps were provided within 5 working days after receipt of the satellite image, 80% within 10 working days. Products occur in a variety of formats: static PDF maps, Google Earth overlays, dynamic online maps, image files and shapefiles.
Validating automated dwelling extractions based on reference data from the field is often not feasible due to the unsafe situation; so we perform accuracy and plausibility analysis based on comparative visual image interpretation. In exceptional cases, data collected in the field by MSF epidemiologists, partly together with the London School of Hygiene and Tropical Medicine (LSHTM), in order to have the results benchmarked against a standard population survey. Such field assessments were, for example in the city of Am Timan in Chad (Grundy et al., Citation2012) or the Kutupalong refugee camp in Bangladesh.
Extended service portfolio
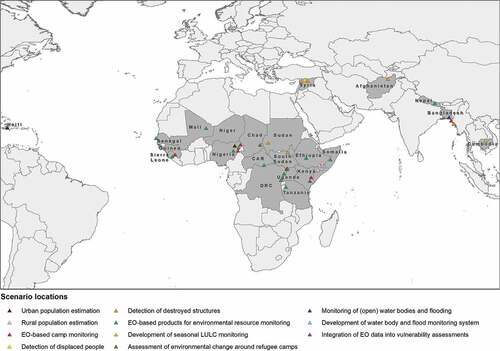
The aim of the project EO4HumEn+ (Extended EO-based services for dynamic information needs in humanitarian action) (www.zgis.at/humanitarian-services), was to extend the service portfolio and adapt it to specific information needs by other global humanitarian actors. Those included the International Committee of the Red Cross (ICRC), the Austrian Red Cross, SOS Children’s Villages, and Groundwater Relief according to their primary mandates and fields of action. The following lists the range of demonstrator products for various scenarios in different locations (see ).
Table 2. Topics addressed in demonstrator products within the EO4HumEn+ project and scenarios to extend the current portfolio of the humanitarian information service (POP = population monitoring, ENV = environmental resources).
Figure 5. Map showing scenario locations on global scale and types of products (colour code).
Population estimation in urban areas
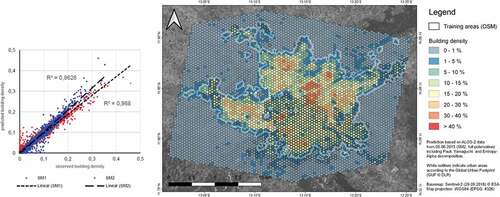
The suitability of SAR data (here ALOS-2 imagery) for population estimation in urban areas was tested for the city of Maiduguri in North Eastern Nigeria to monitor the influx of persons displaced by the conflict between Nigeria and Boko Haram militia (). As OSM data only covered the Southern part of the city, the aim was to impute the dwelling density based on statistical measures and machine learning techniques to the unmapped areas in the North. The city extent was successfully completed and the suitability of different classifiers evaluated. Results of comparing Root Mean Square Error (RMSE) and coefficient of determination (R2) for different input data achieved highest accuracy with fully polarized ALOS-2 data at a spatial resolution of 6 m with a Random Forest classifier. ALOS-2 data at Fine Mode (3 m of spatial resolution) revealed lower accuracies, leading to the conclusion that polarimetric radar information may balance out spatial resolution (Braun, Citation2019).
Figure 6. Estimation of dwelling density from ALOS-2 data in Maiduguri, Nigeria. The plot (left) shows observed vs. predicted building density based on ALOS-2 single polarization (SM1, red) and full polarization (SM2, blue) data (Braun, Citation2019).
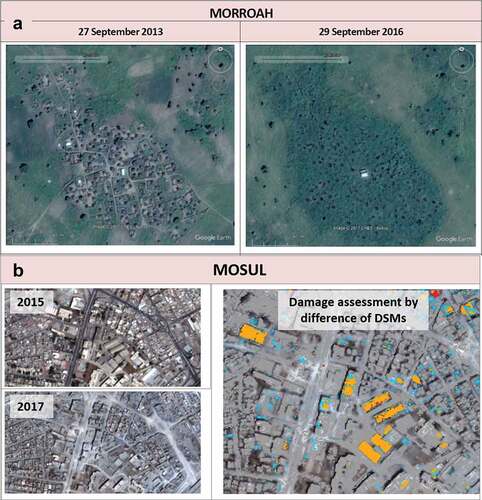
Detection of destroyed structures
Pre- and post-event image analysis using VHR image pairs allows for a detailed documentation of destroyed settlements ().
Figure 7. Mapping of destroyed structures; (A) visual detection of destroyed village in Jebel Mara region of Darfur, Sudan; (B) experimental damage assessment by difference of DSMs from optical VHR images for the city of Mosul, Iraq (Braun, Citation2019).
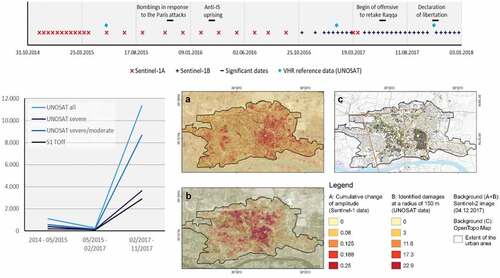
The potential of Sentinel-1 time-series data has been evaluated for the city of Raqqa which was heavily affected by combats during the Syrian civil war (). A total number of 56 scenes helped identify significant changes in backscatter intensity as a proxy for demolished buildings. Validation showed a high correspondence with severe damages (visually identified from VHR optical images by UNOSAT). Moderate or light damages were not detectable by SAR data at this resolution but the general suitability of a persistent scatterer for damage assessment was proved in this study (Braun, Citation2018).
Figure 8. Detection of damages by time-series of Sentinel-1 in Raqqa, Syria. The graph shows the overall changes detected in the Sentinel-1 time-series analysis compared to the findings by UNOSAT in the given time-periods. While moderate damages (light blue) are highly underestimated, there is a good correlation with the amount of severe damages (dark blue) (Braun, Citation2019).
Resettlement suitability analysis
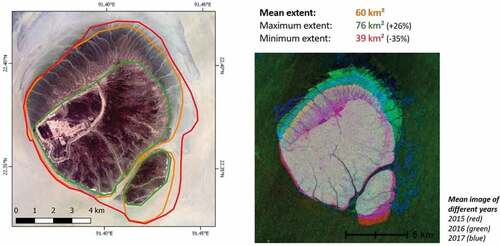
Following plans to relocate Rohingya refugees from the crowded Kutupalong camp to the previously uninhabited island Thengar Char, the Meghna estuary was analysed (). The extent of the island Thengar Char (also known as Bashan Char) was investigated based on 72 Sentinel-1 images, 74 ERS-1/2 images and 48 ENVISAT images. The data reaches back to the year 1991 and allowed to analyse surface variations due to sea-level changes. Analyses showed that the island is a recent landform not present before 2011. Analysis of Sentinel-1 data showed strong fluctuations on the island’s surface (between 39 km2 and 76 km2). It also showed that large parts of the islands are not suitable for construction due to the risk of flooding during periods of high sea surface levels.
Figure 9. Sea-surface dynamics on the extent of Thengar Char since 2014. The mean extent was derived based on visual interpretation of the temporal average backscatter intensity image for the investigated period (left). The mean images of 2015, 2016 and 2017 displayed in red, green and blue emphasizes the overall movement of the island’s surface towards the north (Braun, Citation2019).
Infrastructure and water supply
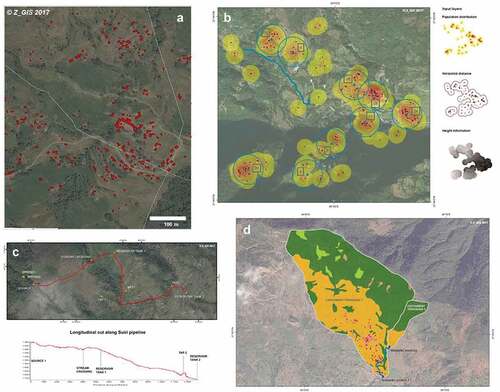
The earthquakes that struck Nepal in spring 2015 not only caused direct impacts of death and injuries to people, but also have long-term effects such as the destruction of vital infrastructure. EO data and GIS analysis were used by Riedler, Bäuerl, Wendt, Kulessa, and Öze (Citation2017) in order to support the rehabilitation of water supply infrastructure planned by the Earthquake Recovery Operation of the Nepal Red Cross Society in the area of Lapilang, Nepal (). The study pursued the following objectives: (1) to provide accurate elevation information with a spatial resolution of 2 m to support the planning of water supply systems; (2) to map the distribution of buildings as a proxy for population distribution to facilitate a spatially explicit estimate of water demand; (3) to identify potential locations for community water taps that fulfil national standards; and (4) to assess land cover/land use in watershed areas to estimate meliorating effects and potential contamination risks.
Figure 10. Selected map products to support water infrastructure refurbishment in Lapilang, Nepal. (A) dwelling extraction from VHR images; (B) suggested locations for communal water taps based on acceptable horizontal and vertical distance to households; (C) longitudinal profile along water pipeline from SPOT DEM, to support construction; (D) landcover of catchment areas of water sources to assess risk of contamination (Riedler et al., Citation2017).
Health and water access
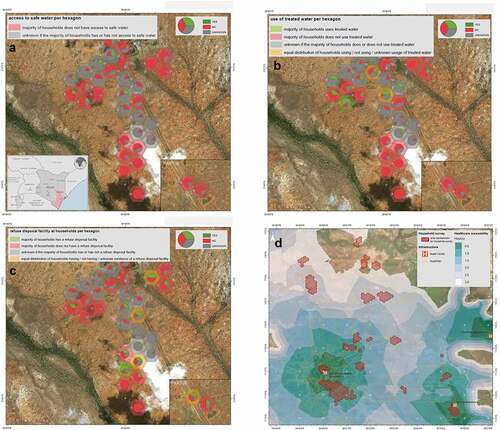
The lack of resilience to the impacts of disasters often relates to limited access to health services. In the study conducted in Tana River County in Kenya, the focus was on providing treatment of malaria, pneumonia and diarrhoea especially to children less than 5 years (). The following maps and indicators allowed for an aggregated view of potential vulnerability to hygiene-related diseases such as diarrhoea: (1) household density in the study area; (2) accessibility of health services, based on a network analysis; (3) flood maps, based on a series of satellite images since 1984; (3) mapping of WASH-related indicators, based on an internal survey, including access to water sources; (4) walking time to safe water sources; and (5) treatment of water and access to waste disposal system.
Figure 11. Selected map products for vulnerability to diarrhoea in Tana River, Kenya; (A) access of households to safe water; (B) access of households to water treatment; (C) access of households to refuse disposal; (D) walking distance to nearest health facility, Analysis: Z_GIS.
Conclusion and outlook
The optimisation of information flows in crises is a critical asset in the humanitarian domain, and technological innovation is key, while its usefulness will prove on its effectiveness to save lives or at least to support such endeavour. (Geo-)Humanitarian action as the active usage of EO*GI technology in support to planning and deploying of humanitarian aid is not an all-purpose remedy as shown in . Complementing its manifold assets, the indicated challenges do not intend to discourage any use of EO but to point to open issues deserving attention to foster even more their uptake. To assess in a comprehensive manner the actual increase of effectiveness, a defined set of performance indicators would be required, which are difficult to define or derive. One indirect indicator is the increasing number of requests and the ongoing standardisation efforts of products and service lines in this domain. Challenges faced by different actors in running such services operationally, are often generalizable; they apply to data acquisition, data integration, interoperability and data exchange routines (Lang et al., Citation2017). Working in trans-organisational settings, where several humanitarian actors use, produce and share data, poses technical challenges. Beyond satellite-based mapping, the emergence of new technologies, such as portable ground sensors including drones as well as “human sensors” based on signals or social media use, will enable new ways of humanitarian support, but at the same time arising new issues of ethics, privacy and potential misuse. Thus, next to the technical prerequisites, mutual trust-building is a key requirement for such services to be taken up sustainably.
With respect to information products, there are countless options, but not all of them prove to be useful in the context of humanitarian operations. The tailoring of information products according to user needs is an interactive and iterative process, requiring both technical and organizational understanding from either side (Lang et al., Citation2018). EO and geospatial technologies gained attention in the field of humanitarian action support. Objectively, there are many reasons for this uptake seem from a technical perspective, as nearly all assets of remote sensing apply in such demanding scenarios; still, implementing, sustaining, and constantly improving a trustful, reliable, and operational information service remains an effort. Decisions on which (new) types of EO data to use, which algorithms to be employed, and what products to be delivered, need to be permanently adjusted with new insights considered. The organizational and institutional framework conditions will govern the usability of the service in daily operations assessed. This application domain will face ongoing and future challenges but it bears an enormous potential, to exploit (big) EO data in a very meaningful way.
Acknowledgments
Research leading to this article has been co-funded by the Austrian Research Promotion Agency (FFG) under the Austrian Space Application Programme (ASAP) within the projects EO4HumEn (EO-based services to support humanitarian operations: monitoring population and natural resources in refugee/IDP camps, contract no. 840081) and EO4HumEn+ (Extended EO-based services for dynamic information needs in humanitarian action, contract no. 854041). Direct funding has been granted by Médecins Sans Frontières (MSF) Austria and the Karl Kahane Foundation. Co-financing has been received from the Science Fund of the Provincial Government of Salzburg and the OBIA Lab. We are grateful to Rosi Siber for reviewing the manuscript prior to submission, raising remarks and making suggestions for improvement. Last but not least we acknowledge the technical support of Hannah Augustin and Peter Jeremias and many minor contributions from all collaborators in the EO4Hum team at Z_GIS.
Disclosure statement
No potential conflict of interest was reported by the authors.
Additional information
Funding
Notes
Related Research Data
References
- Al Achkar, Z., Baker, I.L., Card, B., & Rayomond, N.A. (2015). Satellite imagery interpretation guide: Intentional burning of tukuls. Cambridge, MA: Harvard Humanitarian Initiative.
- Albuquerque, J.P., Herfort, B., & Eckle, M. (2016). The tasks of the crowd: A typology of tasks in geographic information crowdsourcing and a case study in humanitarian mapping. Remote Sensing, 8(10), 859. doi:10.3390/rs8100859
- Almeida, C.M., Oliveira, C.G., Rennó, C.D., & Feitosa, R.Q. (2011). Population estimates in informal settlements using object-based image analysis and 3D modeling. IEEE Earthzine, 16.
- Augustin, H., Sudmanns, M., Tiede, D., & Baraldi, A. (2018). A semantic Earth observation data cube for monitoring environmental changes during the Syrian conflict. GI Forum - Journal for Geographic Information Science, 1, 214–227.
- Baraldi, A. (2011). Satellite Image Automatic Mapper™ (SIAM™). A turnkey software button for automatic near-real-time multi-sensor multi-resolution spectral rule-based preliminary classification of spaceborne multi-spectral images. Recent Patents on Space Technology, (1), 81–106. doi:10.2174/1877611611101020081
- Bjorgo, E. (2000). Refugee camp mapping using very high spatial resolution satellite sensor images. Geocarto International, 15(2), 79–88. doi:10.1080/10106049908542156
- Blaschke, T., Hay, G.J., Kelly, M., Lang, S., Hofmann, P., Addink, E., … Tiede, D. (2014). Geographic object-based image analysis: A new paradigm in remote sensing and geographic information science. ISPRS Journal of Photogrammetry and Remote Sensing, 87(1), 180–191. doi:10.1016/j.isprsjprs.2013.09.014
- Braun, A. (2018). Assessment of building damage in Raqqa during the Syrian civil war using time-series of radar satellite imagery. GI Forum - Journal for Geographic Information Science, 1/2018, 228–242.
- Braun, A. (2019). Radar satellite imagery for humanitarian response - bridging the gap between technology and application. Tübingen: University of Tübingen.
- Braun, A., Lang, S., & Hochschild, V. (2016). Impact of refugee camps on their environment - a case study using multi-temporal SAR data. Journal of Geography, Environment and Earth Science International, 4(2), 1–17. doi:10.9734/JGEESI
- Campbell, J.B. (2002). Introduction to remote sensing. New York: The Guilford Press.
- Center for International Earth Science Information Network (CIESIN). (2016). Gridded population of the World, Version 4 (GPWv4). Palisades, NY: NASA Socioeconomic Data and Applications Center (SEDAC).
- Checchi, F., Stewart, B.T., Palmer, J.J., & Grundy, C. (2013). Validity and feasibility of a satellite imagery-based method for rapid estimation of displaced populations. International Journal of Health Geographics, 12(4), 1–12. doi:10.1186/1476-072X-12-4
- Chen, J., Zhou, Y., Zipf, A., & Fan, H. (2018). Deep learning from multiple crowds: A case study of humanitarian mapping. IEEE Transactions on Geoscience and Remote Sensing 57(3): 1713-1722.
- Denis, G., de Boissezon, H., Hosford, S., Pasco, X., Montfort, B., & Ranera, F. (2016). The evolution of Earth observation satellites in Europe and its impact on the performance of emergency response services. Acta Astronautica, 127, 619–633. doi:10.1016/j.actaastro.2016.06.012
- Di Gregorio, A., & Jansen, L.J.M. (2005). Land cover classification system (LCCS): Classification concepts and user manual. Rome: Food and Agriculture Organisation (FAO).
- Ehrlich, D., Lang, S., Laneve, G., Mubareka, S., Schneiderbauer, S., & Tiede, D. (2009). Can Earth observation help to improve information on population? Indirect population estimations from EO derived geospatial data. In B. Jasani, M. Pesaresi, S. Schneiderbauer, & G. Zeug (Eds.), Remote sensing from space supporting international peace and security (pp. 211–237). Berlin: Springer.
- Elia, A., Balbo, S., & Boccardo, P. (2018). A quality comparison between professional and crowdsourced data in emergency mapping for potential cooperation of the services. European Journal of Remote Sensing, 51(1), 572–586. doi:10.1080/22797254.2018.1460567
- Elwood, S. (2008). Volunteered geographic information: Key questions, concepts and methods to guide emerging research and practice. GeoJournal, 72, 133–135. doi:10.1007/s10708-008-9187-z
- European Commission. (2015). Copernicus emergency management service mapping manual of operational procedures. Brussels: DG GROW, DG ECHO & DG JRC.
- European Commission, Joint Research Centre (JRC), & Center for International Earth Science Information Network (CIESIN). (2015). GHS population grid, derived from GPW4, multitemporal (1975, 1990, 2000, 2015).
- European Parliament & Council. (2014). Regulation (EU) No 377/2014 establishing the Copernicus Programme and repealing.
- Füreder, P., Lang, S., Hagenlocher, M., Tiede, D., Wendt, L., & Rogenhofer, E. (2015). Earth observation and GIS to support humanitarian operations in refugee/IDP camps. In B. Palen, Comes, & Hughes (Eds.), Geospatial Data and Geographical Information Science - Proceedings of the ISCRAM 2015 Conference. Kristiansand.
- Füreder, P., Lang, S., Rogenhofer, E., Tiede, D., & Papp, A. (2015). Monitoring displaced people in crisis situations using multi-temporal VHR satellite data during humanitarian operations in South Sudan. In A. Car, T. Jekel, J. Strobl, & G. Griesebner (Eds.), GI_Forum 2015 – Geospatial minds for society (pp. 391–401). Vienna: Verlag der Österreichischen Akademie der Wissenschaften.
- German Aerospace Center (DLR). (2016). Global Urban Footprint (GUF) - TSX/TDX - Global. Retrieved from http://g.gdk99ffm.testbed.gdi-de.org/geonetwork/srv/api/records/5fd5bf46-ba85-4672-a4d0-76f322c69201.
- Ghorbanzadeh, O., Tiede, D., Dabiri, Z., Sudmanns, M., & Lang, S. (2018). Dwelling extraction in refugee camps using CNN - first experiences and lessons learnt. The International Archives of the Photogrammetry, Remote Sensing and Spatial Information Sciences, XLII(1), 161–168. doi:10.5194/isprs-archives-XLII-1-161-2018
- Giada, S., de Groeve, T., & Ehrlich, D. (2003). Information extraction from very high resolution satellite imagery over Lukole refugee camp, Tanzania. International Journal of Remote Sensing, 24(22), 4251–4266. doi:10.1080/0143116021000035021
- Grundy, C., Füreder, P., Siddique, R., Katsuva Sibongwe, D., Tiede, D., Lang, S., & Checchi, F. (2012) Validation of satellite imagery methods to estimate population size. Paper presented at the MSF Scientific Day, London.
- Hagenlocher, M., Lang, S., & Tiede, D. (2012). Integrated assessment of the environmental impact of an IDP camp in Sudan based on very high resolution multi-temporal satellite imagery. Remote Sensing of Environment, 126, 27–38. doi:10.1016/j.rse.2012.08.010
- Harvard Humanitarian Initiative. (2015). Annual report 2015. Technical report. Retrieved from https://hhi.harvard.edu/sites/default/files/hhi_year_end_report_2015_web.pdf
- Hofmann, P., Taubenböck, H., & Werthmann, C. (2015). Monitoring and modelling of informal settlements – A review on recent developments and challenges. Paper presented at the Joint Urban Remote Sensing Event (JURSE 2015), Lausanne, Switzerland.
- Hu, X., Zhang, Z., & Tao, C. (2004). A robust method for semi-automatic extraction of road centerlines using a piecewise parabolic model and least square template matching. Photogrammetric Engineering & Remote Sensing, 70(12), 1393–1398. doi:10.14358/PERS.70.12.1393
- Jiang, W., He, G., Long, T., & Liu, H. (2017). Ongoing conflict makes Yemen dark: From the perspective of nighttime light. Remote Sensing, 9(8), 798. doi:10.3390/rs9080798
- Kelly, C. (1998). Bridging the gap: Remote sensing and needs assessment—A field experience with displaced populations. Safety Science, 30, 123–129. doi:10.1016/S0925-7535(98)00040-X
- Kemper, T., & Heinzel, J. (2014). Mapping and monitoring of refugees and internally displaced people using EO data. In Q. Weng (Ed.), Global urban monitoring and assessment through earth observation (pp. 195–216). Boca Raton: CRC Press.
- Kemper, T., Jenerowicz, M., Gueguen, L., & Poli, D. (2011). Monitoring changes in the Menik Farm IDP camps in Sri Lanka using multi-temporal very high-resolution satellite data. International Journal of Digital Earth, 4, 91–106. doi:10.1080/17538947.2010.512430
- Kranz, O., Sachs, A., & Lang, S. (2015). Assessment of environmental changes induced by internally displaced person (IDP) camps in the Darfur region, Sudan, based on multi-temporal MODIS data. International Journal of Remote Sensing, 36(1), 190–210. doi:10.1080/01431161.2014.999386
- Kulessa, K., & Lang, S. (2016). 3D object-based feature extraction from 3-stereo DSM in urban context. Twente: GEOBIA 2016: Solutions and Synergies.
- Laneve, G., Santilli, G., & Lingenfelder, I. (2006). Development of automatic techniques for refugee camps monitoring using very high spatial resolution (VHSR) satellite imagery. IGARSS Conference, Denver, Colorado.
- Lang, S., Füreder, P., Kranz, O., Card, B., Roberts, S., & Papp, A. (2015). Humanitarian emergencies: Causes, traits and impacts as observed by remote sensing. In P. Thenkabail (Ed.), Remote sensing handbook (Vol. III, pp. 483–512). Water Resources, Disasters, and Urban. New York: Taylor and Francis.
- Lang, S., Füreder, P., & Rogenhofer, E. (2018). Earth observation for humanitarian operations. In C. Al-Ekabi & S. Ferretti (Eds.), Yearbook on Space policy 2016 “Space for sustainable development” (pp. 217–229). Berlin: Springer.
- Lang, S., Schoepfer, E., Zeil, P., & Riedler, B. (2017). Earth observation for humanitarian assistance. GI Forum - Journal for Geographic Information Science, 1/2017, 157–165.
- Lang, S., Tiede, D., Hölbling, D., Füreder, P., & Zeil, P. (2010). EO-based ex-post assessment of IDP camp evolution and population dynamics in Zam Zam, Darfur. International Journal of Remote Sensing, 31(21), 5709–5731. doi:10.1080/01431161.2010.496803
- Lüthje, F., Tiede, D., & Eisank, C. (2014). Object-based DTM generation from VHR stereo imagery derived DSM data sets. South-Eastern European Journal of Earth Observation and Geomatics, 3, 109–113.
- Oak Ridge National Laboratory. 2019. Landscan 2000 Global population database. Retrieved from http://sedac.ciesin.columbia.edu/plue/gpw/landscan.
- Puissant, A., Zhang, W., & Skupinski, G. (2012). Urban morphology analysis by high and very high spatial resolution remote sensing. - Rio de Janeiro - Brazil. Proceedings of the 4th GEOBIA, Rio de Janeiro.
- Quinn, J.A., Nyhan, M.M., Navarro, C., Coluccia, D., Bromley, L., & Luengo-Oroz, M. (2018). Humanitarian applications of machine learning with remote-sensing data: Review and case study in refugee settlement mapping. Philosophical Transactions of the Royal Society A, 376(2128). doi:10.1098/rsta.2017.0363
- Riedler, B., Bäuerl, M., Wendt, L., Kulessa, K., & Öze, A. (2017). Remote sensing applications to support rehabilitation of water infrastructure in Lapilang, Nepal. GI Forum - Journal for Geographic Information Science, 2017(1), 183–198. doi:10.1553/giscience2017_01_s183
- SBTF. (2011). Crowdsourcing satellite imagery analysis for UNHCR-Somalia: Latest results. http://blog.standbytaskforce.com/2011/11/10/unhcr-somalia-latest-results/
- School of Geography and Environmental Science - Univ Southampton, Dept of Geography and Geosciences - Univ Louisville, Dept de Geographie - Univ Namur, & Center for International Earth Science Information Network (CIESIN). (2018). WorldPop - Global High Resolution Population Denominators Project - Funded by The Bill and Melinda Gates Foundation (OPP1134076).
- Schörghofer, R., Lang, S., Wendt, L., & Riedler, B. (2017). CMaP - collaborative mapping platform for humanitarian organisations. GI Forum - Journal for Geographic Information Science, 1/2017, 207–216.
- Spröhnle, K., Fuchs, E.M., & Pelizari, P.A. (2017). Object-based analysis and fusion of optical and SAR satellite data for dwelling detection in refugee camps. IEEE Journal of Selected Topics in Applied Earth Observations and Remote Sensing, 99, 1–12.
- Spröhnle, K., Tiede, D., Schoepfer, E., Füreder, P., Svanberg, A., & Rost, T. (2014). Earth observation-based dwelling detection approaches in a highly complex refugee camp environment — A comparative study. Remote Sensing, 6(10), 9277–9297. doi:10.3390/rs6109277
- Stängel, M., Tiede, D., Lüthje, F., Füreder, P., & Lang, S. (2014). Object-based image analysis using VHR satellite imagery for monitoring the dismantling of a refugee camp after a crisis: The case of Lukole, Tanzania. In R. Vogler, A. Car, J. Strobl, & G. Griesebner (Eds.), GI_Forum 2014. Geospatial innovation for society (pp. 45–48). Wien/Berlin: Verlag der Österreichischen Akademie der Wissenschaften/VDE Verlag GmbH.
- Stevens, F.R., Gaughan, A.E., Linard, C., & Tatem, A.J. (2015). Disaggregating census data for population mapping using random forests with remotely-sensed and ancillary data. PloS One, 10(2), e0107042. doi:10.1371/journal.pone.0107042
- Sudmanns, M., Tiede, D., Wendt, L., & Baraldi, A. (2017). Automatic ex-post flood assessment using long time series of optical Earth observation images. GI Forum - Journal for Geographic Information Science, 2017/1, 217–227. doi:10.1553/giscience2017_01_s217
- Tiede, D., Baraldi, A., Sudmanns, M., Belgiu, M., & Lang, S. (2017). Architecture and prototypical implementation of a semantic querying system for big Earth observation image bases. European Journal of Remote Sensing, 50, 452–463. doi:10.1080/22797254.2017.1357432
- Tiede, D., Füreder, P., Lang, S., Hölbling, D., & Zeil, P. (2013). Automated analysis of satellite imagery to provide information products for humanitarian relief operations in refugee camps – From scientific development towards operational services. PFG Photogrammetrie - Fernerkundung - Geoinformation, 3, 185–195. doi:10.1127/1432-8364/2013/0169
- Tiede, D., Krafft, P., Füreder, P., & Lang, S. (2017). Stratified template matching to support refugee camp analysis in OBIA workflows. Remote Sensing, 9(326), 326. doi:10.3390/rs9040326
- UNHCR. (2017). Global Trends: Forced Displacement iin 2017. http://www.unhcr.org/5b27be547.pdf
- United Nations. (2014). World Urbanization Prospects: The 2014 revision: Highlights; ST/ESA/SER.A/352. United Nations: New York.
- Voigt, S., Giulio-Tonolo, F., Lyons, J., Kučera, J., Jones, B., Schneiderhan, T., … Guha-Sapir, D. (2016). Global trends in satellite-based emergency mapping. Science, 253(6296), 247–252. doi:10.1126/science.aad8728
- Voigt, S., Kemper, T., Riedlinger, T., Kiefl, R., Scholte, K., & Mehl, H. (2007). Satellite image analysis for disaster and crisis-management support. IEEE Transactions on Geoscience and Remote Sensing, 45(6), 1520–1528. doi:10.1109/TGRS.2007.895830
- Voigt, S., Schoepfer, E., Fourie, C., & Mager, A. (2014). Towards semi-automated satellite mapping for humanitarian situational awareness. San Jose, CA: Global Humanitarian Technology Conference (GHTC).
- Wendt, L., Hilberg, S., Robl, J., Hochschild, V., Rogenhofer, E., Füreder, P., … Zeil, P. (2014). Assisting the exploration of groundwater near refugee/IDP camps using remote sensing and GIS. Gemeinsame Tagung 2014 der DGfK, der DGPF, der GfGI und des GiN, Hamburg.
- Wendt, L., Lang, S., & Rogenhofer, E. (2017). Monitoring of refugee and IDP camps with Sentinel 2 imagery – A feasibility study. GI Forum - Journal for Geographic Information Science, 1/2017, 172–182.
- Witmer, F.D.W., & O’Loughlin, J. (2011). Detecting the effects of wars in the caucasus regions of Russia and Georgia using radiometrically normalized DMSP-OLS nighttime lights imagery. Remote Sensing, 48, 478–500. doi:10.2747/1548-1603.48.4.478
- Zeil, P., Ourevitch, S., Debien, A., & Pico, U. (2017). The copernicus user uptake – Copernicus relays and copernicus academy. GI Forum - Journal for Geographic Information Science, (1), 253–259.
- Zhu, X.X., Tuia, D., Mou, L., Xia, G.S., Zhang, L., Xu, F., & Fraundorfer, F. (2017). Deep learning in remote sensing - a review. IEEE Geoscience and Remote Sensing Magazine, 5(4), 8–36. doi:10.1109/MGRS.2017.2762307