
 ?Mathematical formulae have been encoded as MathML and are displayed in this HTML version using MathJax in order to improve their display. Uncheck the box to turn MathJax off. This feature requires Javascript. Click on a formula to zoom.
ABSTRACT
The availability and usage of optical very high spatial resolution (VHR) satellite images for efficient support of refugee/IDP (internally displaced people) camp planning and humanitarian aid are growing. In this research, an integrated approach was used for dwelling classification from VHR satellite images, which applied the preliminary results of a convolutional neural network (CNN) model as input data for an object-based image analysis (OBIA) knowledge-based semantic classification method. Unlike standard pixel-based classification methods that usually are applied for the CNN model, our integrated approach aggregates CNN results on separately delineated objects as the basic units of a rule-based classification, to include additional prior-knowledge and spatial concepts in the final instance segmentation. An object-based accuracy assessment methodology was used to assess the accuracy of the classified dwelling categories on a single object-level. Our findings reveal accuracies of more than 90% for each applied parameter of precision, recall and F1-score. We conclude that integrating the CNN models with the OBIA capabilities can be considered an efficient approach for dwelling extraction and classification, integrating not only sample derived knowledge but also prior-knowledge about refugee/IDP camp situations, like dwellings size constraints and additional context.
Introduction
Both human-made and natural disasters are the main reasons of population displacement. According to (UNHCR, Citation2019), almost 70.8 million individuals were forcibly displaced worldwide as a result of persecution, conflict, violence, or human rights violations. Refugee and IDP (internally displaced people) camps are often the first accommodation for people who have been forced to flee their home. The availability of very high resolution (VHR) remote sensing (RS) images is growing because of the continuous development of advanced RS related technologies (G. Zhang et al., Citation2018). Nowadays, VHR satellite images are widely used for efficient support of camp planning and delivery of humanitarian aid (Witmer, Citation2015). Firstly, these satellite images have significant potential to provide humanitarian organisations with spatial information of difficult to access areas. Secondly, for large and complex refugee/IDP camps, VHR RS images make it possible to have a deeper and better understanding of the camp situation and camp dynamic at lower costs compared to traditional surveys and often as the only possibility due to security and accessibility reasons (Lang et al., Citation2019a). Therefore, VHR RS imagery is considered as the primary source of information for identifying the number, type and size of dwellings which can serve – amongst others as the input for an estimation about the number of people in such camps (using the dwellings as proxies).
Automated processing of the satellite images to produce applicable high-level information is still a challenging task. To extract and categorise dwelling types from RS images, previous studies have used various approaches as an alternative to visual interpretation, such as template-matching (Tiede et al., Citation2017), (semi-)automated workflows (Spröhnle et al., Citation2014), object-based image analysis (OBIA) (Lüthje et al., Citation2015; Tiede et al., Citation2010), mathematical morphology-based algorithms (Laneve et al., Citation2006), convolutional neural networks (CNNs) (Ghorbanzadeh et al., Citation2018a, Citation2018b; Quinn et al., Citation2018). Visual interpretation approaches have some major drawbacks: they depend on the expert’s experience to annotate different types of dwellings, and are expensive, as they are labour-intensive and time-consuming. Pixel-based approaches face severe problems in single dwellings extractions from VHR RS image, since they denote just a small fragment of a dwelling without taking into account spatial properties (like size/form, context), and usually fail in correctly extract dwellings and categorise them into different types.
OBIA deals with the shortcomings of pixel-based classification methods by grouping pixels into spectrally similar non-overlapping segments utilising abundant features (Blaschke, Citation2010; Jozdani et al., Citation2019). A key element of OBIA is image segmentation whose aim is to generate image objects suitable for further classifications of spatial properties and context (Blaschke & Piralilou, Citation2018; Lang et al., Citation2019b). OBIA has been successfully used in multiple applications (Blaschke et al., Citation2014; Tavakkoli Piralilou et al., Citation2019) during the past few decades.
Whenever the segmentation process produces the objects that are used for the classification, the result may be influenced by the quality of this process (Pan et al., Citation2019). Especially, in the case of camps, some materials that are used to construct dwellings may produce higher colour contrast than other making it difficult to extract and categorise the different type of dwellings without any prior context knowledge or complex rulesets.
During the past decade, deep-learning methods, and in particular CNNs, have achieved cutting edge success in the computer vision (Krizhevsky et al., Citation2012), and are also used for RS image classification (Zhu et al., Citation2017). Compared to traditional pixel-based algorithms, they integrate spatial context and texture of images in the analysis process by design to some degree. Recently, the DeepGlobe 2018 datasets were introduced by (Demir et al., Citation2018) as datasets that can be considered as valuable benchmarks in satellite image processing to show the priority of any novel approach in this domain. CNNs have showed some improvements in classification and semantic segmentation of RS images (Du et al., Citation2019; Qayyum et al., Citation2019), object detection (Ghorbanzadeh & Blaschke, Citation2019; Guirado et al., Citation2017; Sameen & Pradhan, Citation2019) scene classification (Han et al., Citation2017), instance-aware semantic segmentation and instance segmentation (Dai et al., Citation2016; Iglovikov et al., Citation2018). In the case of semantic segmentation, each single pixel is labelled, while in the case of instance segmentation, instead of connecting each pixel to a label, target objects will be classified, and only pixels of those objects are labelled (Panboonyuen et al., Citation2019). Multiple hierarchical stacking and trainable layers of a CNN can learn characteristic features and abstractions from raw RS images (Fu et al., Citation2019).
Although CNNs have shown some of the state-of-the-art baselines in the mentioned domains, they still face some challenges. Generally, CNN-based models implement classification on the pixel level (Jin et al., Citation2019). Those cannot easily identify object borders and transitional zones of different dwelling types or other existing objects. The problem is even more apparent when we encounter non-regular camp structures and aim to also extract small types of dwellings (Ghorbanzadeh et al., Citation2018b). Solutions to overcome these difficulties were suggested, such as training data augmentation (Radovic et al., Citation2017), CNN model structure modification or using deeper CNN models (Sameen & Pradhan, Citation2019) with more hidden layers and nodes, which led to marginal improvements (Lin et al., Citation2016), using pre-trained CNN models and fine-tuning them to the new applications (Castelluccio et al., Citation2015). However, such solutions have some limitations such as overfitting problems (Hu et al., Citation2015). Even if it was found that training data augmentation helps enhance the classification performance, it could increase the dependency of the CNNs on the training sample size (Jin et al., Citation2019). Although OBIA methods have several advantages and are considered as advantageous compared to pixel-based ones especially in HR/VHR imagery, most of the CNN applications for the RS images rely on the pixel-based method (Liu & Abd-Elrahman, Citation2018). Any image understanding process (i.e., image classification and object annotation) using CNN models require the input training data to be fixed-size square window sample patches of pixels. (Ghorbanzadeh et al., Citation2019) applied CNN models with different layer depths to extract slope failures (as a spatial feature) within different window sizes ranging from 12 to 48 pixels. (Sameen & Pradhan, Citation2019) trained different CNN models using the same window size patches of 15 pixels from RS imageries. However, the target objects in RS images usually exhibit a wide range of different sizes. Focusing on the larger objects requires large window size patches. At the same time, using a large fixed-size window can make it challenging to annotate small target features (Liu et al., Citation2019). Distances between closely located dwellings, for instance, are very short, and using a large fixed-size window has the effect that a large part of the window is filled with dwelling bodies, which might mislead a CNN to classify all area as only one huge dwelling.
So far, a limited number of studies tried to use capabilities of both CNN models and OBIA methods. Lv et al. (Lv et al., Citation2018) set multi-scale samples with six different window sizes from 15 to 65 using CNN model integrated with a segmentation process and a majority voting strategy to solve the boundary problem in urban image classification. Zhao et al. (Zhao et al., Citation2017) used a fixed-size square window of 18 pixels applied in a five-layer CNN to classify complex urban objects in high-resolution RS images. An object-based classification method was then applied to classify the resulting features from the CNN model. A similar approach was used to integrate OpenStreetMap data in an object-based CNN approach within the urban area (Zhao et al., Citation2019). Liu et al. (S. Liu et al., Citation2019) applied OBIA as a post-classification to refine the LULC mapping based on a CNN model using Sentinel optical and SAR data. Their proposed approach improved the overall accuracy of LULC mapping for different datasets including the Sentinel Guangzhou, the Zhuhai-Macau LCZ, and University of Pavia dataset. The use of image patches as input data form for training CNN models provides a natural opportunity to use them in the OBIA approach, and have shown higher performance in the object-based RS applications (S. Liu et al., Citation2019).
The studies mentioned in our literature review tried to deal with the challenges of intra-class heterogeneity, inter-class homogeneity, and delineate more accurate object boundaries in the semantic classifications. Some instances of intra-class heterogeneity and inter-class homogeneity in our case of dwelling classification of refugee/IDP camps are represented in . In our study, an integration approach of a CNN model with an OBIA classification method is presented for classification of bright dwellings of an of IDP camp. Our main purpose is evaluating our proposed solution of physically incorporating the concept of the object to a CNN model. Therefore, our focus is not to evaluate the performance of different existing CNN structures or designs for state-of-the-art dwelling classification. Our contribution is to show possibilities for integrating expert knowledge through the OBIA rulesets to the decision making step of a CNN model. Thus, any CNN model can be applied for this aim and a non-complex designed one is much more desired to represent the integration capabilities rather than a complex one. The significant contributions are: (1) training a CNN model with a time series of images and testing the model on an image of a new date where no samples were seen by the algorithm at all; (2) implementing on top of the CNN results a straight-forward rule-based OBIA method for dwelling classification including the probabilities of the CNN model and encoding expert knowledge about dwelling size and distribution; (3) applying an object-based accuracy assessment methodology to evaluate the results of our integrated approach.
Figure 1. Instances of intra-class heterogeneity challenge among the different dwelling classes in VHR RS images of refugee/IDP camps, taken from expert interpretations (see text for further explanation): (a) and (d) large dwellings (blue colour) are different in shapes (e.g., rectangular and circle) and colours (e.g., white and grey), but – according to their function – they belong to the same semantic class of Facility Buildings. (b) The same situation as for Facility Buildings applies to the drop shape dwellings (yellow colour). Although they appear in different shapes (e.g., circle and drop shape), they belong to the same semantic class. (c) and (d) present examples for inter-class similarity: (c) Some large dwellings and rectangular ones (pink colour) look similar, but they are considered to be two different semantic classes. (d) (1, 2, and 3) are also looking very similar in shape and colour, but they belong to three different classes of (1) Facility Buildings, (2) drop shape and (3) rectangular dwellings
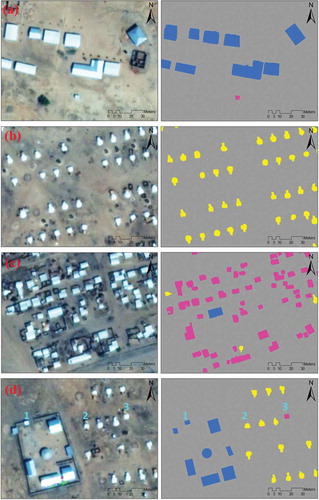
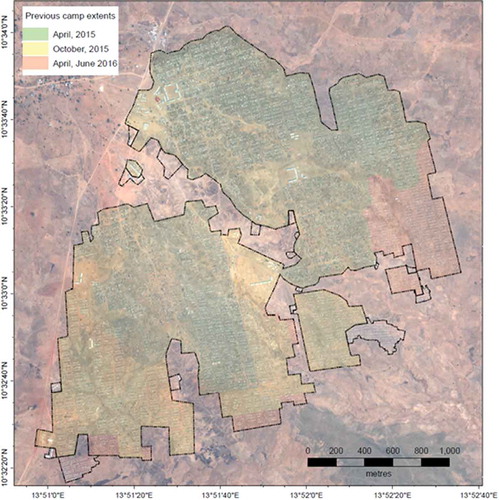
Figure 2. Refugee camp Minawao in the Far North Region of Cameron: Camp extent on 12. Feb 2017 and previous camp extents (coloured)
Workflow
Overall methodology
In this study, we integrate a CNN model with an OBIA classification method for the extraction of different dwelling types of the Minawao refugee camp in Cameroon. The workflow of this study is as follows:
Prepare a manually labelled dataset based on different VHR images from different sensors acquired in two different years (2015 and 2016) of a very dynamic refugee camp.
Establish a CNN model concerning the considered input window size patches of the applied RS imageries.
Apply OBIA classification (rule-set integrating expert knowledge) to the probability values of different dwellings and non-target classes based on the CNN results.
Apply an object-based accuracy assessment to validate the model performance.
The description of the applied integrated approach, the experimental results, further explanations and discussions are organised in the following sections of this paper.
Data collection
The test site for this study is the camp Minawao in the Far North Region of Cameroon, at 10°33ʹ30” N 13°51ʹ30”E (see ). This refugee camp is run by UNHCR, and mainly houses refugees from the neighbouring Nigerian Borno State, where activities of the Boko Haram militia forced over 240,000 people to flee their homes (UNHCR, Citation2019). The camp has existed since 2012. Population numbers started to increase rapidly from early 2014 onwards, and by the time of the first image, acquisition on 12 April 2015 the camp housed approximately 34,000 people. Over the period considered in this study, the population grew to approximately 61,000 inhabitants (Wendt et al., Citation2017). During this time, the camp extent grew from ~230 ha to 625 ha. The camp still hosts nearly 60,000 people (UNHCR, Citation2019). An operational service produced the training and test data used in this study for humanitarian mapping at the University of Salzburg, Department of Geoinformatics (Z_GIS) in the context of mapping requests from Doctors without Borders (MSF) within the last years. The existing classifications are based on the semi-automated method, i.e. the output is subsequently refined manually and validated by a trained operator. Information products based on dwelling extractions are used operationally by MSF to obtain population numbers independently from the inhabitant registration system run by UNHCR, and for the planning of healthcare, water and sanitation services and campaigns.
The training data set was prepared based on RS images from different sources and times. The input data are taken from WorldView-3 images captured on 12th April and 13 October 2015, with four spectral bands, blue (450–510 nm), green (510–580 nm), red (630–690 nm), and near-infrared (770–895 nm). In addition, we used a GeoEye-1 image acquired on 1 April 2016 with blue (450–510 nm), green (510–580 nm), red (655–690 nm), and near-infrared (780–920 nm) spectral bands. The last image we used to produce the training data set was a WorldView-2 image captured on 3 June 2016.
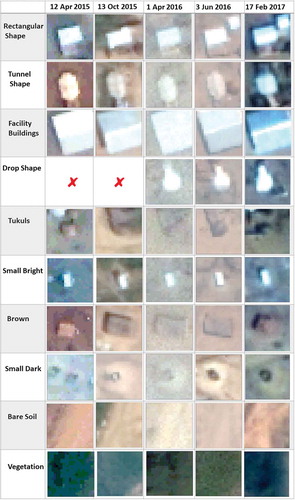
A WorldView-2 image, acquired on 17 February 2017 from the same IDP camp was used for testing the integrated approach. The same spectral bands of this image were applied for the test process. All dwellings were extracted and labelled manually in the context of an operational humanitarian mapping task by experts of the University of Salzburg. For all labelled objects, the centroids were taken to create convolution input sample patches (see ). A data augmentation method of shifting window was used for increasing the number of sample patches of those dwelling classes, which were less in number than the other classes. Also, the numbers of each dwelling type differ at different times. For example, tunnel shape dwellings decreased strongly from 2015 to 2016; they were replaced with other types of dwellings. Drop shape dwellings emerged in 2016 with no occurrence of this type before. Therefore, data augmentation helped keep the balance between different types of classes. shows the number of convolution input sample patches of each class. The table also indicates the number of produced sample patches and not the number of objects in each class. Moreover, the 2017 image was used for testing our approach; no image patches were created from this image. shows examples of selected convolution input sample patches for each class from each image.
Figure 3. An illustration of convolution input sample patches selecting based on the position of the centroid of any labelled object
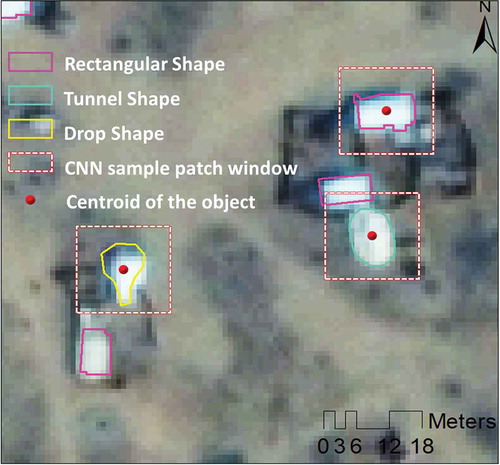
Table 1. The figure in the table indicates the number of training sample patches per different target dwelling class (bright dwellings) and non-target classes (small dark structures, bare soil etc.). Numbers of samples are different from the real mapped dwellings, due to the applied augmentation routines to improve the balance between the different classes
Figure 4. Examples of convolution input sample patches for each class and image
Convolution neural network (CNN)
CNNs have led in the state-of-the-art feature extraction results and are considered a hot topic in the image processing and computer vision fields, which gradually overcome traditional methods (Pena et al., Citation2019). CNNs as kind of mature network of deep learning model is inspired from the biological multi-layer neural networks architectures, which enable them to form high-level semantic features from the existing low-level features in an image (Jin et al., Citation2019). Multi-layer neural networks are interconnected to each other by a set of learnable weights and biases. The input of layers is small patches of the image that move over the entire image to obtain different feature characteristics (C. Zhang et al., Citation2018). These image patches are generalised through two main blocks of any CNN model including convolutional and pooling layers and generate a group of feature maps. The resulting feature maps from each layer feed-forward to the next layers until the high-level semantic features are captured (Ghorbanzadeh et al., Citation2019). Feed forwarding of the feature maps enables the learnable filters of convolution layer to learn by different feature extractors and large amount of image patches required to learn (Maggiori et al., Citation2017) appropriately. Since the local features are translation-invariant, the extracted features are more important than their location in the training data (Yang et al., Citation2017). The pooling layer is applied in a local window on the resulting feature maps from each convolution layer. The condensed feature maps by the pooling layer are usually insensitive to spatial translations (Yang et al., Citation2017). Although pooling layers have performed using the average or summing functions, the pooling layer using the max value, the so-called max-pooling, is the most common, and it keeps only the maximal values of the feature maps. Furthermore, an elementwise non-linear activation function (e.g., ReLU, sigmoid, and hyperbolic tangent) is taken for non-linearity amplification of the convolutional layers.
In the present study, we considered different sizes of dwellings and different distances between pairwise dwellings, and multiple sample patch window sizes of 16 × 16, 20 × 20, 32 × 32 pixels. Using cross-validation, the sample patch window size of 20 × 20 pixels was selected as the optimal one for further processes. Although some current studies attempt to find an automatic framework of the optimal CNN architecture for their datasets (e.g., Pavia University Scene Data) (Hang et al., Citation2019), their transferability to other cases such as dwelling detection is not clear. Since designing the optimal architecture for each specific training dataset remains under-explored, some researchers like (Ghorbanzadeh et al., Citation2019) and (Sameen & Pradhan, Citation2019) applied different CNN architectures and compared the results. The patch window sizes are considered as one of the most critical parameters in optimal CNN architecture and consequently the number of convolution/pooling layers and the size of applied kernels (Ghorbanzadeh et al., Citation2019). In this study, considering the size of our optimal sample patch window, the number of network layers was tuned to five (see ). The CNN was using a convolution layer with a kernel size of 5 × 5 and stride of 1 as the first convolution layer and continuing with additional convolution layers with the kernel size of 3 × 3 after the only max-pooling layer. As our sample patch window size is relatively small (20 × 20 pixels), only one max-pooling layer (with a kernel size of 2 × 2 and stride of 2) was used immediately after the first convolution layer. Therefore, the information loss to the next convolution layers is minimised. In this case, our designed CNN was fed by the sample patches of 20 × 20 × 4 units, where 20 × 20 is the window size of the input sample patches, and 4 is the number of spectral bands (RGB and NIR). These sample patches were selected out of 6301 × 6201 pixels of the labelled original images. Different numbers of feature maps were used in each layer. The CNN model was designed and trained in Trimble’s eCognition software, based on the Google TensorFlow software library. In the model, batch normalisation (BN) layers were applied after all convolution layers to have higher learning rates. Using the BN helps reduce overfitting by improving the capacity of generalisation of the CNN architecture and increasing the speed of its learning process by accelerating the convergence (Pena et al., Citation2019). The learning rate of this work is featured a gradual reduction starting from 0.001 dropping down to learning rate of 0.0006, which resulted in an acceptable performance within cross-validation. Lower learning rates increase the time of the learning process and the chance of being stuck in local minima and subsequently end up with incorrect weights. Although higher learning rates like 0.001 would increase the speed of the learning process, the network may not reach the minimum and again get wrong weights. A batch size of 50 and 5000 training steps were used in this work to obtain the best performance.
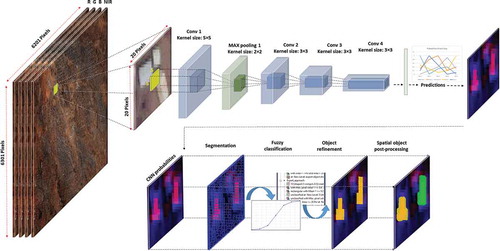
Figure 5. The structure of the applied CNN-OBIA approach and the applied parameter settings in this study
Object-based image analysis (OBIA)
For each pixel, the predictions of the CNN model are 10-dimensional vectors P = (p1, p2, … p10), where 10 is the number of classes including both our target and non-target classes, and each dimension I ε [1,2, …, 10] indicates the CNN model-predicted probability of the ith semantic class. In an ideal case, the probability should be 1 for a specific class and 0 for the other ones, which is usually not the case in real-world situations. The resulting probability for each semantic class can be easily shown as (x) = (px|X ε [1, 2, …, 10]), where px ε [0,1] and (Li et al., Citation2019). After the image segmentation, the corresponding probability of each resulting object is different (object-mean). For our case, the resulting probability for each semantic class within an object can be presented as f(y) = (py|y ε [1, 2, …, 10]), where py ε [0,1] and
(see and ). The segmentation applied was a multi-resolution segmentation (Baatz & Schaepe, Citation2000) based on 4 pan-sharpened spectral bands (R-G-B-NIR), the variance-based homogeneity parameter (the so-called scale parameter) has been intentionally set to a low value of 10 to achieve over-segmentation and to avoid any under segmentation of target objects. Shape and compactness parameters of the algorithm were equally weighted with 0.5 aiming for quite compact objects. Target objects were then merged and classified based on a combination of context/neighbourhood, spatial properties and similarity in the CNN probability results for the different target and non-target classes, which improved the segmentation results in contrast to an unsupervised segmentation (see ). This second supervised segmentation/classification step is implemented as a rule-set in CNL (Cognition Network Language within eCognition) able to address and manipulate single objects based on expert knowledge and included:
Figure 6. A local result of the multiresolution segmentation (MRS) in conjunction with a second supervised segmentation (object-merging) step based on CNN probability values and context/neighbourhood parameters. Four randomly selected objects (a, b, c, and d) are compared in detail (refer to )
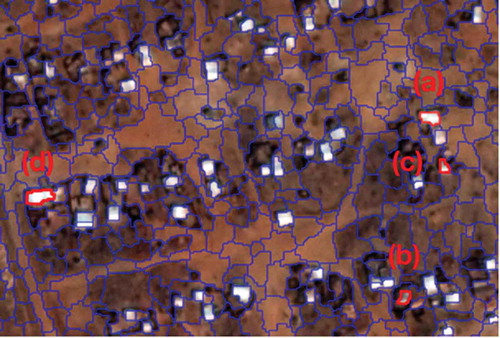
Table 2. Corresponding resulting probability values for randomly selected objects (a, b, c, and d, see ) based on each semantic class
Initial classification of objects, based on the CNN probability values using fuzzy membership values using two features, namely the probability mean values per object and the maximum probability value per image object
Some wrongly classified vegetation objects were eliminated from the list of target objects using an NDVI threshold of 0.3.
The membership values of the different objects are also used in the supervised merging process based on similarity and shared object borders, i.e. an object growing into neighbouring pixel took place if the membership value of that pixel in the specific class was not less than 90% of the growing object. This has been implemented as a loop & merge function.
Post-processing:
o Objects smaller than 3 m2 were not further considered as dwellings,
o Objects classified based on the CNN probability values as Facility Buildings below a size of 50 m2 were reclassified as rectangular dwellings.
o Neighbouring objects classified as Facility Buildings were merged without any size constraint.
o Objects classified as the tunnel and drop shape objects were evaluated using a “rectangular fit” option. The calculation is based on a rectangle with the same area as the image object. The proportions of the rectangle are equal to the proportions of the length to width of the image object. If the rectangular fit was higher than 0.9 (1 indicates a perfect rectangle) the objects were also reclassified as rectangular dwellings
Object-based accuracy assessment
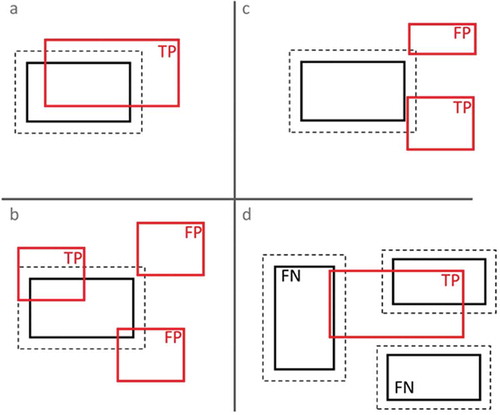
For the target classes a pixel-based accuracy assessment, resulting ratios in the pixel overlap between the reference and the classification were not considered as appropriate. The critical information to be delivered in the present context – supporting humanitarian action – is on number and size per dwelling and aggregated per dwelling type, in order to estimate population figures. Therefore, an object-based accuracy assessment has been conducted. For this, each extracted dwelling objects is spatially compared with the reference objects, similar to the approaches described in Radoux and Bogaert (Citation2017) (Radoux & Bogaert, Citation2017) for spatial entity detection. A tool for assessing a spatially explicit accuracy has been developed in Python and implemented in ArcGIS. The comparison of reference and target dwellings is based on the following schema (see also ):
Figure 7. Object-specific accuracy assessment evaluating different potential cases, resulting in different accuracy aspect: a) Overlap of reference (black) and extracted objects (red) (TP = True positive), b) avoidance of double counts, only the best match is counted, additional overlaps are counted as false positives (FP), c) Overlap calculations includes a user-defined buffer range (here: 2m). Only the best match (i.e. largest overlap) is counted, d) if an extracted object is overlapping more than one reference object, also only the best match is counted as TP, other overlapping (or non-overlapping) reference objects are considered as FN (false negatives)
count how many extracted dwelling‐polygons have an associated reference object and vice versa;
prevent double-counting (if, e.g., a reference polygon is covered by more than one dwelling/object), which would be equal to false positive;
for reference objects with more than one matching extracted object, the most appropriate object is counted (i.e. the object with the largest overlap);
each reference‐object is buffered according to a certain user‐defined distance, e.g., a minimum distance between dwellings (here: 2 m);
Provision of per dwelling area compared to the matching reference (without double counts)
Provision of direct overlap (intersect) between best matches and all matches
The mentioned buffer size ensures to count associated dwellings, which are not directly overlapping the reference due to errors in the classification procedure. In this case, the buffer size is set to 2 m, which reflects the absolute minimum distance between dwellings in refugee camps as recommended by UNHCR camp planning standards.
Using metrics of TP, FP, and FN, standard accuracy assessment parameters of Precision, Recall, and F1 can be calculated for the results. Precision indicates the proportion of target dwellings, which correctly identified by the proposed approach. The recall is the proportion of target dwellings in the labelled data that were correctly detected by the approach. F1 is used to balance Precision and Recall parameters (see Equationequations 1(1)
(1) –Equation3)
(3)
(3) .
The accuracy assessment was conducted for the bright dwelling classes, which are used for housing (target classes). Larger buildings (> 50 m2) were excluded from the reference and the analysed data set since they are in such camps usually not used for population estimations (Facility Buildings etc.).
Experimental results
This paper integrates the probabilities resulting from a CNN model with an OBIA classification method to observe the accuracy of the classification of bright dwellings including Rectangular Shape, Tunnel Shape, Facility Buildings, and Drop Shape in a refugee camp. As there were many changes in this camp over three years (from 2015 to 2017) the transferability of the trained CNN model was a significant issue in our study. Some of the dwellings such as tunnel shape ones gradually disappeared or were replaced with other types, and in most of the cases, the shape of dwellings did change a lot through time.
Moreover, some new dwelling types such as drop shape dwellings appeared in 2016 and increased a lot until 2017, when the integrated approach was tested on that. To keep the balance between the numbers of sample patches in each class of training data a data augmentation was applied for those types of dwellings, which were less than the other ones. After testing the CNN model on the test image, the multi-resolution segmentation (MRS) was used to create the objects for further classification using OBIA. The segmentation process was based on the resulting probabilities of our CNN model and the spectral information of the test image. Therefore, the resulting objects for classification were created based on the feature extraction capabilities of a CNN model. For further classification, the membership values of an initial fuzzy dwelling classification were also used in a supervised merging process based on similarity (of CNN probabilities) and shared object borders. The fuzzy classification method is considered a reliable method for such complex situations. However, the transferability of the model depends on using appropriate membership values.
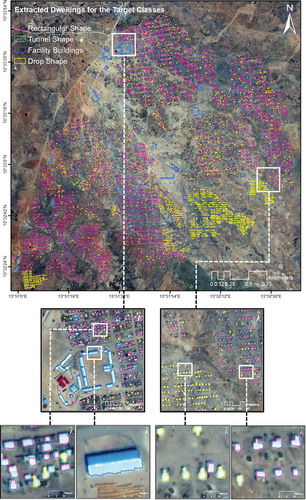
The instance classification results of the target classes on the Minawao refugee camp are shown in . The proposed approach could classify different bright dwellings, and the accuracy assessment was applied to the resulting classification map.
Figure 8. The instance classification map of the target dwellings obtained using the proposed CNN-OBIA approach
Accuracy assessment
As described in the workflow section, the focus of our classification is set on the bright dwelling structures as a proxy for population estimations, other classes (dark structures, vegetation bare soil etc.) are combined as non-target classes in the approach. Such population estimations are usually conducted based on a single dwelling basis, taking into consideration the dwelling types (inhabited or not), dwellings size and the occupancy rates usually estimated from people working in the field (humanitarian organisations, see also (Grundy et al., Citation2012; Lang et al., Citation2010).
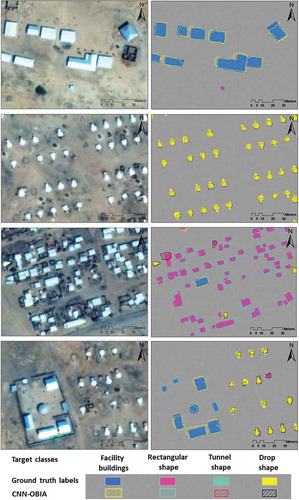
The following table depicts the values for the object-specific accuracy assessment for the target classes (bright dwellings) with the larger structures (Facility Buildings) and without. The accuracy assessment was conducted for the whole camp in the 2017 image. Total values for with and without Facility Buildings reveal a high amount of agreement with the total dwelling numbers. The object-specific accuracy assessment (counting double counts (several overlapping structures) as FPs) also reveal high F1 scores (0.94 incl. Facility Buildings, 0.93 without); precision rates are higher (0.97 both) than the recall values (0.91 and 0.93) (see ). shows enlarged parts of some challenging areas (mentioned in ), which make it possible to visually compare the results of the OBIA-CNN approach with ground truth labels.
Table 3. Results of the object-specific accuracy assessment focusing on the target classes mainly relevant for population estimation in refugee camps (number and size of relevant classes). The second column shows the results without larger dwellings (e.g., Facility Buildings, here: > 50 m2)
Figure 9. Enlarged maps of four challenging areas (mentioned in ) for comparing the results of the OBIA-CNN approach with those of manually extracted labels
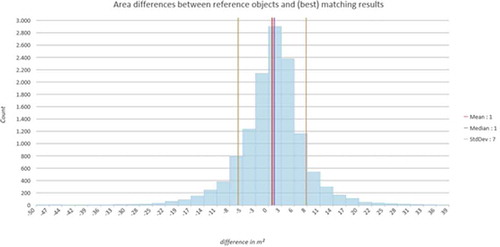
reveals some objects specifics statistics regarding the area of extracted objects (object delineations) and the object sizes of the reference (without Facility Buildings). Most of the objects match well in terms of the area with the reference objects, mean and median are around 1 (slight overestimation) and a standard deviation of around 7 m2 could be reached. These results are quite promising concerning population estimations, where not only the number of dwellings is significant but also the size of the single dwellings, which are determining the occupancy rates. Most of the larger outliers were situations where extracted objects are overlapping more than one reference object, and vice versa, which was then considered as false positive and the corresponding area is set to zero.
Figure 10. Histogram showing the distribution of the matching area between reference objects and extracted objects along with basic descriptive statistics according to the object-specific accuracy assessment. Only best matching objects (as defined in the object-specific accuracy assessment) are taken into consideration (no-double counts etc.). The graph shows the overall well matching of the area on a single dwelling level, which is an important pre-requisite for any population estimation based on population occupation rate per dwellings of different size
Discussion
In this study, we proposed an integration approach that equips a simple CNN model with the OBIA classification capabilities for a refugee camp classification. Our approach was tested on a new image of the camp that was not applied for the training process of the CNN model. It obtained some remarkable classification results with more than 90% accuracies. Such results showed the potentials in the transferability of the integration of the CNN models with knowledge-based OBIA classification methodologies. This study demonstrated the transferability of the approach in terms of using different sensors, different conditions/dates, and partly different dwelling classes and types. Although the approach was applied for different training datasets and images, it was still tested on the same refugee camp and the same geographical conditions.
In contrast to recently published studies of CNN and OBIA integrations that successfully enhanced the overall accuracy by mainly focusing on some post-classification refinements (e.g., adding some auxiliary information) (Li et al., Citation2019; S. Liu et al., Citation2019), our approach is able to incorporate the resulting probabilities of a CNN model alongside with the spectral information of the test image in the OBIA part in an effective manner. Therefore, this study is not a mere refinement of a CNN model resulting classification by an OBIA approach. In addition, as the performance of the segmentation and the classification of the applied OBIA method were based on the spectral information of the test image and the resulting probabilities of the CNN model respectively, expert rules in the OBIA part were as far as possible relying on camp planning standards, size and form differencing as parameters to ensure transferability. The addition of the knowledge-based OBIA part helped to sharpen the delineation of objects compared to the blurred results from the CNN approach only.
Moreover, the OBIA classification fairly avoided intra-class heterogeneity and inter-class homogeneity in dwelling classification, by integrating additional prior-knowledge in the approach. Based on the resulting classification and the corresponding accuracies, this study concludes that a combination of the probability results of the CNN models and an additional OBIA step can play an important role in further classification and mapping. Especially for population estimation based on dwelling type and size, such an approach has advantages e.g., to object-detectors only. Future studies will explore the transferability of the proposed approach between different areas by training and testing on different refugee/IDP camp sites. As already mentioned, a simple CNN model was used in the present study. The switch from merely pixel-based accuracy assessments to an object-based one is in our understanding a step forward: in applications cases, where the delineation of objects is important for further analysis (here: estimation of population figures based on dwelling occupancy rates), such an object-based accuracy approach contributes to accuracy values that are more realistic.
Conclusions
Within the present study, it could be shown, that for the case of refugee/IDP camps and their specific challenges (small size of dwellings, spectral heterogeneity and changing image conditions) a CNN network can be trained on different sensors and acquisition dates, and the successful transferability to a not-sampled image of the same camp – with different camp extents (number of dwellings) – is possible. The object-based approach built on top of the analysis helped to improve the dwelling delineation, which is important for specific dwellings area calculations and subsequent population estimations. We focused on bright dwellings only, the very small scales of darker structures and their problematic separability (also for human interpreters) is still a problem which needs further research. Besides, the transferability of the approach to other camps of similar structure but in different areas and under different (climate) conditions is still an open question. Nevertheless, we think that the work will contribute to further improve the quality of automated solutions and the speed & scale of expert interpretations of such analyses for the humanitarian domain.
Disclosure statement
No potential conflict of interest was reported by the authors.
Additional information
Funding
References
- Baatz, M., & Schaepe, A. (2000). Multiresolution segmentationan optimization approach for high quality multi-scale segmentation. In J. Strobl, T. Blaschke, & G. Griesebner (Eds.), Angewandte Geographische Informationsverarbeitung XII (pp. 1223). Wichmann Verlag, Heidelberg.
- Blaschke, T. (2010). Object based image analysis for remote sensing. ISPRS Journal of Photogrammetry and Remote Sensing, 65(1), 2–16. https://doi.org/10.1016/j.isprsjprs.2009.06.004
- Blaschke, T., Hay, G. J., Kelly, M., Lang, S., Hofmann, P., Addink, E., Feitosa, R. Q., Van der Meer, F., Van der Werff, H., & Van Coillie, F. (2014). Geographic object-based image analysis–towards a new paradigm. ISPRS Journal of Photogrammetry and Remote Sensing, 87, 180–191. https://doi.org/10.1016/j.isprsjprs.2013.09.014
- Blaschke, T., & Piralilou, S. T. (2018) The near-decomposability paradigm re-interpreted for place-based GIS. 1st workshop on platial analysis (PLATIAL’18) (pp. 20–21), Heidelberg, Germany.
- Castelluccio, M., Poggi, G., Sansone, C., & Verdoliva, L. (2015). Land use classification in remote sensing images by convolutional neural networks. arXiv Preprint arXiv:1508.00092(pp, 1-11.).
- Dai, J., He, K., & Sun, J. (2016) Instance-aware semantic segmentation via multi-task network cascades. Proceedings of the IEEE conference on computer vision and pattern recognition (pp. 3150–3158). Las Vegas, Nevada.
- Demir, I., Koperski, K., Lindenbaum, D., Pang, G., Huang, J., Basu, S., Hughes, F., Tuia, D., & Raska, R. (2018) Deepglobe 2018: A challenge to parse the earth through satellite images. 2018 IEEE/CVF conference on computer vision and pattern recognition workshops (CVPRW) (pp. 172–17209), IEEE, Salt Lake City.
- Du, Z., Yang, J., Ou, C., & Zhang, T. (2019). Smallholder crop area mapped with a semantic segmentation deep learning method. Remote Sensing, 11(7), 888. https://doi.org/10.3390/rs11070888
- Fu, Y., Ye, Z., Deng, J., Zheng, X., Huang, Y., Yang, W., Wang, Y., & Wang, K. (2019). Finer resolution mapping of marine aquaculture areas using worldView-2 imagery and a hierarchical cascade convolutional neural network. Remote Sensing, 11(14), 1678. https://doi.org/10.3390/rs11141678
- Ghorbanzadeh, O., & Blaschke, T. (2019) Optimizing sample patches selection of CNN to improve the mIOU on landslide detection. Proceedings of the 5th international conference on geographical information systems theory, applications and management: GISTAM, 1, (pp. 8). Heraklion, Crete, Greece. https://doi.org/http://dx.doi.10.5220/0007675300330040.
- Ghorbanzadeh, O., Blaschke, T., Gholamnia, K., Meena, S. R., Tiede, D., & Aryal, J. (2019). Evaluation of different machine learning methods and deep-learning convolutional neural networks for landslide detection. Remote Sensing, 11(2), 196. https://doi.org/10.3390/rs11020196
- Ghorbanzadeh, O., Tiede, D., Dabiri, Z., & Lang, S. (2018a). Dwelling extraction from satellite imagery in refugee camps: How different sample datasets impact the results of convolutional neural networks (CNN)?. Poster presentation GI_Forum 2018 conference, Salzburg, Austria.
- Ghorbanzadeh, O., Tiede, D., Dabiri, Z., Sudmanns, M., & Lang, S. (2018b). Dwelling extraction in refugee camps using cnn-first experiences and lessons learnt. International Archives of the Photogrammetry, Remote Sensing & Spatial Information Sciences, 42(1), 161-166.. https://pdfs.semanticscholar.org/71bb/37579f70e18de4596a38084a71c274311522.pdf
- Grundy, C., Füreder, P., Siddiqui, R., Katsuva Sibongwe, D., Tiede, D., Lang, S., & Checci, F. 2012. Validation of satellite imagery methods to estimate population size. MSF Scientific Day. 25
- Guirado, E., Tabik, S., Alcaraz-Segura, D., Cabello, J., & Herrera, F. (2017). Deep-learning convolutional neural networks for scattered shrub detection with google earth imagery. arXiv Preprint arXiv:1706.00917, 1-23.
- Han, X., Zhong, Y., Zhao, B., & Zhang, L. (2017). Scene classification based on a hierarchical convolutional sparse auto-encoder for high spatial resolution imagery. International Journal of Remote Sensing, 38(2), 514–536. https://doi.org/10.1080/01431161.2016.1266059
- Hang, R., Liu, Q., Hong, D., & Ghamisi, P. (2019). Cascaded recurrent neural networks for hyperspectral image classification. IEEE Transactions on Geoscience and Remote Sensing, 5384-5394. https://ieeexplore.ieee.org/stamp/stamp.jsp?arnumber=8662780
- Hu, F., Xia, G.-S., Hu, J., & Zhang, L. (2015). Transferring deep convolutional neural networks for the scene classification of high-resolution remote sensing imagery. Remote Sensing, 7(11), 14680–14707. https://doi.org/10.3390/rs71114680
- Iglovikov, V., Seferbekov, S. S., Buslaev, A., & Shvets, A. (2018) TernausNetV2: Fully convolutional network for instance, segmentation. CVPR Workshops (pp. 233–237). Salt Lake City, Utah.
- Jin, B., Ye, P., Zhang, X., Song, W., & Li, S. (2019). Object-oriented method combined with deep convolutional neural networks for land-use-type classification of remote sensing images. Journal of the Indian Society of Remote Sensing, 47(6), 951–965. https://doi.org/10.1007/s12524-019-00945-3
- Jozdani, S. E., Johnson, B. A., & Chen, D. (2019). Comparing deep neural networks, ensemble classifiers, and support vector machine algorithms for object-based urban land use/land cover classification. Remote Sensing, 11(14), 1713. https://doi.org/10.3390/rs11141713
- Krizhevsky, A., Sutskever, I., & Hinton, G. E. (2012) Imagenet classification with deep convolutional neural networks. Advances in neural information processing systems (pp. 1097–1105). Lake Tahoe, Nevada, USA.
- Laneve, G., Santilli, G., & Lingenfelder, I. (2006) Development of automatic techniques for refugee camps monitoring using very high spatial resolution (VHSR) satellite imagery. 2006 IEEE international symposium on geoscience and remote sensing (pp. 841–845). IEEE, Denver, CO, USA.
- Lang, S., Füreder, P., Riedler, B., Wendt, L., Braun, A., Tiede, D., Schoepfer, E., Zeil, P., Spröhnle, K., & Kulessa, K. (2019a). Earth observation tools and services to increase the effectiveness of humanitarian assistance. European Journal of Remote Sensing, 1–19. https://doi.org/10.1080/22797254.2019.1684208
- Lang, S., Hay, G. J., Baraldi, A., Tiede, D., & Blaschke, T. (2019b). Geobia achievements and spatial opportunities in the era of big earth observation data. ISPRS International Journal of Geo-Information, 8(11), 474. https://doi.org/10.3390/ijgi8110474
- Lang, S., Tiede, D., Hölbling, D., Füreder, P., & Zeil, P. (2010). Earth observation (EO)-based ex post assessment of internally displaced person (IDP) camp evolution and population dynamics in Zam Zam, Darfur. International Journal of Remote Sensing, 31(21), 5709–5731. https://doi.org/10.1080/01431161.2010.496803
- Li, H., Zhang, C., Zhang, S., & Atkinson, P. M. (2019). A hybrid OSVM-OCNN method for crop classification from fine spatial resolution remotely sensed imagery. Remote Sensing, 11(20), 2370. https://doi.org/10.3390/rs11202370
- Lin, Z., Lanchantin, J., & Qi, Y. (2016) MUST-CNN: A multilayer shift-and-stitch deep convolutional architecture for sequence-based protein structure prediction. Thirtieth AAAI conference on artificial intelligence. Phoenix, Arizona USA.
- Liu, S., Qi, Z., Li, X., & Yeh, A. G.-O. (2019). Integration of convolutional neural networks and object-based post-classification refinement for land use and land cover mapping with optical and SAR data. Remote Sensing, 11(6), 690. https://doi.org/10.3390/rs11060690
- Liu, T., & Abd-Elrahman, A. (2018). Deep convolutional neural network training enrichment using multi-view object-based analysis of unmanned aerial systems imagery for wetlands classification. ISPRS Journal of Photogrammetry and Remote Sensing, 139, 154–170. https://doi.org/10.1016/j.isprsjprs.2018.03.006
- Liu, T., Yang, L., & Lunga, D. D. (2019) Towards misregistration-tolerant change detection using deep learning techniques with object-based image analysis. Proceedings of the 27th ACM SIGSPATIAL international conference on advances in geographic information systems (pp. 420–423). Chicago, Illinois, USA.
- Lüthje, F., Tiede, D., & Füreder, P. (2015) Don’t see the dwellings for the trees: Quantifying the effect of tree growth on multi-temporal dwelling extraction in a refugee camp. Proceedings of the GI_Forum, Salzburg, Austria.
- Lv, X., Ming, D., Lu, T., Zhou, K., Wang, M., & Bao, H. (2018). A new method for region-based majority voting CNNs for very high resolution image classification. Remote Sensing, 10(12), 1946. https://doi.org/10.3390/rs10121946
- Maggiori, E., Tarabalka, Y., Charpiat, G., & Alliez, P. (2017). Convolutional neural networks for large-scale remote-sensing image classification. IEEE Transactions on Geoscience and Remote Sensing, 55(2), 645–657. https://doi.org/10.1109/TGRS.2016.2612821
- Pan, X., Zhao, J., & Xu, J. (2019). An object-based and heterogeneous segment filter convolutional neural network for high-resolution remote sensing image classification. International Journal of Remote Sensing, 40(15), 5892–5916. https://doi.org/10.1080/01431161.2019.1584687
- Panboonyuen, T., Jitkajornwanich, K., Lawawirojwong, S., Srestasathiern, P., & Vateekul, P. (2019). Semantic segmentation on remotely sensed images using an enhanced global convolutional network with channel attention and domain specific transfer learning. Remote Sensing, 11(1), 83. https://doi.org/10.3390/rs11010083
- Pena, J., Tan, Y., & Boonpook, W. (2019). Semantic segmentation based remote sensing data fusion on crops detection. Journal of Computer and Communications, 7(7), 53-64.
- Qayyum, A., Malik, A., Saad, M. N., & Mazher, M. (2019). Designing deep CNN models based on sparse coding for aerial imagery: A deep-features reduction approach. European Journal of Remote Sensing, 52(1), 221–239. https://doi.org/10.1080/22797254.2019.1581582
- Quinn, J. A., Nyhan, M. M., Navarro, C., Coluccia, D., Bromley, L., & Luengo-Oroz, M. (2018). Humanitarian applications of machine learning with remote-sensing data: Review and case study in refugee settlement mapping. Philosophical Transactions of the Royal Society A: Mathematical, Physical and Engineering Sciences, 376(2128), 20170363. https://doi.org/10.1098/rsta.2017.0363
- Radoux, J., & Bogaert, P. (2017). Good practices for object-based accuracy assessment. Remote Sensing, 9(7), 646. https://doi.org/10.3390/rs9070646
- Radovic, M., Adarkwa, O., & Wang, Q. (2017). Object recognition in aerial images using convolutional neural networks. Journal of Imaging, 3(2), 21. https://doi.org/10.3390/jimaging3020021
- Sameen, M. I., & Pradhan, B. (2019). Landslide detection using residual networks and the fusion of spectral and topographic information. IEEE Access, 7, 114363–114373. https://doi.org/10.1109/ACCESS.2019.2935761
- Spröhnle, K., Tiede, D., Schoepfer, E., Füreder, P., Svanberg, A., & Rost, T. (2014). Earth observation-based dwelling detection approaches in a highly complex refugee camp environment—a comparative study. Remote Sensing, 6(10), 9277–9297. https://doi.org/10.3390/rs6109277
- Tavakkoli Piralilou, S., Shahabi, H., Jarihani, B., Ghorbanzadeh, O., Blaschke, T., Gholamnia, K., Meena, S. R., & Aryal, J. (2019). Landslide detection using multi-scale image segmentation and different machine learning models in the higher himalayas. Remote Sensing, 11(21), 2575. https://doi.org/10.3390/rs11212575
- Tiede, D., Krafft, P., Füreder, P., & Lang, S. (2017). Stratified template matching to support refugee camp analysis in OBIA workflows. Remote Sensing, 9(4), 326. https://doi.org/10.3390/rs9040326
- Tiede, D., Lang, S., Hölbling, D., & Füreder, P. (2010). Transferability of OBIA rulesets for IDP camp analysis in darfur.
- UNHCR. (2019). Global trends: Forced displacement in 2018. The UN Refugee Agency.
- Wendt, L., Lang, S., & Rogenhofer, E. (2017) Monitoring of refugee and camps for internally displaced persons using sentinel-2 imagery–a feasibility study. GI_Forum 2017, 5, (pp. 172–182). Salzburg, Austria.
- Witmer, F. D. (2015). Remote sensing of violent conflict: Eyes from above. International Journal of Remote Sensing, 36(9), 2326–2352. https://doi.org/10.1080/01431161.2015.1035412
- Yang, H. L., Lunga, D., & Yuan, J. (2017) Toward country scale building detection with convolutional neural network using aerial images. Geoscience and remote sensing symposium (IGARSS), 2017 IEEE International (pp. 870–873), IEEE, Texas, USA.
- Zhang, C., Sargent, I., Pan, X., Li, H., Gardiner, A., Hare, J., & Atkinson, P. M. (2018). An object-based convolutional neural network (OCNN) for urban land use classification. Remote Sensing of Environment, 216, 57–70. https://doi.org/10.1016/j.rse.2018.06.034
- Zhang, G., Zhang, R., Zhou, G., & Jia, X. (2018). Hierarchical spatial features learning with deep CNNs for very high-resolution remote sensing image classification. International Journal of Remote Sensing, 39(18), 5978–5996. https://doi.org/10.1080/01431161.2018.1506593
- Zhao, W., Bo, Y., Chen, J., Tiede, D., Thomas, B., & Emery, W. J. (2019). Exploring semantic elements for urban scene recognition: Deep integration of high-resolution imagery and OpenStreetMap (OSM). ISPRS Journal of Photogrammetry and Remote Sensing, 151, 237–250. https://doi.org/10.1016/j.isprsjprs.2019.03.019
- Zhao, W., Du, S., & Emery, W. J. (2017). Object-based convolutional neural network for high-resolution imagery classification. IEEE Journal of Selected Topics in Applied Earth Observations and Remote Sensing, 10(7), 3386–3396. https://doi.org/10.1109/JSTARS.2017.2680324
- Zhu, X. X., Tuia, D., Mou, L., Xia, G.-S., Zhang, L., Xu, F., & Fraundorfer, F. (2017). Deep learning in remote sensing: A comprehensive review and list of resources. IEEE Geoscience and Remote Sensing Magazine, 5(4), 8–36. https://doi.org/10.1109/MGRS.2017.2762307