
 ?Mathematical formulae have been encoded as MathML and are displayed in this HTML version using MathJax in order to improve their display. Uncheck the box to turn MathJax off. This feature requires Javascript. Click on a formula to zoom.
ABSTRACT
Linear spectral mixture analysis (LSMA) and regression analysis are the two most conventionally used methods to estimate impervious surfaces at the subpixel scale in an urban area. However, LSMA lacks the sensitivity to pixel brightness, which leads to inter variability of endmembers and affects the ability to distinguish features with a similar spectral signature. This research aims to develop LSMA aided by a regression analysis model to estimate impervious surfaces with higher accuracy. A spectral angle mapping (SAM) based regression analysis model is introduced to reduce errors. Based on high-resolution images and field survey data, the SAM-based regression analysis can estimate non-impervious surface and high-impervious surface densities with high accuracy, while less accurate in impervious surfaces with low/medium density. In contrast, LSMA is able to estimate low/medium-density impervious surfaces with higher accuracy. We propose an improved approach by integrating the two methods, regression analysis aided LSMA, for impervious surface estimation. The proposed method increases the overall accuracy of the impervious surface estimation to 85.24%, which is significantly greater than that of the conventional methods.
Introduction
Impervious surfaces refer to any surfaces through which water cannot infiltrate. In an urban area, impervious surfaces primarily consist of anthropogenic features such as roads, driveways, sidewalks, parking lots, rooftops, et al. As a key indicator of urbanization and urban expansion intensity in an urban study, the impervious density can quantify the urban expansion (Arnold & Gibbons, Citation1996; Clapham, Citation2003). The expansion of impervious surfaces can exert considerable influence on the urban environment in many aspects (Weng, Citation2001; Yang, Huang et al., Citation2003; Yuan & Bauer, Citation2007; Zhang & Weng, Citation2016). The study of impervious surfaces is significant for urban studies and environmental protection (Weng, Citation2012).
The efficient and accurate estimation of impervious surfaces is a fundamental task in an impervious surface study. Ground measurement and remote sensing are the two primary ways of estimating impervious surfaces. Ground measurement methods, including a field survey with the GPS technique, are expensive and time-consuming (Weng, Citation2012). The remote sensing method is preferable because it can cover more areas with less cost. It can represent a primary technical approach for the estimation of impervious surfaces. Since the twenty-first century, remote sensing of impervious surfaces has rapidly gained prominence among researchers (Weng, Citation2012). Urban impervious surfaces have been estimated with different scales and research purposes from multi-resolution images (Elvidge et al., Citation2007; Esch et al., Citation2009; Hu & Weng, Citation2009; Lu, Hetrick, et al., Citation2011; Lu & Weng, Citation2009; Sutton et al., Citation2009; Qihao Weng et al., Citation2009; Xia et al., Citation2011), such as IKONOS, QuickBird (high-resolution image), Landsat TM, Terra ASTER (medium resolution image), and DMSP-OLS (low-resolution image). Generally, low-resolution imaging is not applicable to urban areas because of the mixed large pixel. High-resolution imaging can significantly reduce the mixed pixel problem and reflect a more detailed character of land covers (Hsieh et al., Citation2001). However, the application of high-resolution imaging to impervious surface extraction is limited by low spectral resolution and the presence of shadows that can be confused with water (Lu, Hetrick et al., Citation2011). Therefore, despite the substantial presence of mixed pixels, medium-resolution imaging provides an appropriate scale for estimating impervious surface data via a subpixel-based method in urban areas (Lu, Moran et al., Citation2011). With medium-resolution images, per-pixel detection techniques such as principal component analysis, image differencing, and post-classification comparison can be applied to extract impervious surfaces and detect changes. However, the extracted results generated with these methods are often not sufficiently accurate (Lu, Moran et al., Citation2011). In contrast, the subpixel-based method, which evaluates the proportion of impervious surfaces in the pixels, is more capable of dealing with the spectral complexity of impervious surfaces in remote sensing spectral signatures and the mixed pixel problem (Deng & Zhu, Citation2020; Weng et al., Citation2009; Wu, Citation2004). Linear spectral mixture analysis (LSMA; Lu & Weng, Citation2006; Wu & Murray, Citation2003), regression analysis (Xian & Crane, Citation2005; Yang, Huang et al., Citation2003), subpixel-based classification (Civco et al., Citation2002; Ji & Jensen, Citation1999), and artificial neural network (ANN; Hu & Weng, Citation2009) are commonly utilized subpixel-based methods to estimate impervious surfaces.
When analyzing the particular spectral characteristics of vegetation, impervious surfaces, and soil, Ridd (Citation1995) deemed that urban land cover is a linear combination of these three components. A conceptual model, the vegetation-imperviousness-soil (V-I-S) model, was proposed for remote sensing analysis of urban landscapes. Using this model, researchers estimated impervious surfaces at the subpixel level using LSMA and continuously adjusted the model and method (Roberts et al., Citation1999; Weng et al., Citation2009; Wu & Murray, Citation2003). Wu (Citation2004) normalized the spectral characteristics of three types of endmembers in the model to overcome the problem associated with selecting endmembers and within-class spectral variability. Phinn et al. (Citation2002) overlaid the classification result with the LSMA estimation of impervious surfaces. They analyzed the density of the V-I-S endmembers in different landuse categories at the subpixel level. Considering the apparent heterogeneity of the impervious surface, Wu and Murray (Citation2003) argued that the impervious surface should not be regarded as only one type of endmember. They divided the impervious surface into high-albedo and low-albedo endmembers. Using land surface temperatures (LST), Lu and Weng (Citation2006) established the four-endmember model (vegetation, high-albedo, low-albedo and soil) using LSMA to estimate the impervious surface with ETM+ images. Weng et al. (Citation2009) suggested that the accuracy of LSMA can be affected by season because the lush vegetation of the summer is more likely to be distinguished from the impervious surface using the LSMA method. Addressing the endmember variability problem, Li and Wu (Citation2016) varied endmember sets spatially by applying kriging interpolation and developed a geostatistical temporal mixture analysis technique. With these improvements, LSMA has been further implemented in different study areas (Fan & Deng, Citation2014; Hao et al., Citation2016; Li et al., Citation2010; Scott et al., Citation2014; Xu et al., Citation2018; Zhang et al., Citation2015). However, estimating impervious density with high accuracy is still a challenging issue because of problems associated with inter variability of endmembers. Previous research has pointed out that impervious surfaces do not have unique spectral characteristics (Ridd, Citation1995; Small & Lu, Citation2006). As a result, low-albedo tend to be confused with water and shadow and high-albedo with sandy bare soil. Besides, the spectral sensitivity of LSMA is often not quite responsive as non-linear models. Therefore, overestimation can occur in areas with small amounts of impervious surface, and underestimation can occur in areas with large amounts of impervious surface (Weng, Citation2012; Wickham et al., Citation2018).
The regression analysis has been increasingly implemented to estimate impervious surfaces in recent years. Studies typically employ finer resolution data for calibration and validation and coarser resolution data to estimate the impervious surface area at regional or continental levels (Weng, Citation2012). The advantage of regression analysis simplifies the complicated non-linear relationship between predictive and target variables and constructs a multivariate linear relation. In addition, regression analysis can incorporate both continuous and discrete independent variables for continuous variable prediction (Xian, Citation2007). Yang, Xian et al. (Citation2003) acquired training data by overlaying impervious surface data extracted from an IKONOS image with an ETM+ and TM grid and proposed a regression tree (CART) algorithm to estimate impervious surfaces at the subpixel level. A similar approach was applied to subsequent studies to detect changes in the impervious surface in different periods (Cao et al., Citation2019; Fu et al., Citation2016; Im et al., Citation2012; Shao et al., Citation2015; Xian & Crane, Citation2005; Xian et al., Citation2008; Yang et al., Citation2009). Yang et al. (Citation2009) further improved the accuracy of this method by modeling with an InSAR image and a high-resolution image. As shown in these studies, the regression analysis method is able to achieve high accuracy in impervious surface estimation (Bauer et al., Citation2007; Yuan et al., Citation2008). Moreover, it can be found that the producer accuracy varies with the difference of impervious density. In areas with low/medium-density impervious surfaces, the accuracy was lower than overall accuracy. However, very few studies have analyzed the error source of regression analysis based on the variation of producer accuracy. In recent years, regression analysis has been continuously implemented to estimate impervious surfaces. Further clarifying the error source of regression analysis is critical for impervious surface estimation with high accuracy (Xian et al., Citation2005).
In addition to LSMA and regression analysis, other approaches, such as artificial neural network (ANN) and night-time light photography (NTL) analysis, have also been applied to estimate subpixel impervious surfaces. Hu and Weng (Citation2009) estimated impervious surfaces from medium spatial resolution imagery using the self-organizing map (SOM) and multi-layer perception (MLP), the two most widely used models of ANN. They concluded that MLP was slightly more accurate. Although ANN is capable of solving non-linear relationships, its drawbacks should be noted (Weng, Citation2012). For MLP, none of the methods for estimating the number of hidden layer nodes are widely accepted (Kavzoglu & Mather, Citation2003). Besides, the accuracy of SOM heavily relies on the size of the feature map, and the error increases significantly with too few or too many neurons (Weng, Citation2012). NTL analysis, mainly used to estimate the distribution of impervious surfaces at regional to continental scales, has gained more attention recently. Elvidge et al. (Citation2007) developed a model to estimate the density of impervious surfaces in the globe range based on the radiance calibrated NTL and the LandScan population count. Ma et al. (Citation2012) estimated the dynamics of the urban impervious surface in China from 1992 to 2009 with high accuracy using the Vegetation Adjusted NTL Urban Index, which combines NTL and Normalized Difference Vegetation Index data. Shao and Liu (Citation2014) generated impervious surface results based on a linear regression model developed between the subpixel impervious surfaces fraction and a multi-source index with the integration of DMSP-OLS NTL and MODIS NDVI. Kotarba and Aleksandrowicz (Citation2016) used high-resolution night-time photography from the International Space Station and provided more reliable estimates of impervious surfaces in a smaller area. Previous research found a good correlation between the actual extent of urban areas and NTL data. However, OLS-based maps suffer from the NTL sensor’s saturation problem and coarse resolution. And the data sources of NTL data with higher resolution are heavily limited (Ma et al., Citation2012; Q. Zhang & Seto, Citation2011).
LSMA is one of the most conventionally used methods to estimate impervious surfaces at the subpixel scale in an urban area. However, it lacks the sensitivity to pixel brightness, which leads to inter variability of endmembers and affects the ability to distinguish features with a similar spectral signature. To address this problem, this research aims to develop LSMA aided by a regression analysis model with higher accuracy. A spectral angle mapping (SAM) based regression analysis model is introduced to reduce errors.
Materials
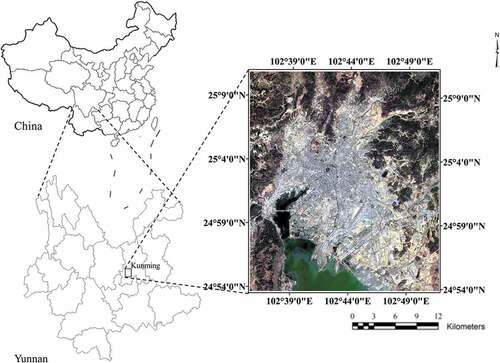
With an area of 839km2, the study area of this research is located in the central part of Kunming city. Kunming is the provincial capital of Yunnan Province, which is located in the Yunnan-Guizhou Plateau of southwest China. With an area ranging from 102°35ʹ26″ to 102°51ʹ23″ E in longitude and 24°53ʹ50″ to 25°10ʹ44″ N in latitude, the study area encompasses portions of the six central districts of the city (Wuhua, Panlong, Xishan, Guandu, Chenggong, and Anning; ). The Dianchi Lake, the sixth-largest freshwater lake in China, lies in the south of the study area. Since the 1970s, the Dianchi Lake has experienced heavy pollution, blue-green algae overgrowth, and severe eutrophication (Yu et al., Citation2010). Related studies have suggested that the expansion of the urban area and the region’s agricultural activity resulted in the continuous deterioration of the water quality in Dianchi Lake (H. Zhang et al., Citation2011). Zhao et al. (Citation2012) systematically analyzed the landuse and land-cover change (LUCC) of the Dianchi watershed from 1974 to 2008. The estimation of the impervious surfaces of Kunming City is critical for urban landuse policy decision-making and the Dianchi Lake protection.
Figure 1. Study area: Kunming City, Yunnan province, China.
With a resolution of 30m, the Landsat 8 Oli image (path 129/row 43) was acquired on 20 April 2013. And QuickBird image (0.6m) was acquired on 25 February 2013. The radiation and geometric corrections were processed for the Landsat and QuickBird images. A field geographic investigation was conducted from October to November 2012. Ground truth data were collected for training data and accuracy validation. In addition, ancillary data collected from the Second National Land Census of China in 2009 were also used in this research.
Methods
LSMA
LSMA is a linear unmixing method that calculates the abundance of endmembers in mixed pixels, which extensively exist in medium-resolution images. Assuming that each mixed pixel of an image is a linear combination of the endmembers (Roberts et al., Citation1999), the mathematical model of the LSMA can be expressed by the following equation:
where i = 1, …, m (number of spectral bands), k = 1, …, n (number of endmembers), Ri is the spectral reflectance of band i of a mixed pixel, fk is the proportion of endmembers k within the pixel, Rik is the known spectral reflectance of endmember k within the pixel of band i and ERt is the error for band i. The following conditions must be satisfied to solve for fk:
The following four steps were conducted to estimate impervious surfaces in this research: (1) exclusion of bodies of water that primarily consist of pure pixels, (2) minimum noise fraction (MNF) rotation, which produces a small number of components that contain most of the information, (3) calculation of the Pixel Purity Index (PPI) from the MNF component image and selection of endmembers, and (4) linear spectral mixing analysis and post-processing.
The root mean square error (RMSE) of different combinations of the endmembers was compared based on the 13,080 randomly selected points with ground truth impervious density (). A five-endmembers LSMA model with the lowest RMSE was chosen to estimate impervious surfaces. All the five types of endmembers, namely high-albedo impervious surface, low-albedo impervious surface, forest, grassland, and soil, show unique spectral characteristics in MNF feature space (). Then the Landsat 8 Oli image was unmixed into five fraction images using the chosen model. Thus, the impervious surface was estimated at the subpixel level.
Figure 2. Feature spaces of the MNF components 1 and 2 (a), 1 and 3 (b) with five endmembers: high-albedo impervious surface, low-albedo impervious surface, forest, grassland, and soil.
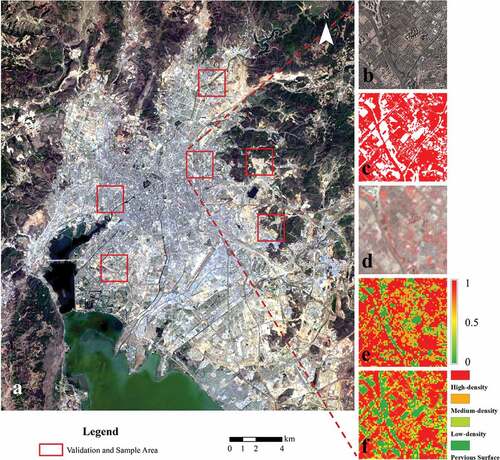
Figure 3. Randomly selected validation and sample areas in study area (a); QuickBird image (0.6 m) of one of the validation and sample area (b); a binary map of impervious versus non-impervious pixels extracted using object-oriented classifier (c); grid matching with Landsat 8 Oli image pixels (d); calculated subpixel results of the impervious surface density in the validation and sample area (e); categories of impervious surfaces of the validation and sample area (f).
SAM-based regression analysis
SAM treats the spectrum as vectors in a space with dimensionality equal to the number of bands used. The spectral similarity is determined between the image spectrum and the reference spectrum by calculating the angle between the targeted and reference vectors as:
Where, n is the number of bands, t the targeted spectrum, and r reference spectrum. In this research, the reference spectrum was extracted from the training data of the sample area (). In n-dimensional multispectral space, a pixel vector has both magnitude (length) and an angle measured with respect to the axes that define the coordinate system of the space. In a SAM model, only the angular information is used to identify the pixel spectrum. Small angles between the two spectra indicate a high similarity, and high angles indicate low similarity. Pixels with an angle larger than the tolerance level of the specified maximum angle threshold are not classified (Kruse et al., Citation1993). The primary advantage of SAM is its insensitivity to differences in the albedo of the modeled spectrum. Spectral angle only measures differences in spectral shape, and spectral albedo is measured by the length of each vector (Dennison et al., Citation2004).
The conduction of regression analysis in this research mainly consists of four steps: (1) mapping the impervious surface in the sample area with object-oriented classification, (2) calculating the impervious density based on the Landsat Oli grid of the sample area, (3) creating the spectral library for impervious surfaces with different densities, and (4) building the regression model and estimating the impervious surface.
Six validation and sample areas were randomly selected from the study area (), and the corresponding QuickBird image was acquired (). Each covers 4.04 km2 and contains 4489 pixels. The pixels were randomly and equally divided into two categories for training and validation, respectively. Urban areas, bodies of water, vegetation, and bare soil are distributed and mixed throughout the area. The object-oriented classification was applied to extract impervious surfaces since the mixed pixel was significantly reduced in the high-resolution image (Lu, Moran et al., Citation2011). The object-oriented classification is more suitable than the pixel-based classification method for high-resolution remote sensing because it is capable of integrating spatial information such as texture, shape, and context to better discriminate between spectrally similar types of land cover (Li et al., Citation2011). The remote sensing image was segmented into small objects such as building blocks, patches of vegetation, or road segments according to spatial information and spectral features. With consideration of the variation of visible spectral among different landuse, as well as within impervious surfaces, eight categories were developed, including bare soil, vegetation, shadow/water, and five different types of impervious surfaces (). In this research, object-oriented classification was conducted using eCognition Developer. This software provides an effective development environment to develop rule sets for the object-oriented analysis of remote sensing data. Misclassifications caused by shadow, water, or small spots of vegetation were manually checked and modified with visual interpretation. The classification results with eight categories were then merged to produce a binary raster image of impervious versus non-impervious pixels at 0.6 m (). The binary image was then analyzed using grid matching with pixels in the Landsat Oli image at 30 m through an overlay approach (). The impervious density of every Landsat Oli image pixel in the sample area is then calculated according to the following equation ():
Table 1. Categories of the object-oriented classification in the QuickBird image
where, D is the density of the impervious surface, and A is the impervious surface area in every Landsat 8 Oli image pixel with an area of 900m2.
Previous studies typically used a classification and regression tree (CART) algorithm with training data to estimate impervious surfaces in urban areas. However, the CART algorithm has limitations related to model calibration, validation, and extrapolating the models to other study areas (Weng, Citation2012). In a multi-temporal analysis, the difference in training data leads to different models, and time consistency is difficult to achieve.
This research attempts to develop a regression model based on SAM to estimate impervious surfaces in an urban area (). 90 reference spectral curves of impervious surfaces with density from 10% to 100% in the sample area were obtained by overlaying training data from the QuickBird image with the Landsat 8 Oli image (). The reference spectrum of other features such as grassland, forest, and barren was obtained through endmember selection in LSMA (). The regression analysis model was established to match all the pixels with the reference spectral library based on the sample data. Even though impervious surfaces with different density values have similar spectral characteristics, the albedo level was inversely related to the density. It is supposed that the albedo is affected by the amount of shadow from buildings.
Figure 4. The process of SAM-based regression analysis.
Assessment of the accuracy
In this research, 13,080 validation points were randomly selected from the validation and sample areas. The impervious surfaces of the validation points were mapped based on visual interpretation and object-oriented classification ().
At the later stage, the LSMA model would be improved with the regression analysis-estimated results based on several error analysis methods, including the residual error (RE), the root-mean-square error (RMSE) and the mean absolute error (MAE).
Residual error, which measures the difference between estimated and actual ISA, was calculated for each of the pixels in the validation area:
where, and
are the estimated and actual values, respectively.
RMSE and MAE were calculated Based on the statistics of RE. RMSE is one of the most widely reported error measures in the climatic and environmental literature. While the RMSE treats variance as it gives errors with larger absolute values more weight than errors with smaller absolute values, MAE gives the same weight to all errors and measures the mean absolute value of each difference (Chai & Draxler, Citation2014). Compared with RMSE, MAE is considered to be a more natural and unambiguous index to estimate errors (Willmott & Matsuura, Citation2005). They are commonly calculated by the following equation:
where, is the number of validation data,
and
the estimated and actual values. In this study, RSME and MAE were used to evaluate and compare the errors of the above two approaches.
RMSE and MAE were calculated Based on the statistics of RE. RMSE is one of the most widely reported error measures in the climatic and environmental literature. While the RMSE treats variance as it gives errors with larger absolute values more weight than errors with smaller absolute values, MAE gives the same weight to all errors and measures the mean absolute value of each difference.
SAM-based regression analysis aided LSMA method for impervious surface estimation
The basic concept of improving LSMA aided by SAM-based regression analysis is to use the regression analysis-estimated high-density impervious surfaces and non-impervious surfaces to improve the results of the LSMA method.
In the previous research, Xian and Crane (Citation2005) divided their study area into four categories, namely, non-urban, low-density urban, medium-density urban, and high-density urban. The thresholds used to define urban landuse categories are summarized in . This classification method provided an alternative way of interpreting the mechanism behind urban development, which varies significantly with the density of the urban space. In addition, the classification results provide helpful information on urban climate (Ren et al., Citation2013), the urban environment (Ng et al., Citation2011; Yang et al., Citation2013; Zhang et al., Citation2012), urban traffic (Dicembre & Ricci, Citation2011; Hui & Yu, Citation2013), and sustainable urban development (Zhang et al., Citation2012). The classification of urban landuse and the relevant definitions were applied in this research to evaluate the accuracy of the impervious density estimation.
Table 2. Categories of impervious surfaces
The overall accuracy of the LSMA-based method is limited for the overestimation in areas with small amounts of impervious surface and underestimation in areas with large amounts of impervious surface (Weng, Citation2012). On the contrary, the accuracy assessment of many previous studies has shown that the regression analysis estimation of high-density impervious surfaces and non-impervious surfaces was relatively more accurate.
A similar error distribution pattern was also found in this research, indicating that low/medium-density impervious surfaces estimated by SAM-based regression analysis can complement the results and improve the overall accuracy of LSMA estimation of the impervious surface. The results estimated from LSMA and SAM-based regression analysis methods overlaid so that each pixel had a density value estimated from both methods.
The process of improvement is illustrated by the 16 cases that were categorized into three categories () and shown in : (1) when the two methods produced commensurate impervious densities, the final impervious densities of the pixels (highlighted in italics) were equal to the estimated values. (2) For the pixels highlighted with underline, the pixels were estimated as low/medium-density impervious surfaces by LSMA, determining their final value. Similarly, for pixels estimated as non-impervious or high-density impervious surfaces by SAM-based regression analysis, the final impervious density was determined by SAM-based regression analysis. The overall accuracy of the final results was significantly increased with this step, which involves as much as 50% of pixels of the entire study area. (3) For the pixels in the remaining eight cases, the final densities were determined by both SAM-based regression analysis and LSMA. The proportions depend on the pixel’s RMSE of the LSMA. For example, the impervious densities of pixels with a lower RMSE should be considered more accurately estimated by LSMA, which will have a more significant proportion in the final estimation of the pixels’ impervious density ().
Figure 5. The proposed procedure for SAM-based regression analysis aided LSMA. Dr: Impervious density (%) estimated by regression analysis, Dl: Impervious density (%) estimated by LSMA, D: Final result.
Table 3. Improvement for different categories
Results
In this research, the ground truth was accessed through a field survey and high-resolution image interpretation for the validation points (). The overall accuracies of the LSMA and the SAM-based regression analysis were 78.27% and 82.90%, respectively (). Regression analysis based on CART, whose overall accuracy was 74.18% (), was also conducted in this research to make a comparison with SAM-based regression analysis.
Table 4. Confusion matrix of results estimated by LSMA
Table 5. Confusion matrix of results estimated by SAM-based regression analysis
Table 6. Confusion matrix of results estimated by CART-based regression analysis
The accuracy assessment shows that the overall accuracy of the regression analysis based on CART gains the lowest overall accuracy, while the accuracy of regression analysis based on SAM reaches the highest. Although the overall accuracy of LSMA is lower than the SAM-based regression analysis by 4.63%, the producer’s accuracy of the low/medium-density impervious surface estimated by LSMA reached approximately 70%, which is much higher than that of SAM-based regression analysis. With the SAM-based regression analysis, the estimation of non-impervious and high-density impervious surfaces reached high producer’s accuracies of 92.45% and 89.14%, respectively. However, with a mean producer accuracy of less than 50%, SAM-based regression analysis was far from satisfactory when estimate low/medium-density impervious surfaces.
Using the above proposed SAM-based regression analysis aided LSMA method, an impervious surface map of the study area was generated and presented in . Apparent improvements are also revealed from the accuracy validation of different error measurements (). Compared with conventional LSMA, the improved method’s overall MAE and RMSE are lowered by respectively 32.48% and 13.52%, respectively. More remarkable improvements appear in high-density impervious surfaces with an actual impervious density greater than 0.70, where intensely developed urban areas are located with land use of CBD, high density residential and light industry (Ridd, Citation1995). The MAE and RMSE for the improved method in these areas are 0.04 and 0.08 (), apparently improved compared with the conventional CART algorithm (0.08 and 0.13).
Figure 6. Subpixel impervious surfaces estimation (a) and categories of impervious surfaces (b) of Kunming City in 2013.
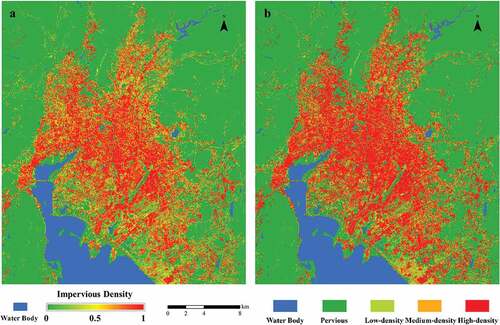
Table 7. Accuracy of impervious estimation
A confusion matrix was also applied to assess the accuracy of the proposed method (). With an overall accuracy of 86.28%, the accuracy of LSMA aided by SAM-based regression analysis was significantly better than that of SAM-based regression analysis (80.48%) or LSMA (74.54%) alone.
Table 8. Confusion matrix of results estimated by improved method
Compared with conventional LSMA, the producer’s accuracy of non-impervious surface and high-density impervious surface increased from 72.95% and 85.47% to 89.53% and 92.16%, respectively. And the user’s accuracies of low/medium/high-density impervious surfaces were remarkably and concurrently improved, while that of non-impervious surfaces decreased slightly from 93.57% to 91.84%.
Discussion
The overall accuracy of the LSMA-based method is limited for the following reasons. Firstly, the variability in the spectral characteristics of the impervious surface causes low-albedo to be confused with water and shadows/high-albedo to be confused with sandy bare soil (Small & Lu, Citation2006). Secondly, overestimation can occur in areas with small amounts of impervious surface, while underestimation can occur in areas with large amounts of impervious surface (Weng, Citation2012). The accuracy assessments of many related studies (Lu, Moran et al., Citation2011; Lu & Weng, Citation2006; Wu & Murray, Citation2003) indicate that the drawbacks of LSMA have little effect on the estimation of low/medium impervious surfaces, especially in areas with an impervious density of 50%.
Previous studies have estimated the accuracy of regression analysis with indicators such as overall accuracy, correlation coefficients, Kappa coefficients, and RMSE (Xian & Crane, Citation2005; Yang, Huang et al., Citation2003; Yang et al., Citation2009). Based on aerial images and field surveys, some studies reported variations in the accuracy of estimated impervious surfaces with different densities (Bauer et al., Citation2007; Yuan et al., Citation2008). The authors found variation characteristics in their accuracy analysis similar to those encountered in this research, i.e., high-density impervious surfaces and non-impervious surfaces were precisely estimated. In contrast, the results of low/medium-density impervious surfaces were not as accurate. However, previous studies did not analyze the reason why producers’ accuracy varies remarkably in impervious surfaces with different densities. We suppose that this is because that the most spectral characteristics of impervious surfaces with the highest or lowest densities are more distinctive compared to low/medium-density impervious surfaces. Besides, SAM-based regression analysis is a more straightforward approach than other methods since it estimates impervious density by spectral matching. Therefore, areas with high-density impervious surfaces and non-impervious surfaces tend to be more precisely detected. On the other side, it is more complicated to estimate areas with low/medium-densities impervious surfaces, where mixed pixels conventionally exist. As a result, the producer’s accuracy of areas with low/medium-density impervious surfaces decreases because of error accumulation.
In this research, the estimated results with higher accuracy from the two conventional methods were applied in the final results as much as possible. Therefore, the proposed integrated method can efficiently improve the accuracy of the impervious surface density estimation.
In addition to the above accuracy assessment, a field survey was conducted in eight randomly selected plots to validate further the reliability of SAM-based regression analysis aided LSMA ().
Table 9. Category of field survey plots
The field survey plots cover impervious surfaces with varying densities and can be divided into the following three groups. (1) The accurate identifications of the impervious surface, the non-impervious surface, and the water body in the C1, C2, and C6 indicate the high ability of the proposed method to distinguish the impervious surface from satellite images. (2) Indicated by the high-resolution image, the plots of C2, C4, C5 and C8 are mainly covered by high-density impervious surfaces. However, the field survey shows surfaces with different densities are mixed distributed. Notably, in these areas, the estimated results by the proposed method can satisfactorily interpret the actual complex spatial pattern of the impervious surfaces, which is consistent with the field survey. In areas where high-density impervious surfaces distribute, the estimated results by SAM-based regression analysis were dominant, avoiding the underestimation by LSMA. In contrast, LSMA is more influential in the final estimation in areas where low/medium-density impervious surfaces distribute, taking full advantage of its ability to analyze mixed pixels. (3) The error of the proposed method primarily results from underestimation caused by shadows (C3 and C7). As indicated by C6, the limitation of the TM image resolution can be another factor that affects the accuracy. The impervious density of line artificial features, such as roads, tend to be underestimated.
Conclusion
Remote sensing-based impervious surface estimation is fundamental in urban environmental studies. In this research, a SAM-based regression analysis model is introduced to reduce the error of LSMA. With these improvements, the poorly estimated pixels by LSMA were discerned and modified. The proposed method profits from both the LSMA and SAM-based regression analysis methods as indicated by accuracy assessment. As a result, the overall accuracy of the impervious surface estimation at the subpixel level is remarkably improved compared to the conventional methods.
It is particularly significant to improve LSMA since it is one of the most widely used methods for impervious surface estimation. With higher overall accuracy, producer’s and user’s accuracy, the improved method is proven accurate, objective, and repeatable. Besides, it is also indicated by the ground truth data of the field survey that the proposed method can interpret the actual complex spatial pattern of the impervious surfaces, which is challenging to be detected even in a high-resolution image.
However, it is non-negligible that the misestimation caused by shadows so far limits the accuracy of low/medium-density impervious surfaces. In the future study, it is worth trying to employ more improving approaches for the current impervious surface estimation. It may include a more accurate calculation of building shadows’ impervious density and an in-depth analysis of error sources inside the LSMA model itself. Further improvements shall appear with these approaches.
Disclosure statement
No potential conflict of interest was reported by the author(s).
Data availability statement
The medium-resolution remote sensing image used for this research can be acquired via USGS (https://earthexplorer.usgs.gov/). Ancillary land census data and the high-resolution remote sensing image are subject to the permission of third parties (Ministry of Land and Resources, China, and Space View Science and Technology Co. Ltd.).
Additional information
Funding
References
- Arnold, C. L., Jr, & Gibbons, C. J. (1996). Impervious surface coverage: The emergence of a key environmental indicator. Journal of the American Planning Association, 62(2), 243–258. https://doi.org/10.1080/01944369608975688
- Bauer, M. E., Loffelholz, B. C., & Wilson, B. (2007). Estimating and mapping impervious surface area by regression analysis of Landsat imagery. In Q. Weng (Ed.), Remote sensing of impervious surfaces (pp. 3–19). CRC Press.
- Cao, S., Hu, D., Zhao, W., Mo, Y., Yu, C., & Zhang, Y. (2019). Monitoring changes in the impervious surfaces of urban functional zones using multisource remote sensing data: A case study of Tianjin, China. GIScience & Remote Sensing, 56(7), 967–987. https://doi.org/10.1080/15481603.2019.1600110
- Chai, T., & Draxler, R. R. (2014). Root mean square error (RMSE) or mean absolute error (MAE)?–Arguments against avoiding RMSE in the literature. Geoscientific Model Development, 7(3), 1247–1250. https://doi.org/10.5194/gmd-7-1247-2014
- Civco, D. L., Hurd, J. D., Wilson, E. H., Arnold, C. L., & Prisloe, M. P. (2002). Quantifying and describing urbanizing landscapes in the northeast United States. Photogrammetric Engineering and Remote Sensing, 68(10), 1083–1090 https://trid.trb.org/view/727236.
- Clapham, W. B., Jr. (2003). Continuum-based classification of remotely sensed imagery to describe urban sprawl on a watershed scale. Remote Sensing of Environment, 86(3), 322–340. https://doi.org/10.1016/S0034-4257(03)00076-2
- Deng, C., & Zhu, Z. (2020). Continuous subpixel monitoring of urban impervious surface using Landsat time series. Remote Sensing of Environment, 238, 2020, 110929. https://doi.org/10.1016/j.rse.2018.10.011
- Dennison, P. E., Halligan, K. Q., & Roberts, D. A. (2004). A comparison of error metrics and constraints for multiple endmember spectral mixture analysis and spectral angle mapper. Remote Sensing of Environment, 93(3), 359–367. https://doi.org/10.1016/j.rse.2004.07.013
- Dicembre, A., & Ricci, S. (2011). Railway traffic on high density urban corridors: Capacity, signalling and timetable. Journal of Rail Transport Planning & Management, 1(2), 59–68. https://doi.org/10.1016/j.jrtpm.2011.11.001
- Elvidge, C. D., Tuttle, B. T., Sutton, P. C., Baugh, K. E., Howard, A. T., Milesi, C., Bhaduri, B., & Nemani, R. (2007). Global distribution and density of constructed impervious surfaces. Sensors, 7(9), 1962–1979. https://doi.org/10.3390/s7091962
- Esch, T., Himmler, V., Schorcht, G., Thiel, M., Wehrmann, T., Bachofer, F., Conrad, C., Schmidt, M., & Dech, S. (2009). Large-area assessment of impervious surface based on integrated analysis of single-date Landsat-7 images and geospatial vector data. Remote Sensing of Environment, 113(8), 1678–1690. https://doi.org/10.1016/j.rse.2009.03.012
- Fan, F., & Deng, Y. (2014). Enhancing endmember selection in multiple endmember spectral mixture analysis (MESMA) for urban impervious surface area mapping using spectral angle and spectral distance parameters. International Journal of Applied Earth Observation and Geoinformation, 33, 2014, 290–301. https://doi.org/10.1016/j.jag.2014.06.011
- Fu, H., Shao, Z., Tu, C., & Zhang, Q. (2016). Impacts of feature selection for urban impervious surface extraction using optical image and SAR data. (Ed.), (Eds.). 2016 4th International Workshop on Earth Observation and Remote Sensing Applications (EORSA) Guangzhou, China: IEEE.
- Hao, P., Niu, Z., Zhan, Y., Wu, Y., Wang, L., & Liu, Y. (2016). Spatiotemporal changes of urban impervious surface area and land surface temperature in Beijing from 1990 to 2014. GIScience & Remote Sensing, 53(1), 63–84. https://doi.org/10.1080/15481603.2015.1095471
- Hsieh, P. F., Lee, L. C., & Chen, N. Y. (2001). Effect of spatial resolution on classification errors of pure and mixed pixels in remote sensing. IEEE Transactions On Geoscience and Remote Sensing, 39(12), 2657–2663. https://doi.org/10.1109/36.975000.
- Hu, X., & Weng, Q. (2009). Estimating impervious surfaces from medium spatial resolution imagery using the self-organizing map and multi-layer perceptron neural networks. Remote Sensing of Environment, 113(10), 2089–2102. https://doi.org/10.1016/j.rse.2009.05.014
- Hui, E. C. M., & Yu, K. H. (2013). Commuting patterns of residents within a high-density urban development: A study of Hong Kong. Habitat International, 39(2013), 201–213. https://doi.org/10.1016/j.habitatint.2012.12.008
- Im, J., Lu, Z., Rhee, J., & Quackenbush, L. J. (2012). Impervious surface quantification using a synthesis of artificial immune networks and decision/regression trees from multi-sensor data. Remote Sensing of Environment, 117 2012 , 102–113. https://doi.org/10.1016/j.rse.2011.06.024
- Ji, M., & Jensen, J. R. (1999). Effectiveness of subpixel analysis in detecting and quantifying urban imperviousness from Landsat Thematic Mapper imagery. Geocarto International, 14(4), 33–41. https://doi.org/10.1080/10106049908542126
- Kavzoglu, T., & Mather, P. M. (2003). The use of backpropagating artificial neural networks in land cover classification. International Journal of Remote Sensing, 24(23), 4907–4938. https://doi.org/10.1080/0143116031000114851
- Kotarba, A. Z., & Aleksandrowicz, S. (2016). Impervious surface detection with nighttime photography from the International Space Station. Remote Sensing of Environment, 176, 2016, 295–307. https://doi.org/10.1016/j.rse.2016.02.009
- Kruse, F. A., Lefkoff, A. B., Boardman, J. W., Heidebrecht, K. B., Shapiro, A. T., Barloon, P. J., & Goetz, A. F. H. (1993). The spectral image processing system (SIPS)-interactive visualization and analysis of imaging spectrometer data. Remote Sensing of Environment, 44(2–3), 145–163. https://doi.org/10.1016/0034-4257(93)90013-N
- Li, C., Du, J., Su, Y., Li, Q., & Chen, L. (2010). Extraction of impervious surface based on multi-source satellite data of Qinhuai River basin from 1979–2009. (Ed.),^(Eds.). 2010 18th International Conference on Geoinformatics Beijing, China: IEEE.
- Li, W., Ouyang, Z., Zhou, W., & Chen, Q. (2011). Effects of spatial resolution of remotely sensed data on estimating urban impervious surfaces. Journal of Environmental Sciences, 23(8), 1375–1383. https://doi.org/10.1016/S1001-0742(10)60541-4
- Li, W., & Wu, C. (2016). A geostatistical temporal mixture analysis approach to address endmember variability for estimating regional impervious surface distributions. GIScience & Remote Sensing, 53(1), 102–121. https://doi.org/10.1080/15481603.2015.1118975
- Lu, D., Hetrick, S., & Moran, E. (2011). Impervious surface mapping with Quickbird imagery. International Journal of Remote Sensing, 32(9), 2519–2533. https://doi.org/10.1080/01431161003698393
- Lu, D., Moran, E., & Hetrick, S. (2011). Detection of impervious surface change with multitemporal Landsat images in an urban–rural frontier. ISPRS Journal of Photogrammetry and Remote Sensing, 66(3), 298–306. https://doi.org/10.1016/j.isprsjprs.2010.10.010
- Lu, D., & Weng, Q. (2006). Use of impervious surface in urban land-use classification. Remote Sensing of Environment, 102(1–2), 146–160. https://doi.org/10.1016/j.rse.2006.02.010
- Lu, D., & Weng, Q. (2009). Extraction of urban impervious surfaces from an IKONOS image. International Journal of Remote Sensing, 30(5), 1297–1311. https://doi.org/10.1080/01431160802508985
- Ma, T., Zhou, C., Pei, T., Haynie, S., & Fan, J. (2012). Quantitative estimation of urbanization dynamics using time series of DMSP/OLS nighttime light data: A comparative case study from China’s cities. Remote Sensing of Environment, 124, 2012, 99–107. https://doi.org/10.1016/j.rse.2012.04.018
- Ng, E., Yuan, C., Chen, L., Ren, C., & Fung, J. C. H. (2011). Improving the wind environment in high-density cities by understanding urban morphology and surface roughness: A study in Hong Kong. Landscape and Urban Planning, 101(1), 59–74. https://doi.org/10.1016/j.landurbplan.2011.01.004
- Phinn, S., Stanford, M., Scarth, P., Murray, A., & Shyy, P. (2002). Monitoring the composition of urban environments based on the vegetation-impervious surface-soil (VIS) model by subpixel analysis techniques. International Journal of Remote Sensing, 23(20), 4131–4153. https://doi.org/10.1080/01431160110114998
- Ren, C., Lau, K. L., Yiu, K. P., & Ng, E. (2013). The application of urban climatic mapping to the urban planning of high-density cities: The case of Kaohsiung, Taiwan. Cities, 31, 1–16. https://doi.org/10.1016/j.cities.2012.12.005
- Ridd, M. K. (1995). Exploring a V-I-S (vegetation-impervious surface-soil) model for urban ecosystem analysis through remote sensing: Comparative anatomy for cities. International Journal of Remote Sensing, 16 1995 , 2165–2185. https://doi.org/10.1080/01431169508954549
- Roberts, D. A., Batista, G., Pereira, J., Waller, E., & Nelson, B. (1999). Change identification using multitemporal spectral mixture analysis: Applications in eastern Amazonia. In R.S. Lunetta & C. Elvidge (Eds.), Remote sensing change detection: Environmental monitoring methods and applications (pp. 137–161). Ann Arbor Press.
- Scott, D., Petropoulos, G. P., Moxley, J., & Malcolm, H. (2014). Quantifying the physical composition of urban Morphology throughout Wales based on the time series (1989–2011) analysis of Landsat TM/ETM+ images and supporting GIS data. Remote Sensing, 6(12), 11731–11752. https://doi.org/10.3390/rs61211731
- Shao, Y., Li, G. L., Guenther, E., & Campbell, J. B. (2015). Evaluation of topographic correction on subpixel impervious cover mapping with CBERS-2B data. IEEE Geoscience and Remote Sensing Letters, 12(8), 1675–1679. https://doi.org/10.1109/LGRS.2015.2419135
- Shao, Z., & Liu, C. (2014). The integrated use of DMSP-OLS nighttime light and MODIS data for monitoring large-scale impervious surface dynamics: A case study in the Yangtze River Delta. Remote Sensing, 6(10), 9359–9378. https://doi.org/10.3390/rs6109359
- Small, C., & Lu, J. W. (2006). Estimation and vicarious validation of urban vegetation abundance by spectral mixture analysis. Remote Sensing of Environment, 100(4), 441–456. https://doi.org/10.1016/j.rse.2005.10.023
- Sutton, P. C., Anderson, S. J., Elvidge, C. D., Tuttle, B. T., & Ghosh, T. (2009). Paving the planet: Impervious surface as proxy measure of the human ecological footprint. Progress in Physical Geography, 33(4), 510–527 https://doi.org/10.1177/0309133309346649.
- Weng, Q., Hu, X., & Liu, H. (2009). Estimating impervious surfaces using linear spectral mixture analysis with multitemporal ASTER images. International Journal of Remote Sensing, 30(18), 4807–4830. https://doi.org/10.1080/01431160802665926
- Weng, Q. (2001). Modeling urban growth effects on surface runoff with the integration of remote sensing and GIS. Environmental Management, 28(6), 737–748. https://doi.org/10.1007/s002670010258
- Weng, Q. (2012). Remote sensing of impervious surfaces in the urban areas: Requirements, methods, and trends. Remote Sensing of Environment, 117(2012), 34–49. https://doi.org/10.1016/j.rse.2011.02.030
- Wickham, J., Herold, N., Stehman, S. V., Homer, C., Xian, G., & Claggett, P. (2018). Accuracy assessment of NLCD 2011 impervious cover data for the Chesapeake Bay region, USA. ISPRS Journal of Photogrammetry and Remote Sensing, 146(2018), 151–160. https://doi.org/10.1016/j.isprsjprs.2018.09.010
- Willmott, C. J., & Matsuura, K. (2005). Advantages of the mean absolute error (MAE) over the root mean square error (RMSE) in assessing average model performance. Climate Research, 30(1), 79–82. https://doi.org/10.3354/cr030079
- Wu, C., & Murray, A. T. (2003). Estimating impervious surface distribution by spectral mixture analysis. Remote Sensing of Environment, 84(4), 493–505. https://doi.org/10.1016/S0034-4257(02)00136-0
- Wu, C. (2004). Normalized spectral mixture analysis for monitoring urban composition using ETM+ imagery. Remote Sensing of Environment, 93(4), 480–492. https://doi.org/10.1016/j.rse.2004.08.003
- Xia, J.-S., Du, P.-J., & Cao, W. (2011). Urban impervious surface extraction from remote sensing image based on nonlinear spectral mixture model. Acta Photonica Sinica, 40(1), 13–18. https://doi.org/10.3788/gzxb20114001.0013
- Xian, G., Crane, M., & McMahon, C. (2008). Quantifying multi-temporal urban development characteristics in Las Vegas from Landsat and ASTER data. Photogrammetric Engineering and Remote Sensing, 74(4), 473–481. https://doi.org/10.14358/PERS.74.4.473
- Xian, G., Crane, M., & Steinwand, D. (2005). Dynamic modeling of Tampa Bay urban development using parallel computing. Computers & Geosciences, 31(7), 920–928. https://doi.org/10.1016/j.cageo.2005.03.006
- Xian, G., & Crane, M. (2005). Assessments of urban growth in the Tampa Bay watershed using remote sensing data. Remote Sensing of Environment, 97(2), 203–215. https://doi.org/10.1016/j.rse.2005.04.017
- Xian, G. (2007). Mapping impervious surfaces using classification and regression tree algorithm. In Q. Weng (Ed.), Remote sensing of impervious surfaces (pp. 39–58). CRC Press.
- Xu, J., Zhao, Y., Zhong, K., Zhang, F., Liu, X., & Sun, C. (2018). Measuring spatio-temporal dynamics of impervious surface in Guangzhou, China, from 1988 to 2015, using time-series Landsat imagery. Science of the Total Environment, 627(2018), 264–281. https://doi.org/10.1016/j.scitotenv.2018.01.155
- Yang, F., Qian, F., & Lau, S. S. Y. (2013). Urban form and density as indicators for summertime outdoor ventilation potential: A case study on high-rise housing in Shanghai. Building and Environment, 70(2013), 122–137. https://doi.org/10.1016/j.buildenv.2013.08.019
- Yang, L., Huang, C., Homer, C. G., Wylie, B. K., & Coan, M. J. (2003). An approach for mapping large-area impervious surfaces: Synergistic use of Landsat-7 ETM+ and high spatial resolution imagery. Canadian Journal of Remote Sensing, 29(2), 230–240. https://doi.org/10.5589/m02-098
- Yang, L., Jiang, L., Lin, H., & Liao, M. (2009). Quantifying sub-pixel urban impervious surface through fusion of optical and InSAR imagery. GIScience & Remote Sensing, 46(2), 161–171. https://doi.org/10.2747/1548-1603.46.2.161
- Yang, L., Xian, G., Klaver, J. M., & Deal, B. (2003). Urban land-cover change detection through sub-pixel imperviousness mapping using remotely sensed data. Photogrammetric Engineering and Remote Sensing, 69(9), 1003–1010. https://doi.org/10.14358/PERS.69.9.1003
- Yu, Y., Guan, J., Ma, Y., Yu, S., Guo, H., & Bao, L. (2010). Aquatic environmental quality variation in Lake Dianchi Watershed. Procedia Environmental Sciences, 2(2010), 76–81. https://doi.org/10.1016/j.proenv.2010.10.011
- Yuan, F., & Bauer, M. E. (2007). Comparison of impervious surface area and normalized difference vegetation index as indicators of surface urban heat Island effects in Landsat imagery. Remote Sensing of Environment, 106(3), 375–386. https://doi.org/10.1016/j.rse.2006.09.003
- Yuan, F., Wu, C., & Bauer, M. E. (2008). Comparison of spectral analysis techniques for impervious surface estimation using Landsat imagery. Photogrammetric Engineering and Remote Sensing, 74(8), 1045–1055. https://doi.org/10.14358/PERS.74.8.1045
- Zhang, C., Chen, Y., & Lu, D. (2015). Detecting fractional land-cover change in arid and semiarid urban landscapes with multitemporal Landsat Thematic mapper imagery. GIScience & Remote Sensing, 52(6), 700–722. https://doi.org/10.1080/15481603.2015.1071965
- Zhang, H., Li, H., & Chen, Z. (2011). Analysis of land use dynamic change and its impact on the water environment in Yunnan Plateau lake area: A case study of the Dianchi Lake drainage area. Procedia Environmental Sciences, 10(2011), 2709–2717. https://doi.org/10.1016/j.proenv.2011.09.421
- Zhang, J., Heng, C. K., Malone-Lee, L. C., Hii, D. J. C., Janssen, P., Leung, K. S., & Tan, B. K. (2012). Evaluating environmental implications of density: A comparative case study on the relationship between density, urban block typology and sky exposure. Automation in Construction, 22(2012), 90–101. https://doi.org/10.1016/j.autcon.2011.06.011
- Zhang, L., & Weng, Q. (2016). Annual dynamics of impervious surface in the Pearl River Delta, China, from 1988 to 2013, using time series Landsat imagery. ISPRS Journal of Photogrammetry and Remote Sensing, 113(2016), 86–96. https://doi.org/10.1016/j.isprsjprs.2016.01.003
- Zhang, Q., & Seto, K. C. (2011). Mapping urbanization dynamics at regional and global scales using multi-temporal DMSP/OLS nighttime light data. Remote Sensing of Environment, 115(9), 2320–2329. https://doi.org/10.1016/j.rse.2011.04.032
- Zhao, Y., Zhang, K., Fu, Y., & Zhang, H. (2012). Examining land-use/land-cover change in the Lake Dianchi watershed of the Yunnan-Guizhou plateau of southwest China with remote sensing and GIS techniques: 1974-2008. International Journal of Environmental Research and Public Health, 9(11), 3843–3865. https://doi.org/10.3390/ijerph9113843