
ABSTRACT
The Zagros fold and thrust belt as one of the structurally complex areas have been considered chiefly only for hydrocarbon reserves, despite having other mineral deposits like the Surmeh lead and Zinc mine. This study was conducted in the Fars region, one of the structural zones in the Zagros, to detect hydrothermal alteration minerals associated with Pb–Zn mineralization and fracture distribution using ASTER, Landsat 8, and Sentinel 2 satellite imagery. Using different algorithms and approaches, we demonstrate the interesting distribution of Pb-Zn-related mineral deposits controlled by structures on different scales. These methods included the spectral band ratios and spectral angle mapping for alteration detection and manual extraction of structural lineaments (i.e. fault and fractures) from ETM+. Also, an augmented circular scanline method, along with areal sampling, was used to prepare a fracture intensity map of the area. According to the results, the intersection of NW-SE and N-S trending fracture sets are promising areas for Pb-Zn-related mineral exploration. These fracture sets are likely associated with the main Karebas tear fault and its horsetail splay terminal. The findings of this study were validated by field observation of the Pb-Zn deposit and its related mineral associations in the area.
Introduction
Lineament and hydrothermal alteration mapping as the most important applications of remote sensing in the fields of structural geology have been successfully used for the investigation of mesoscale phenomena and mineral exploration around the world (El-Wahed et al., Citation2021; Pour et al., Citation2021; Takodjou Wambo et al., Citation2020) and in Iran (Bolouki et al., Citation2020; Sekandari, Masoumi, Pour, Muslim, et al., Citation2020;).
The formation of hydrothermal deposits involves four key elements: a metal source, a fluid source, a circulation engine, and a precipitation site and mechanism. Hydrothermal deposits generally show a spatial association with faults, and fractures at different scales (Austin and Blenkisop, Citation2009; Zoheir and Emam, Citation2014; Meshkani et al., Citation2013; Zoheir et al., Citation2019). These structures increase the porosity and permeability of rocks, which then act as channels for hydrothermal fluid circulation.
Generally, during weathering of the sulfide minerals (i.e. pyrite, chalcopyrite, sphalerite, and galena), an oxidizing agent such as O2 participates with ferric iron in the formation of non-sulfide minerals (i.e. Pb+2, H+, Fe2+, Fe3+, Fe(SO4)3), acidic and sulfated fluids (Ortiz-Castillo et al., Citation2022; Reichert & Borg, Citation2008). Consequently, the generated non-sulfide minerals appear as a “red ore” on the surface. The red ore commonly consists of iron oxides and iron hydroxides (mainly Goethite and Hematite), indicating the presence of anglesite, hemimorphite, smithsonite, hydrozincite, and cerussite in higher depths (Maghfouri et al., Citation2018).
The tendency of FeO/OH minerals (e.g. hematite, goethite, and jarosite) to spectral absorption in the visible to middle infrared spectrum due to the presence of Fe2+ and Fe3+ makes it possible to use satellite images to map the hydrothermally altered rocks through different remote sensing techniques (Hunt & Ashley, Citation1979; Sekandari, Masoumi, Pour, Muslim, et al., Citation2020). This is because different bands of the satellite images have special spectral features that could be coincident with spectral characteristics of mineral compositions. ASTER, Sentinel, and Landsat satellite imagery provides multispectral remote sensing data appropriate for the identification of hydrothermal alteration minerals and zones associated with mineralization (Pour and Hashim Citation2012, Bolouki et al., Citation2020).
Besides, the fault/fracture density is also one of the most important parameters controlling the hydrothermal fluid flow and the location of ore mineralization, which can be mapped using spectral bands of Landsat and ASTER imagery (Tripp and Vearncombe Citation2004, Rossetti et al. Citation2011). Lineaments can be mapped due to their physiographic features that caused the tonal change in contrast to the relief, pattern, and textures in the satellite image.
So far, numerous studies have been conducted for iron oxide and hydrothermal alteration-related mineralization using spatial approaches, Band Ratio (BR), Principal Component Analysis (PCA), and spectral angle mapping (SAM), on different multispectral sensors (Oli/Tir, ASTER, Sentinel 2) in Iran (Ahmadi & Uygucgil, Citation2021; Bolouki et al., Citation2020; Pour et al., Citation2021; Moradpour et al. 2022Sekandari, et al., ; Sekandari, Masoumi, Pour, Muslim, et al., Citation2020; Sheikhrahimi et al., Citation2019). However, a few remote sensing studies were carried out for Pb-Zn exploration in Iran. For example, Sekandari, Masoumi, Pour, Muslim, et al. (Citation2020) used Landsat-8, Sentinel-2, ASTER, and WorldView-3 for prospecting Zn-Pb mineralization in the central part of the Kashmar – Kerman Tectonic Zone (KKTZ), the Central Iranian Terrane (CIT).
The Zagros Fold-Thrust Belt (ZFTB), approximately 1800 km in length, is one of the most important hydrocarbon-rich belts in the world. Most of the studies in the ZFTB have been done on hydrocarbon resource exploration, and very few studies have been conducted to explore metal resources. The only known Zn-Pb deposit in the region is the Surmeh anticline deposit with a definite reserve of 2,300,000 tons of sulfide ore and 500,000 tons of non-sulfide ore (Fazli et al., Citation2018, Citation2019). Previous remote sensing studies have not systematically investigated the ZFTB, by the integration of alteration and structural features for ore deposits. For instance, Rasouli Beirami and Tangestani (Citation2020) developed a new approach for the discrimination of calcite (limestone) and dolomite (dolostone) because of their association with carbonate-hosted lead–zinc ore deposits (Leach et al. Citation2017) by utilizing data from ASTER in the Zagros Fold and Thrust Belt (ZFTB), SW Iran.
Due to the important role of structural geology in natural resource distribution, this study intends to investigate and detect the potential for the presence of metal deposits, Zn-Pb, and their relationship with the structural setting in a part of ZFTB, focusing on remote sensing techniques. The study area was chosen to include several geological structures such as anticlines, fractures, and salt diapirs to detect the influence of structural elements on mineral distribution. This study could give hints about the distribution of ore deposits, especially Zn-Pb deposits, relevant to structural features throughout fold-thrust belts.
The Kuh-e-Surmeh anticline as a mining part of the study area has been studied previously by some researchers that mainly focused on the determination of the genetic type of the ore mineralization. For instance, Liaghat et al. (Citation2000) presented a genetic model which suggests that the concentration of the ore metals is the result of the dewatering of the Zard-Kuh basin, in the vicinity of Surmeh, due to regional compaction tectonism and expulsion of basin-derived fluids into the highly porous and brecciated dolomitized rocks of the Dalan Formation. According to previous studies (Fazli et al., Citation2018, Citation2019; Moeini), two types of sulfide and non-sulfide ores have participated in the Surmeh anticline. The sulfide ore has been preserved at a depth of 153 m (Fazli et al., Citation2018, Citation2019), and the main minerals are galena, sphalerite, pyrite, quartz, and K-feldspar. Non-sulfide ore has been formed due to the impact of weathering of sulfide ore at the surface and contains gypsum, anglesite, clay minerals, iron oxides, and iron hydroxides (Pirajno et al., Citation2010).
Finally, the main objective of this study is to use various spectral data sources, and different image processing methods to detect surface alteration minerals, associated with Pb-Zn mineralization, and structural lineaments to understand the relation between mineralization and different fracture sets, as potential sites for fluid circulation, at the study area. The results could be used for prospecting of Pb-Zn deposits throughout other parts of the world.
Geological and structural setting
This study was conducted in the Fars region of the Zagros Fold-Thrust Belt (ZFTB), which is located in SW Iran. The ZFTB is a long belt of folded and faulted crustal rocks formed between the Saudi-Eurasian plates due to the convergence of the Arabian plate and the Central Iran plate and the closure of the Neo-Tethys ocean in the Alpine-Himalayan orogenic system (Alavi, Citation2004).
This zone is divided into different subzones based on structural style, facies, and lithological content, including the Lurestan, Abadan Plain, Dezful Embayment, Izeh zone, Fars, and Bandar-Abbas Hinterland (Falcon, 1961, 1981; Ghorbani, Citation2021; Roozpeykar & Moghaddam, Citation2016) (). The Abadan Plain, Dezful Embayment, and Izeh zone, as the main petroliferous area of the Zagros, are separated from Lurestan by the Balaroud fault system and also from Fars by the Kazerun Fault system. Originated diapirs from the Hormuz Salt series are the main feature of the Fars and Bandar-Abbas Hinterland. These subzones are surrounded between the Minab fault from the east and Kazerun Fault from the west. The study area is located in the Fars sub-zone close to the NNW–SSE trending Karebas Fault system .
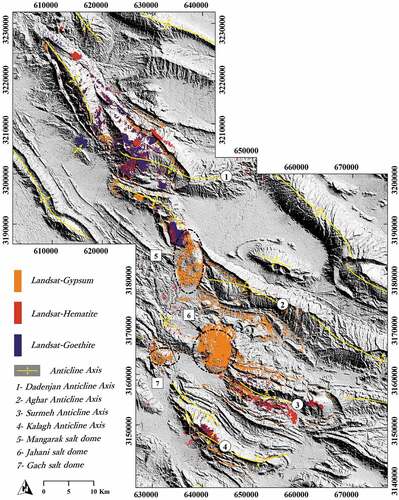
Figure 1. Different structural zones of the Zagros Fold and Thrust Belt, the study area is shown by the square (modified after Casini et al., (Citation2011).; Homke et al., Citation2009). b) Structural map of the study area including the trace of anticlines axes, salt domes, and main faults. c) Geological map of the study area.
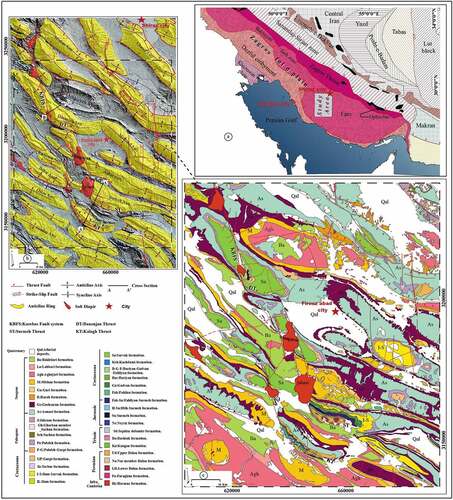
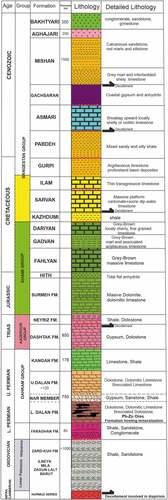
The Hormoz Series (Precambrian), the Dehram Group (upper Permian – lower Triassic), and the Surmeh Formation (Late Jurassic in age) have formed the oldest outcrops in the region (). The Dehram Group (Carbonates, upper Permian – lower Triassic) and the Surmeh Formation (Carbonates, Late Jurassic) have been outcropped in the core of Surmeh anticline and along with the limbs of the Salamati and Dadenjan diapirs, respectively (). The lower Dalan Formation, overlaid by the Kangan Formation, formed the main host rock for mineralization in the Surmeh anticline Pb-Zn deposit. The Dalan Formation is covered by the evaporitic Nar Member in the study area (). The Khami groups (Jurassic – lower cretaceous), Bangestan Group (upper cretaceous), Tertiary, and Quaternary successions are also presented in the study area ().
Figure 2. Lithological and stratigraphic columns of the study area (not to scale) (modified after Liaghat et al., Citation2000).
The dominant structural elements in this part of the ZFTB include detachment folding and salt diapirs originating from the Hormuz evaporitic Series, the NW-SE trending basement-involved thrusts, and N-S trending basement-involved tear faults. The NW-SE faults in the study area are expanded in the southern limb of the Surmeh, Kalagh, and Dadenjan anticlines and seem to be horsetail structures associated with the dextral Karebas tear Fault system () (Berberian, Citation1995; Jahani et al., Citation2017; Lacombe et al., Citation2006; Talbot et al., Citation1996). The NW-SE trending Surmeh Fault is classically interpreted as the SE termination of the Karebas Fault (e.g. Berberian, Citation1995; ), and thrusting on the former would be intimately linked to strike-slip motion on the latter. Basement-involved thrusting on the Surmeh Fault would have permitted the exhumation of the oldest sedimentary units (Palaeozoic) of the Fars arc in the core of the Surmeh anticline. Focal mechanisms indicate that both thrust and strike-slip faults are present in the basement and/or lowest part of the sedimentary cover (Oveisi et al., Citation2009).
From the geological and metallogenic point of view, the Zagros orogenic belt is subdivided into the Zagros Fold and Thrust Belt (ZFTB), Sanandaj-Sirjan Zone (SSZ), and Urumieh-Dokhtar Magmatic Assemblage (UDMA) (Ghasemi & Talbot, Citation2006) ().
The SSZ and UDMB zones are the main metalorganic zones for several kinds of metal, e.g. lead-zinc (Pb-Zn) deposits (Fazli et al., Citation2019; Rajabi et al., Citation2013; Taghipour & Ahmadnejad, Citation2015). The Central Iran zone was divided into three metallogenic belts including, Anarak-Yazd, Malayer-Isfahan, and Tabbas regions (Maghfouri et al., Citation2018). The most well-known Pb and Zn Ores are located in the Malayer-Isfahan zone (Rajabi et al., Citation2013).
Natural resources, such as metal-rich ores, have been deposited due to the interaction of compression-driven fluids with evaporitic layers, salt domes, and fractures (Moragas et al., Citation2020; Perona et al., Citation2018; Reuning et al., Citation2009). Also, processes of hydrocarbon and metal-rich fluids migration within the ZFTB have probably been influenced by folding, diapirism of the Hormoz series, and reactivation of basement faults (Hassanpour et al., Citation2021; Hosseinpour et al., Citation2017; Molchanova & Ruban, Citation2019).
Material and methods
This study attempts to introduce the best set of satellite imagery data and algorithms to detect the Pb-Zn mineralization-related alteration in the ZFTB, Iran. In this regard, determining the relationship between mineralization and main structures within the area has been considered and highlighted for the first time.
In this study, to detect mineral alteration based on surface changes, caused by weathering (non-sulfide deposits), ASTER, Landsat 8, and Sentinel satellite imagery (USGS-EROS; http://earthexplorer.usgs.gov/) were used ().
Table 1. Characteristics of acquired satellite imagery data.
Sentinel-2 is composed of 13 spectral bands including 6 bands in the short-wave infrared (SWIR) and seven bands in the visible, and near-infrared (VNIR). Commonly, SWIR region bands are capable of detecting clay minerals, and VNIR region bands are used to detect iron oxide, and hydroxide minerals (Ahmadirouhani et al., Citation2018; Pour et al., Citation2018; Sheikhrahimi et al., Citation2019). ASTER contains 14 bands in the three spectral regions, including three bands in the VNIR (from 0.5 to 0.8 µm wavelength), six bands in the SWIR (between 1.6 and 2.43 µm wavelength), and five bands in the TIR (from 8.1 to 11.6 µm wavelength). Six bands of ASTER in the SWIR regions are capable of detecting the carbonate, clay, and FeO/OH minerals (Ahmadirouhani et al., Citation2018; Pour et al., Citation2018; Sheikhrahimi et al., Citation2019) ().
Figure 3. The bands of the Sentinel-2 sensor, in comparison to Landsat 8, and ASTER. Atmospheric transmittance (%) is plotted in a pink shade against the Y-axis.
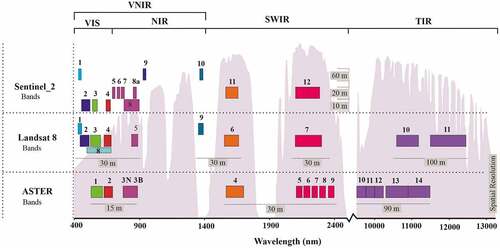
Landsat 8 (OLI) with seven bands in VNIR and SWIR domains as another spectral data source is commonly used for mineral alteration detection (). The SWIR domain of Landsat 8 (bands 6 and 7) can detect and map lithology, and some minerals such as clay, ferric iron, oxide, hydroxide, and sulfates.
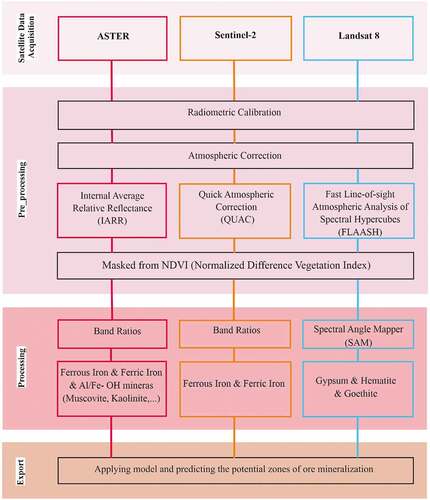
ENVI 5.3 and ArcGIS 10.8 as the two main image processing software were used to process the remote sensing datasets in this study. Preprocessing of data was started by applying radiometric correction (IAR reflectance method) on ASTER, Landsat 8, and Sentinel-2 images to improve the data quality (Chander et al., Citation2007; Chandler et al., Citation2004; Teillet et al., Citation2001) (). It must be mentioned that the created distortions due to the topography are already removed from the ASTER level 1T data; therefore, it is not necessary to apply geometric correction on this data. For the atmospheric correction of Sentinel-2, ASTER, and Landsat 8 image data, Quick Atmospheric Correction (QUAC), Internal Average Relative Reflectance (IARR) calibration, and Fast Line of Sight Atmospheric Analysis Spectral Hypercubes (FLAASH) algorithm methods were used, respectively. Model QUAC is a method of atmospheric correction for hyperspectral and multispectral images. QUAC is different from the first-principle atmospheric correction because it obtains atmospheric compensating parameters directly from the image (Guo & Zeng, Citation2012). QUAC is based on experience to collect the average reflectance of different substances, such as the endmember spectrum in the field of vision (Liu et al., Citation2022). Also, the IARR method normalizes image spectra but derives the mean spectrum from the entire image. Before computing the spectrum, the radiance values in each image spectrum are scaled so that their sum is constant over the entire image. This adjustment largely removes topographic shading and other overall brightness variations (Guha et al., Citation2014; Guo & Zeng, Citation2012; Upadhyay, Citation2012). FLAASH is a tool for first-principle atmospheric correction, which can enhance visible light, near-infrared light, and shortwave infrared light. It can also eliminate most of the influence that the air, light and other factors have on clutter reflectance, to obtain more accurate parameters of reflectivity, emissivity, surface temperature, and real physical models of surfaces (Guo & Zeng, Citation2012). FLAASH algorithm was applied to Landsat-8 by implementing the Tropical and Urban aerosol models.
Figure 4. An overview of the workflow used in this study.
Generally, the band ratios method of image processing involves highlighting the pixels with a particular type of mineral using rationing of bands that correspond to certain absorptions and reflectance of hydrothermal alteration minerals. This method was broadly used around the world by different scholars (e.g. Gopinathan et al., Citation2020; Hadigheh & Ranjbar, Citation2013; Honarmand et al., Citation2012; Mars & Rowan, Citation2006; Pour et al., Citation2018; Rajendran & Sobhi Nasir, Citation2013).
The spectral band ratio of the Sentinel and ASTER image data was used to detect alteration zones in this study. These band ratios were defined based on the spectral characteristics of hydrothermal alteration associated with minerals.
Accordingly, ASTER B2/B1 band ratio was used to map the ferric iron mineral distribution as previously used by Rowan and Mars (Citation2003) and Moghtaderi et al. (Citation2017) in another area due to the intense Fe3+ absorption in ASTER 2/1 band ratio (red wavelengths/green wavelengths).
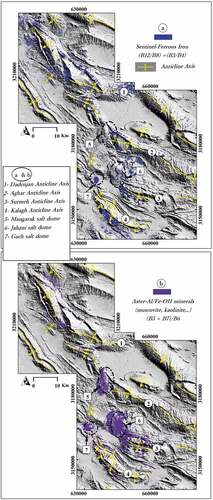
The ASTER (B5/B3+B1/B2) and (B5+B7/B6) band ratios were used to detect Fe2+ and Al/Fe-OH-bearing minerals, respectively, according to the work of Rowan and Mars (Citation2003) and Fatima et al. (Citation2017).
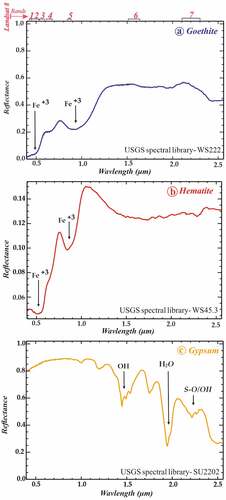
The (B12/B8)+(B3/B4) and (B4/B3) band ratios of Sentinel-2 were also used to detect and map Ferrous and Ferric iron-bearing minerals in the study area, respectively. Generally, these types of minerals act as one of the most crucial indicators of hydrothermal alteration. The existence of transition elements such as Fe2+ and Fe3+ in iron oxide and iron hydroxide minerals (e.g. hematite, limonite, and goethite) causes the absorption features in the visible and near-infrared radiation (0.4 to 1.1 μm); therefore, the USGS standard spectral library was used to map these minerals by applying the SAM method. shows Hematite, Goethite, and Gypsum identified using Landsat 8 data according to the spectral matching between Landsat image and laboratory standard spectra.
Figure 5. The laboratory reflectance spectra of hematite, goethite, and gypsum resampled to response functions of VINR+SWIR bands of Landsat-8. The main absorption feature spectra attributed to Fe +2, Fe +3, OH, H2O, and S-O/OH are delimited by black arrows.
Since several bands of Sentinel-2 have absorption and reflection features of iron oxide/hydroxide, unlike the ASTER and Landsat, which have only one band that has these features (Abdelkarim & Al-Arifi, Citation2021; Azizi et al., Citation2010; Van der Meer et al., Citation2014); therefore, Sentinel-2 image band ratio was finally used to prepare ferrous and ferric iron mineral distribution maps.
Another image classification method used in this study to detect alterations associated with mineralization is the spectral angle mapping (SAM) method. Generally, the SAM image classification method measures the similarity between the image spectrum and a reference spectrum from a spectral library by measuring the angle between them. In this study, the USGS standard spectral library was used, which has been successfully used by various researchers (Bojinski et al., Citation2003; Mazhari et al., Citation2017; McCubbin et al., Citation1998; Swayze et al., Citation2000).
In the final step, fractures were detected by remote sensing methods at a regional scale (documented by field observation) to calculate surface fracture intensity to understand their relation to mineral distribution. For this purpose, ETM+ images from Landsat 7, and Bing map satellite images from SAS Planet were used. The most commonly used lineament extraction techniques include manual and automatic methods (Ibrahim and Mutua, Citation2014; Hashim et al., 2013; Gannouni and Gabtni, 2015; Han et al., Citation2018; Skakni et al., Citation2022; Moradpour et al., Citation2022). In this study, fractures were directly tracked by applying different filters to the ETM+ image (LOG, Lee, Convolutions and Morphology–High pass), and then the visual analysis process was performed to reveal the fractures that can be observed on the image (Takorabt et al., Citation2018).
Indeed, four main sampling strategies for collecting fracture data are widely used and reported in the literature: the linear scanline method (Priest and Hudson, Citation1981; Priest, 1993), areal sampling (Wu and Pollard, 1995), rectangular window sampling (Pahl, Citation1981Citation1981; Priest, 1993) and the circular scanline method (Mauldon et al., Citation2001). The linear scanline method tends to be favored as it is a fast method for recording a wide range of fracture attributes by laying a tap on an outcrop. Rectangular window sampling utilizes a rectangle, which is placed on an outcrop, and selected fracture attributes are measured within the area of the rectangle (Priest, 1993). Areal sampling involves fracture attribute data collection in 2D and is especially effective when mapping large-scale fractures or discontinuities. Sampling can be completed remotely through the analysis of aerial photographs (Wu and Pollard,1995). A fourth fracture sampling strategy is the circular scanline method, outlined by Mauldon (1998), Mauldon et al. (Citation2001), and Rohrbaugh et al. (2002). Rather than directly measuring fracture attributes, the method involves counting the number of fracture intersections with the edge of a circular line placed on an outcrop, and the number of fracture terminations within the circle. Finally, the augmented circular scanline method, along with areal sampling, was used to collect a range of fractures on satellite images. This augmented circular scanline method is representative of fracture network attributes and involves data collection of a wider range and scale of fracture than other sampling techniques alone (Watkins et al., 2015).
Consequently, the obtained fracture data were used as inputs into a formula for the circular scan line method of fracture analysis (Watkins et al., 2015) to generate the fracture intensity map using Arc GIS software. The augmented circular scaling method involves considering a spacing grid square system with a dimension of (100 m × 100 m) on the fracture trace map of the study area, measurements of the (I) using equation (1), and finally, preparation of the fracture iso intensity map.
I = n/4 r (Mauldon et al., Citation2001)
I = estimated fracture intensity (m/m2), r = circle radius (m), and r = number of fracture intersections with the sampling circle.
Results
Band ratio
The results of the satellite image processing technique by band ratio and SAM were used to map the areas of ferric iron, ferrous iron, and clay mineral, which can indirectly indicate the possible zones of deep sulfide ore mineralization. In these maps, areas with the presence of ferrous iron were marked in blue color, ferric iron distribution in pink color, and clay mineral regions in purple color (). Ferrous irons are distributed in lower density in the southern limb of the Surmeh, Kalagh anticlines, and central part of the Dadenjan anticline and the Jahani, Firoozabad, and Dadenjan salt diapirs (). The lower distribution of ferrous iron than ferric iron, which can be due to the consumption of ferric iron in sulfide minerals oxidation is remarkable. Therefore, areas with the presence of ferrous iron and clay minerals (as the products of oxidation) without the presence of ferric irons are presented in a separate map as a representation of the sulfide ore in deeper parts (). According to , ferrous irons, and clay minerals, are distributed over a wide range including the Surmeh anticline, southern limb of the Kalagh anticline, and central part of the Dadenjan anticlines.
Figure 6. Distribution map of ferric iron and ferrous iron obtained from band ratios, Sentinel-2 image. The area with ferrous iron is marked in blue colors and the areas with ferric iron are marked in pink color.
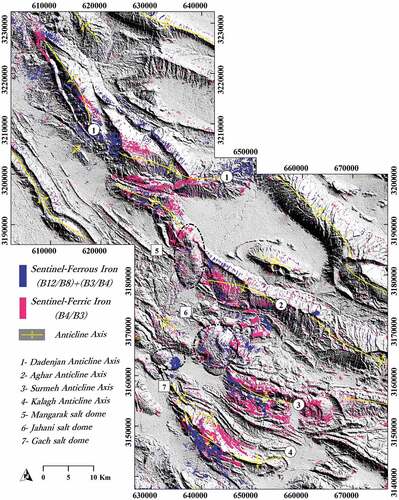
Figure 7. Distribution map of ferric iron and ferrous iron obtained from ASTER band ratios. The areas with ferrous iron are marked in blue colors and the areas with ferric iron are marked in pink color.
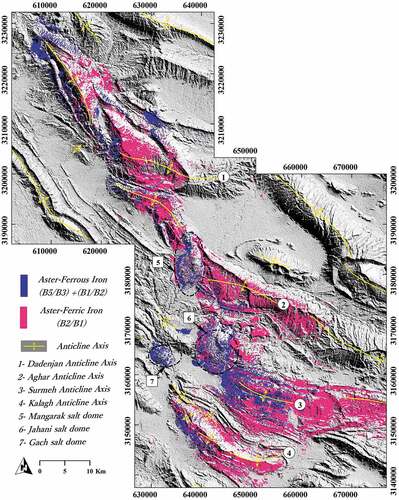
Figure 8. Distribution map of ferrous iron obtained from band ratios, Sentinel-2 image and AL/Fe-OH minerals obtained from band ratios, ASTER image. The area with ferrous iron is marked in blue color and the areas with AL/Fe-OH minerals are marked in purple color.
SAM
Another map that was prepared to determine the possibility of sulfide mineralization in deeper parts, was the map of Hematite, Goethite, and Gypsum distribution. According to this map, high concentrations of the Hematite, Goethite, and Gypsum minerals were found in the southern part of the Kalagh, the NW part of the Surmeh, and the central part of the Dadenjan anticlines. Similarly, some concentrations of these minerals were observed near the Jahani, Firoozabad, and Dadenjan salt diapirs ().
Figure 9. Distribution map of Hematite, Goethite, and Gypsum minerals obtained from band ratios, Landsat-8 OLI image. The area with Hematite is marked in red color, the area with Goethite is marked in dark blue color, and the areas with Gypsum are marked in orange color.
Lineament extraction
Based on the field studies and remote sensing analysis, the main tectonic structures in the study area include folds, fractures, and salt domes. The geometry of these structures and their relations to each other were determined based on the prepared structural cross-sections ().
Figure 10. The NE-SW trending geological cross-section passing through Surmeh and Kalagh anticlines b) the NE-SW trending geological cross-section passing through Dadenjan anticline and salt diaper (see figure. 1 for cross-section locations).
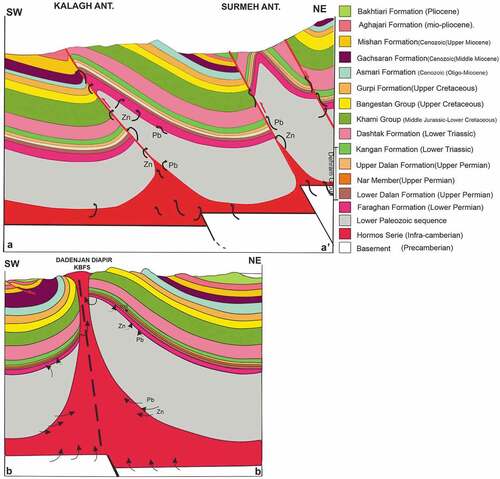
The cross-section A–A′ () is extended through the Surmeh and Kalagh anticlines with the strike of NNE-SSW. The rock bedding in the southern limb of the Kalagh anticline overturned to the NE due to the influence of the Kalagh reverse fault. Also, the large slip that occurred along these faults (~570 m slip according to Mouthereau et al., Citation2006) has caused the exposure of the Paleozoic sedimentary sequence at the surface, particularly along the basement-involved thrusting on the Surmeh Fault, which is demonstrated in the central part of the cross.
The NE-SW trending cross-section B–B′ () is passed through the Dadenjan salt diapir. This diapir was active Late Jurassic, long before the Zagros folding event (Hassanpour et al., Citation2018). The central part of the section is characterized by structural complexities related to the Karebas tear Fault System and salt diaper.
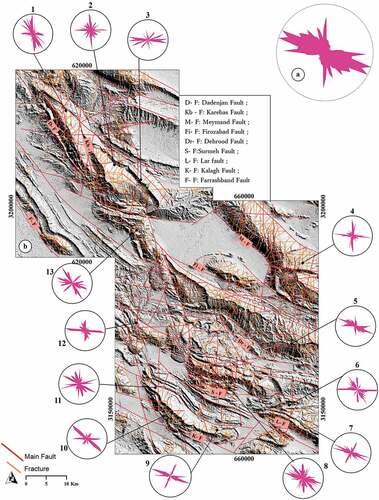
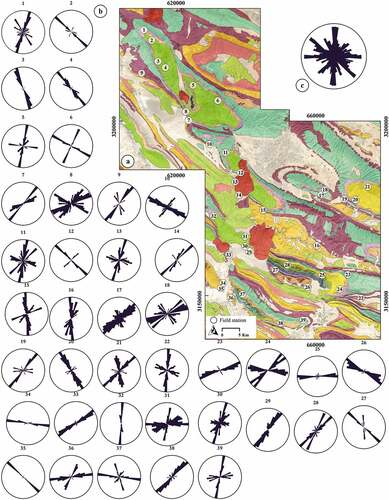
According to the field surveying and fracture rose diagrams obtained from remote-sensing techniques, three sets of fractures with the WNW-ESE, N-S, and NW-SE trends have been extended in the area (). The WNW-ESE and NW-SE trending fractures have been extended parallel to the fold axis and sub-branches of the karebas fault (e.g. Surmeh and Kalagh reverse faults). Since the number of N-S trending fractures has increased toward the Karebas tear fault (from rose diagram 3 to 1 in the dadanjan anticline and rose diagrams 9, 10, and 11 in ), it can be concluded that these have been developed during the development of the Karebas tear fault.
Figure 11. The fracture trace map was obtained from remote sensing data analysis, and also the rose diagrams, with three dominant sets of fractures striking N-S, NW-SE, and WNW-ESE directions.
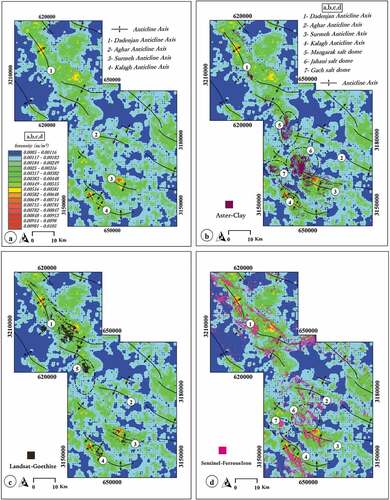
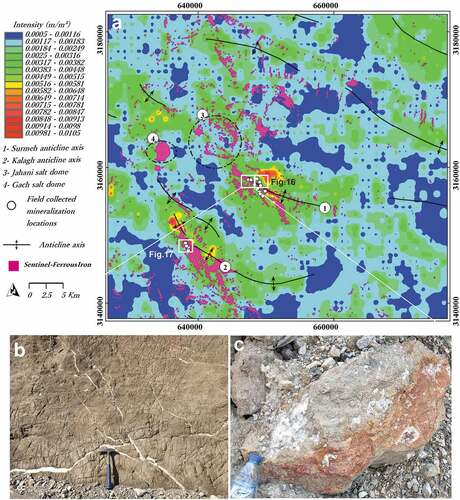
Based on the prepared fracture intensity map (), most of the fracture intensity is concentrated in the intersection of NW-SE and NNW-SSE fault systems, and also parallel to the folding axis.
Figure 12. The fracture intensity map of the study area was obtained by applying the augmented circular scaling method (Mauldon et al., Citation2001) on the fracture trace map, b) Mineral prospective map was obtained by combining b) fracture intensity and clay distribution maps, c) fracture intensity and Goethite distribution maps d) fracture intensity and ferrous iron distribution maps.
Mineral potential maps of the study area
The Hematite, Goethite, and Gypsum distribution map of Landsat-8, the ferrous iron distribution map of Sentinel-2 and the Al-FeoH distribution map of ASTER were selected to be integrated and plotted on the fracture intensity map as the base map on GIS software for generating mineral prospective map at a regional scale.
According to the resulting map () areas with higher potential are located in the southern limbs of the Surmeh and Kalagh anticlines close to the intersection of the main Karebas fault system with its sub-branches (e.g. Surmeh and Kalagh reverse faults). Most of the extraction sites in the Surmeh mine are located in these areas. Also, the lower potential is visible at the central part of the Dadenjan anticline, where the Dadenjan diapir has been exposed to the earth, due to the impact of Karebas main fault ().
Discussion
Based on isotopic, fluid inclusion, and geochemical analyses of barite, galena, and sphalerite carried out by Fazli et al. (Citation2018, Citation2019) the Kuh-e-Surmeh deposit is one of the MVT type deposits, and three main processes involved in its formation: a) compressional stresses of Zagros orogeny by providing Pb-Zn rich hydrothermal fluids, b) bacterial sulfate reduction (BSR) of Nar Member (Upper Permian) and providing required H2S for Zn-Pb mineralization c) Deposition of ore in upper Permian host rock (Carbonates of the lower Dalan Formation) (Fazli et al., Citation2018, Citation2019). Accordingly, the Dalan Formation as the reservoir, the Nar member of the Dehram group as the seal, the Lower Paleozoic Formations as sources of metal ions, and the NW-SE–trending major faults related to the Late Cenozoic orogeny were all crucial for the genesis of the MVT ore in the Study area ().
This study has tried to investigate the occurrence probability of Pb-Zn mineralization in the other parts of the ZFTB that may have similar conditions to the Kuh-e-Surmeh deposit through remote sensing techniques. In this regard, after detecting the areas with mineralization-related alterations as well as the area with more fracture intensity and confirming the results with field surveys, the relationship between fractures and mineralization was determined.
The use of remote sensing techniques to identify alterations associated with Pb-Zn mineralization has been successfully performed in Iran (Beiranvand Pour et al., Citation2018; Mazhari et al., Citation2017; Sekandari, Masoumi, Pour, Muslim, et al., Citation2020) and worldwide (Bojinski et al., Citation2003; Swayze et al., Citation2000; Yang et al., Citation2018). This study has used various spectral data sources, including Landsat 8, Sentinel 2, ASTER, and different image processing methods, including band ratio and SAM, to detect surface alteration minerals associated with Pb-Zn in the study area.
The Al/Fe-OH minerals (e.g. Kaolinite, Muscovite, and Jarosite … .) distribution as the oxidized versions of Pb-Zn deposits were mapped using (B5+B7/B6) band ratios of ASTER images. Also, (B12/B8)+(B3/B4) and (B4/B3) band ratios of Sentinel-2 images were used to map ferrous and ferric iron mineral distributions, respectively. The Landsat 8 images were used to map Hematite, Goethite, and Gypsum minerals through the SAM method.
In general, areas with an increase in ferrous iron and a reduction of ferric iron are genetically related to Pb-Zn mineralization (G. Chen et al., Citation2016; Lammoglia et al. 2008; Ducart et al., Citation2006). Accordingly, due to the expansion of non-sulfide ore, the Northern limb of the Surmeh and the Southern limb of the Kalagh anticlines have the same conditions as these areas (). As it is clear from these maps, most of the alteration areas are developed with a linear trend along the NW-SE direction (). Furthermore, the location of the altered areas on the ground surface was plotted on these maps (). As shown in , the mineral containing altered zone mainly expanded in the NW-SE direction, parallel to the folding axes and partially in the N-S directions.
Figure 13. The mineralization potential map with the locations of the surface alterations related to the Pb-Zn deposits (obtained from the field survey) that confirm the results of study (a). Photograph of barite veins (b) and Zinc carbonate sample (c) in Lower Dalan Formation at Kuh-e-Surmeh ore deposit.
The fracture rose diagrams obtained from the extracted lineament by remote sensing techniques (fractures with ≥3000 m long) show that most fractures have NW-SE and N-S strikes (). The NW-SE trending fracture sets seem to be controlled by the NW-SE basement reverse faults (i.e. sub-branches of the Karebas fault) that are located at the southern limbs of the Surmeh, Kalagh, and Dadenjan anticlines. Whereas the N-S trending fracture sets are probably related to the N-S trending main Karebas fault ().
Figure 14. The fracture rose diagrams were obtained from field surveys showing three dominant sets of fractures striking N-S, NW-SE, and WNW-ESE directions.
Previous scholars (Berberian, Citation1995; J. A. Jackson, Citation1980; Talebian & Jackson, Citation2004) based on earthquakes focal mechanisms demonstrated that these faults are active high-angle reverse faults in the basement which resulted from the reactivation (~16–11 Ma) of earlier normal faults inherited from Tethyan rifting. These major thrust faults are sub-branches of the Karebass fault (KrF), a major right-lateral transverse fault rooted into the basement.
Fracture analysis based on field surveys demonstrated that Orebodies mainly occur in the NW-SE trending fracture zones () and are crosscut by NE-SW- to NNE-SSW-trending faults (). Also, comparing fracture intensity and mineral alteration maps, it is evident that the emplacement of vein material took place at the intersection of NW-SE trending thrusts with sets of N-S trending fractures at the Surmeh, Kalagh, and Dadenjan anticlines.
Figure 15. Field photographs of the ore zone controlled by the NW-SE fault zone in the Lower Dalan Formation at the study area.
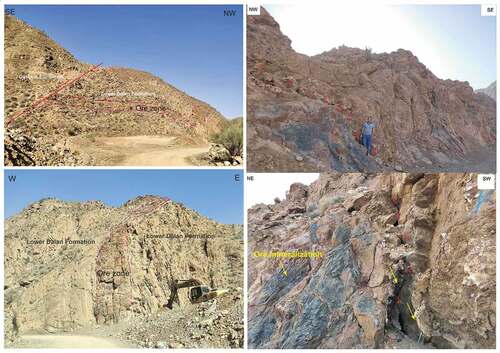
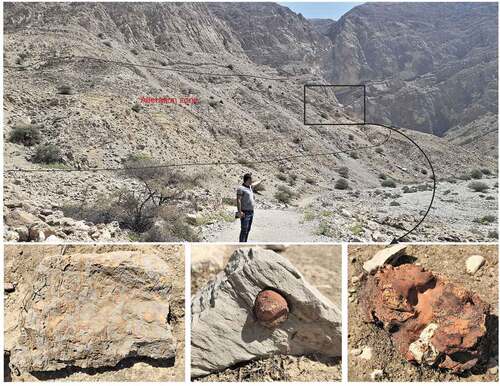
Figure 16. Field photographs of the alteration zones associated with Pb-Zn mineralization in the study area. a,b) NE-SW Fault zone marked by red color arrows, the Longitudinal Valley is one of the major NW-SE trending Faults that was operated in the anticline axis domain c) view of fault breccia and PbCO3 ore mineralization associated with the fault in the Lower Dalan Formation. See for the location.
Since the mineralization mainly occurred along with the NW-SE-trending fractures () and shifted by the NNW-SSE-trending strike-slip and normal faults, previous scholars suggested that the NW-SE trending fault and fractures have acted as the main corridors to transport mineralizing fluids. Whereas in this study, field evidence indicated the presence of fault breccia on the surface of some of the NNW-SSE-trending faults, which were cemented with lead carbonate (PbCo3) (). This feature probably represents solution breccias that are important host for ore (Sangster 1990). Therefore, it can be concluded that these faults exist before or synchronous to the mineralization and subsequent cementation of the broken fragments have occurred employing mineralizing fluids.
Based on the structural map () and the prepared fracture intensity map of the study area (), fracture intensity has increased toward the intersections of the NW-SE trending reverse faults with the N-S trending strike-slip faults.
Based on the prepared conceptual model using actual cross-sections () and other documentation (e.g. remote sensing analysis and field data), the folding process during the Zagros orogeny (~14–15 Ma) has led to the compaction of basin sediments and outflow of basin brines. Compaction-driven flow has found a way to the shallower depth through regional and local faults (e.g. the NW-SE and N-S trending basement faults) same as the case proposed by Beales and Jackson (Citation1966 and S. A. Jackson and F. W. Beales (Citation1967) in the Pine Point deposit of the Northwest Territories.
When transported metal-bearing brines and the sulfur-rich fluids, originating from the Nar evaporitic member of the Dehram group, were mixed, the minerals were precipitated in the Lower Dalan Formation (Fazli et al., Citation2018, Citation2019). Also, the reactivated faults and fault-fold-related fractures that acted as conduits for metal-rich brine fluids were the second hosts to the mineralization. Due to the reactivation of the Surmeh basement fault, a part of the Lower Dalan Formation has been exposed and oxidized in the Surmeh anticline core. Similarly, the Kalagh Thrust, like other branches of the Karebas fault splays, caused exposure of the Dashtak formation and parts of the Dehram Group in the core of the Kalagh anticline.
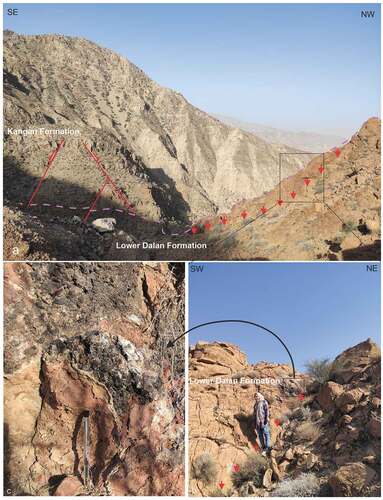
According to the mineralization prospect maps resulting in this study, the central parts of the Dadenjan anticline close to the Karebas fault system, and the southern limb of the Kalagh anticline in the vicinity of the Kalagh thrust probably have the same mineral alteration condition, same as the Surmeh deposits. shows evidence of mineralization-related alteration on the southern flank of the Kuh-e-Kalagh anticline. These areas are introduced, for the first time, as potential points for further exploration by this study.
Figure 17. Field photographs of the alteration zones associated with Pb-Zn mineralization in the Kalagh anticline. See for the location.
This study demonstrated that an integrated workflow of remote sensing techniques using ASTER, Landsat 8, and Sentinel satellite imagery combined with field studies is a useful and time- and cost-efficient technique for prospecting and mapping mineral deposits. Also, these methods can be used in very large or inaccessible areas which have extremely rugged topography.
Conclusion
This study reveals the importance of different structures, including salt diapirism, folding, and major faults in ore genesis in the Fars structural zone from the ZFTB. The Zagros orogeny also played a crucial role in ore formation since the reactivation of the Karebas strike-slip fault and its NW-SE trending splay faults. These faults (e.g. Surmeh and Kalagh reverse fault), by connecting the pre-Cambrian basement to Permian carbonate reservoirs (Dalan Formation), formed the pathways for ore-forming fluids released by Zagros orogenic compressive forces and, finally, caused the deposition of minerals close to the intersection between NW-SE trending faults and the main N-S trending Karebas fault.
According to the results of this study, fracture intensity is a crucial key in the exploration of ore deposits, e.g. the Surmeh ore deposits where most of the non-sulfide minerals, which were detected by remote sensing, are located in the areas with higher fracture intensity.
Finally, the higher concentration of non-sulfide minerals and higher fracture density in the northern limbs of the Surmeh, and southern limbs of the Kalagh, and Dadanjan anticlines, make these parts potential targets for ore exploration in the future.
Acknowledgment
The authors thank the research deputy of the University of Isfahan for their support. Also, the comments by three anonymous reviewers were constructive and improved the study a lot.
Disclosure statement
No potential conflict of interest was reported by the author(s).
References
- Abdelkarim, M., & Al-Arifi, N. (2021). Synergy of remote sensing data for exploring hydrothermal mineral resources using gis-based fuzzy logic approach. Synergy of Remote Sensing and Deep Learning for Mineral Resources and Environment Special Issue, 13(22), 4492. https://doi.org/10.3390/rs13224492
- Ahmadirouhani, R., Karimpour, M. H., Rahimi, B., Malekzadeh-Shafaroudi, A., Pour, A. B., & Pradhan, B. (2018). Integration of SPOT-5 and ASTER satellite data for structural tracing and hydrothermal alteration mineral mapping: Implications for Cu–Au prospecting. International Journal of Image and Data Fusion, 9(3), 237–23. https://doi.org/10.1080/19479832.2018.1469548
- Ahmadi, H., & Uygucgil, H. (2021). Targeting iron prospective within the Kabul Block (SE Afghanistan) via hydrothermal alteration mapping using remote sensing techniques. Arabian Journal of Geosciences, 14(3), 183. https://doi.org/10.1007/s12517-020-06430-3
- Alavi, M. (2004). Regional stratigraphy of the Zagros fold-thrust belt of Iran and its proforeland evolution. American Journal of Science, 304(1), 1–20. https://doi.org/10.2475/ajs.304.1.1
- Austin J and Blenkinsop T. (2009). Local to regional scale structural controls on mineralisation and the importance of a major lineament in the eastern Mount Isa Inlier, Australia: Review and analysis with autocorrelation and weights of evidence. Ore Geology Reviews, 35(3–4), 298–316. https://doi.org/10.1016/j.oregeorev.2009.03.004
- Azizi, H., Tarverdi, M. A., & Akbarpour, A. (2010). Extraction of hydrothermal alterations from ASTER SWIR data from east Zanjan, northern Iran. Advances in Space Research, 46(1), 99–109. https://doi.org/10.1016/j.asr.2010.03.014
- Beales, F. W., & Jackson, S. A. (1966). Precipitation of lead-zinc ores in carbonate reservoirs as illustrated by Pine Point ore field. In Inst. Mining and Metallurgy (pp. B278–285). Transactions/Section B
- Beiranvand Pour, A., Park, T. Y. S., Park, Y., Hong, J. K., Zoheir, B., Pradhan, B., Ayoobi, I., & Hashim, M. (2018). Application of multi-sensor satellite data for exploration of Zn–Pb sulfide mineralization in the Franklinian Basin, North Greenland. Remote Sensing, 10(8), 1186. https://doi.org/10.3390/rs10081186
- Berberian, M. (1995). Master “blind” thrust faults hidden under the Zagros folds: Active basement tectonics and surface morphotectonics. Tectonophysics, 241(3–4), 193–224. https://doi.org/10.1016/0040-1951(94)00185-C
- Bojinski, S., Schaepman, M., Schläpfer, D., & Itten, K. (2003). SPECCHIO: A spectrum database for remote sensing applications. Computers & Geosciences, 29(1), 27–38. https://doi.org/10.1016/S0098-3004(02)00107-3
- Bolouki, S. M., Ramazi, H. R., Maghsoudi, A., Pour, A. B., & Sohrabi, G. (2020). A Remote Sensing-Based Application of Bayesian Networks for Epithermal Gold Potential Mapping in Ahar-Arasbaran Area, NW Iran. Remote Sensing, 12(1), 105. https://doi.org/10.3390/rs12010105
- Casini, G., Gillespie, P. A., Vergés, J., Romaire, I., Fernández, N., Casciello, E. Saura, E., Mehl, S., Homke, S., Embry, J.C., Aghajari, L., & Hunt, D.W. (2011). Sub-seismic fractures in foreland fold and thrust belts: Insight from the Lurestan Province.Geological Society of London, 17(3),263–282.
- Chander, G., Markham, B. L., & Barsi, J. A. (2007). Revised Landsat-5 thematic mapper radiometric calibration. IEEE Geoscience and Remote Sensing Letters, 4(3), 490–494. https://doi.org/10.1109/LGRS.2007.898285
- Chandler, R. J., De Freitas, M. H., & Marinos, P. (2004). Geotechnical characterization of soils and rocks: A geological perspective. In Advances in geotechnical engineering: The Skempton conference: Proceedings of a three-day conference on advances in geotechnical engineering, organized by the Institution of Civil Engineers and held at the Royal Geographical Society, London, UK, on 29–31 March 2004 (pp. 67–102). Thomas Telford Publishing.
- Chen, G., Shu, L., Shu, L., Zhang, C., & Ouyang, Y. (2016). Geological characteristics and mineralization setting of the Zhuxi tungsten (copper) polymetallic deposit in the EASTERn Jiangnan Orogen. Science China Earth Sciences, 59(4), 803–823. https://doi.org/10.1007/s11430-015-5200-9
- Ducart, D. F., Crósta, A. P., Filho, C. R. S., & Coniglio, J. (2006). Alteration mineralogy at the Cerro La Mina epithermal prospect, Patagonia, Argentina: Field mapping, short-wave infrared spectroscopy, and ASTER images. Economic Geology, 101(5), 981–996. https://doi.org/10.2113/gsecongeo.101.5.981
- El-Wahed, M. A., Zoheir, B., Pour, A. B., & Kamh, S. (2021). Shear-Related Gold Ores in the Wadi Hodein Shear Belt, South Eastern Desert of Egypt: Analysis of Remote Sensing, Field and Structural Data. Minerals, 11(5), 474. https://doi.org/10.3390/min11050474
- Fatima, K., Khattak, M. O. K., Kausar, A. B., Toqeer, M., Haider, N., & Rehman, A. U. (2017). Minerals identification and mapping using ASTER satellite image. Journal of Applied Remote Sensing, 11(4), 046006. https://doi.org/10.1117/1.JRS.11.046006
- Fazli, S., Taghipour, B., & Lentz, D. R. (2018). The Zn-Pb sulfide and Pb-Zn-Ag non-sulfide Kuh-e-Surmeh ore deposit, Zagros Belt, Iran: Geologic, mineralogical, geochemical, and S isotopic constraints. Journal of Geochemical Exploration, 194, 146–166. https://doi.org/10.1016/j.gexplo.2018.07.019
- Fazli, S., Taghipour, B., Moore, F., & Lentz, D. R. (2019). Fluid inclusions, S isotopes, and Pb isotopes characteristics of the Kuh-e-Surmeh carbonate-hosted Zn–Pb deposit in the Zagros Fold Belt, southwest Iran: Implications for the source of metals and sulfur and MVT genetic model. Ore Geology Reviews, 109, 615–629. https://doi.org/10.1016/j.oregeorev.2019.04.006
- Ghasemi, A., & Talbot, C. J. (2006). A new tectonic scenario for the Sanandaj–Sirjan Zone (Iran). Journal of Asian Earth Sciences, 26(6), 683–693. https://doi.org/10.1016/j.jseaes.2005.01.003
- Ghorbani, M. (2021). Structural Units of Iran. The Geology of Iran: Tectonic, Magmatism, and Metamorphism (pp. 23–80). Springer. https://link.springer.com/book/10.1007/978-3-030-71109-2
- Gopinathan, P., Parthiban, S., Magendran, T., Fadhil Al-Quraishi, A. M., Singh, A. K., & Pradeep, K. S. (2020). Mapping of ferric (Fe+3) and ferrous (Fe+2) iron oxides distribution using band ratio techniques with ASTER data and geochemistry of Kanjamalai and Godumalai, Tamil Nadu, south India. Remote Sensing Applications: Society and Environment, 18, 100306. https://doi.org/10.1016/j.rsase.2020.100306
- Guha, A., Kumar, K. V., Rao, E. N. D., & Parveen, R. (2014). An image processing approach for converging ASTER-derived spectral maps for mapping Kolhan limestone, Jharkhand, India. Current Science, 106(1), 40–49.
- Guo, Y., & Zeng, F. (2012). Atmospheric correction comparison of spot-5 image based on model flash and model quac, international archives of the photogrammetry, remote sensing and spatial information sciences. The International Archives of the Photogrammetry, Remote Sensing and Spatial Information Sciences, XXXIX-B7, 7–11. https://doi.org/10.5194/isprsarchives-XXXIX-B7-7-2012
- Hadigheh, S. M. H., & Ranjbar, H. (2013). Lithological mapping in the eAstern part of the central Iranian volcanic belt using combined ASTER and IRS data. Journal of the Indian Society of Remote Sensing, 41(4), 921–931. https://doi.org/10.1007/s12524-013-0284-1
- Han L, Liu Z, Ning Y and Zhao Z. (2018). Extraction and analysis of geological lineaments combining a DEM and remote sensing images from the northern Baoji loess area. Advances in Space Research, 62(9), 2480–2493. https://doi.org/10.1016/j.asr.2018.07.030
- Hassanpour, J., Jahani, S., Ghassemi, M. R., Alavi, S. A., & Zeinali, F. (2018). Evolution of the Karebas Fault System and adjacent folds, central Zagros fold-and-thrust belt, Iran: Role of pre-existing halokinesis (salt structures and mini basins) and detachment levels. Journal of Asian Earth Sciences, 164, 125–142. https://doi.org/10.1016/j.jseaes.2018.06.024
- Hassanpour, J., Muñoz, J. A., Yassaghi, A., Ferrer, O., Jahani, S., Santolaria, P., & Seyed Ali, S. M. (2021). Impact of salt layers interaction on the salt flow kinematics and diapirism in the EASTERn Persian Gulf, Iran: Constraints from seismic interpretation, sequential restoration, and physical modeling. Tectonophysics, 811, 228887. https://doi.org/10.1016/j.tecto.2021.228887
- Homke, S., Vergés, J., Serra-Kiel, J., Bernaola, G., Sharp, I., Garcés, M., Montero-Verdú, I., Karpuz, R., & Goodarzi, M. H. (2009). Late Cretaceous–Paleocene formation of the proto–Zagros foreland basin, Lurestan Province, SW Iran. Geological Society of America Bulletin, 121(7–8), 963–978. https://doi.org/10.1130/B26035.1
- Honarmand, M., Ranjbar, H., & Shahabpour, J. (2012). Application of principal component analysis and spectral angle mapper in the mapping of hydrothermal alteration in the Jebal–Barez Area, SoutheAstern Iran. Resource Geology, 62(2), 119–139. https://doi.org/10.1111/j.1751-3928.2012.00184.x
- Hosseinpour, M., Maleki, Z., & Aleali, M. (2017). Evaluation of Hydrocarbon Potential in the Jahrom Area, Interior Fars, Zagros. Open Journal of Geology, 7, 3. https://doi.org/10.4236/ojg.2017.73029
- Hunt, G. R., & Ashley, P. (1979). Spectra of Altered Rocks in the Visible and Near Infrared. Economic Geology, 74, 1613–1629. https://doi.org/10.2113/gsecongeo.74.7.1613
- Ibrahim, Umikaltuma, Mutua, Felix 2014 Lineament Extraction using Landsat 8 (OLI) in Gedo, Somalia International Journal of Science and Research English, 3(9), 291–296. 2319-7064.
- Jackson, J. A. (1980). Reactivation of basement faults and crustal shortening in orogenic belts. Nature, 283(5745), 343–346. https://doi.org/10.1038/283343a0
- Jackson, S. A., & Beales, F. W. (1967). An aspect of sedimentary basin evolution: The concentration of Mississippi Valley-type ores during late stages of diagenesis. Bulletin of Canadian Petroleum Geology, 15(4), 383–433. https://doi.org/10.35767/gscpgbull.15.4.383.
- Jahani, S., Hassanpour, J., Mohammadi-Firouz, S., Letouzey, J., de Lamotte, D. F., Alavi, S. A., & Soleimany, B. (2017). Salt tectonics and tear faulting in the central part of the Zagros Fold-Thrust Belt, Iran. Marine and Petroleum Geology, 86, 426–446. https://doi.org/10.1016/j.marpetgeo.2017.06.003
- Lacombe, O., Mouthereau, F., Kargar, S., & Meyer, B. (2006). Late Cenozoic and modern stress fields in the western Fars (Iran): Implications for the tectonic and kinematic evolution of central Zagros. Tectonics, 25(1). https://doi.org/10.1029/2005TC001831
- Leach D L, Song Y and Hou Z. (2017). The world-class Jinding Zn–Pb deposit: ore formation in an evaporite dome, Lanping Basin, Yunnan, China. Miner Deposita, 52(3), 281–296. https://doi.org/10.1007/s00126-016-0668-6
- Liaghat, S., Moore, F., & Jami, M. (2000). The Kuh-e-Surmeh mineralization, a carbonate-hosted Zn-Pb deposit in the Simply Folded Belt of the Zagros Mountains, SW Iran. Mineralium Deposita, 35, 72–78. https://doi.org/10.1007/s001260050007
- Liu, S., Zhang, Y., Zhao, L., Chen, X., Zhou, R., Zheng, F., Li, Z., Li, J., Yang, H., Li, H., Yang, J., Gao, H., & Gu, X. (2022). Quantitative and Automatic Atmospheric Correction (QUAAC): Application and Validation. Sensors, 22(9), 3280. https://doi.org/10.3390/s22093280
- Maghfouri, S., Hosseinzadeh, M. R., Rajabi, A., & Choulet, F. (2018). A review of major non-sulfide zinc deposits in Iran. Geoscience Frontiers, 9(1), 249–272. https://doi.org/10.1016/j.gsf.2017.04.003
- Mars, J. C., & Rowan, L. C. (2006). Regional mapping of phyllic-and argillic-altered rocks in the Zagros magmatic arc, Iran, using Advanced Spaceborne Thermal Emission and Reflection Radiometer (ASTER) data and logical operator algorithms. Geosphere, 2(3), 161–186. https://doi.org/10.1130/GES00044.1
- Mauldon M, Dunne W and Rohrbaugh M. (2001). Circular scanlines and circular windows: new tools for characterizing the geometry of fracture traces. Journal of Structural Geology, 23(2–3), 247–258. https://doi.org/10.1016/S0191-8141(00)00094-8
- Mazhari, N., Shafaroudi, A. M., & Ghaderi, M. Detecting and mapping different types of iron mineralization in the Sangan mining region, NE Iran, using satellite images and airborne geophysical data. (2017). Geosciences Journal, 21(1), 137–148. Corpus ID: 102341773. https://doi.org/10.1007/s12303-016-0018-9
- McCubbin, I., Green, R., Lang, H., & Roberts, D. (1998). Mineral mapping using partial unmixing at Ray. JPL Technical Report Server, California Institute of Technology. http://hdl.handle.net/2014/19333
- Meshkani S Ahmad, Mehrabi B, Yaghubpur A and Sadeghi M. (2013). Recognition of the regional lineaments of Iran: Using geospatial data and their implications for exploration of metallic ore deposits. Ore Geology Reviews, 55, 48–63. https://doi.org/10.1016/j.oregeorev.2013.04.007
- Moghtaderi, A., Moore, F., & Ranjbar, H. (2017). Application of ASTER and Landsat 8 imagery data and mathematical evaluation method in detecting iron minerals contamination in the Chadormalu iron mine area, central Iran. Journal of Applied Remote Sensing, 11(1), 016027. https://doi.org/10.1117/1.JRS.11.016027
- Molchanova, T. K., & Ruban, D. A. (2019). New Evidence of the Bangestan Geoheritage Resource in Iran: Beyond Hydrocarbon Reserves. Resources, 8(1), 35. https://doi.org/10.3390/resources8010035
- Moradpour H, Rostami Paydar G, Pour A Beiranvand, Valizadeh Kamran K, Feizizadeh B, Muslim A M and Hossain M Shawkat. (2022). Landsat-7 and ASTER remote sensing satellite imagery for identification of iron skarn mineralization in metamorphic regions. Geocarto International, 37(7), 1971–1998. https://doi.org/10.1080/10106049.2020.1810327
- Moragas, M., Baqués, V., Travé, A., Martín‐martín, J. D., Saura, E., Messager, G., Hunt, D., & Vergés, J. (2020). Diagenetic evolution of lower Jurassic platform carbonates flanking the Tazoult salt wall (Central High Atlas, Morocco). Basin Research, 32(3), 546–566. https://doi.org/10.1111/bre.12382
- Mouthereau, F., Lacombe, O., & Meyer, B. (2006). The Zagros folded belt (Fars, Iran): Constraints from topography and critical wedge modelling. Geophysical Journal International, 165(1), 336–356. https://doi.org/10.1111/j.1365-246X.2006.02855.x
- Ortiz-Castillo, J. E., Mirazimi, M., Mohammadi, M., Dy, E., & Liu, W. Y. (2022). The role of microorganisms in the formation, dissolution, and transformation of secondary minerals in mine rock and drainage: A review Minerals. Minerals, 11(12), 1349, 10.3390/min11121349. https://doi.org/10.3390/min11121349
- Oveisi B, Lavé J, van der Beek P, Carcaillet J, Benedetti L and Aubourg C. (2009). Thick- and thin-skinned deformation rates in the central Zagros simple folded zone (Iran) indicated by displacement of geomorphic surfaces. Geophysical Journal International, 176(2), 627–654. https://doi.org/10.1111/j.1365-246X.2008.04002.x
- Pahl P. (1981). Estimating the mean length of discontinuity traces. International Journal of Rock Mechanics and Mining Sciences & Geomechanics Abstracts, 18(3), 221–228. https://doi.org/10.1016/0148-9062(81)90976-1
- Perona, J., Canals, À., & Cardellach, E. (2018). Zn-Pb mineralization associated with salt diapirs in the Basque-Cantabrian Basin, northern Spain: Geology, geochemistry, and genetic model. Economic Geology, 113(5), 1133–1159. https://doi.org/10.5382/econgeo.2018.4584
- Pirajno, F., Burlow, R., & Huston, D. (2010). The Magellan Pb deposit, Western Australia; a new category within the class of supergene non-sulfide mineral systems. Ore Geology Reviews, 37(2), 101–113. https://doi.org/10.1016/j.oregeorev.2010.01.001
- Pour A Beiranvand and Hashim M. (2012). The application of ASTER remote sensing data to porphyry copper and epithermal gold deposits. Ore Geology Reviews, 44, 1–9. https://doi.org/10.1016/j.oregeorev.2011.09.009
- Pour, A. B., Park, Y., Park, T. Y. S., Hong, J. K., Hashim, M., Woo, J., & Ayoobi, I. (2018). Regional geology mapping using satellite-based remote sensing approach in Northern Victoria Land, Antarctica. Polar Science, 16, 23–46. https://doi.org/10.1016/j.polar.2018.02.004
- Pour, A. B., Sekandari, M., Rahmani, O., Crispini, L., Läufer, A., Park, Y., Hong, J. K., Pradhan, B., Hashim, M., Hossain, M. S., Muslim, A. M., & Mehranzamir, K. (2021). Identification of Phyllosilicates in the Antarctic Environment Using ASTER Satellite Data: Case Study from the Mesa Range, Campbell and Priestley Glaciers, Northern Victoria Land. Remote Sensing, 13(1), 38. https://doi.org/10.3390/rs13010038
- Priest S and Hudson J. (1981). Estimation of discontinuity spacing and trace length using scanline surveys. International Journal of Rock Mechanics and Mining Sciences & Geomechanics Abstracts, 18(3), 183–197. https://doi.org/10.1016/0148-9062(81)90973-6
- Rajabi, A., Rastad, E., & Canet, C. (2013). Metallogeny of Permian–Triassic carbonate-hosted Zn–Pb and F deposits of Iran: A review for future mineral exploration. Australian Journal of Earth Sciences, 60(2), 197–216. https://doi.org/10.1080/08120099.2012.754792
- Rajendran, S., & Sobhi Nasir, S. (2013). Mapping of manganese potential areas using ASTER satellite data in parts of Sultanate of Oman. International Journal of Geosciences and Geomatics, Arab Remote Sensing and Geographic Information System Organization, x(xx), 92–101.
- Rasouli Beirami M and Tangestani M H. (2020). A New Band Ratio Approach for Discriminating Calcite and Dolomite by ASTER Imagery in Arid and Semiarid Regions. Nat Resour Res, 29(5), 2949–2965. https://doi.org/10.1007/s11053-020-09648-w
- Reichert, J., & Borg, G. (2008). Numerical simulation and a geochemical model of supergene carbonate-hosted non sulphide zinc deposits Ore. Ore Geology Reviews, 33(2), 134–151. https://doi.org/10.1016/j.oregeorev.2007.02.006
- Reuning, L., Johannes, S., Ansgar, H., Urai, J. L., Littke, R., Kukla, P. A., & Rawahi, Z. (2009). Constraints on the diagenesis, stratigraphy and internal dynamics of the surface-piercing salt domes in the Ghaba Salt Basin (Oman): A comparison to the Ara Group in the South Oman Salt Basin. GeoArabia, 14(3), 83–120. https://doi.org/10.2113/geoarabia140383
- Roozpeykar, A., & Moghaddam, I. M. (2016). Benthic foraminifera as biostratigraphical and - paleoecological indicators: An example from Oligo-Miocene deposits in the SW of Zagros basin, Iran. Geoscience Frontiers, 7(1), 125–140. https://doi.org/10.1016/j.gsf.2015.03.005
- ROSSETTI F, ALDEGA L, TECCE F, BALSAMO F, BILLI A and BRILLI M. (2011). Fluid flow within the damage zone of the Boccheggiano extensional fault (Larderello–Travale geothermal field, central Italy): structures, alteration and implications for hydrothermal mineralization in extensional settings. Geol. Mag., 148(4), 558–579. https://doi.org/10.1017/S001675681000097X
- Rowan, L. C., & Mars, J. C. (2003). Lithologic mapping in the Mountain Pass, California area using advanced spaceborne thermal emission and reflection radiometer (ASTER) data. Remote Sensing of Environment, 84(3), 350–366. https://doi.org/10.1016/S0034-4257(02)00127-X
- Sekandari, M., Masoumi, I., Pour, A. B., Muslim, A. M., Hossain, M. S., & Misra, A. (2020). ASTER and WorldView-3 satellite data for mapping lithology and alteration minerals associated with Pb-Zn mineralization. Geocarto international, 37(6), 1–31. https://doi.org/10.1080/10106049.2020.1790676
- Sheikhrahimi, A., Pour, A. B., Pradhan, B., & Zoheir, B. (2019). Mapping hydrothermal alteration zones and lineaments associated with orogenic gold mineralization using ASTER data: A case study from the Sanandaj-Sirjan Zone, Iran. Advances in Space Research, 63(10), 3315–3332. https://doi.org/10.1016/j.asr.2019.01.035
- Skakni O, Hlila R, Pour A Beiranvand, Martín Martín M, Maate A, Maate S, Muslim A M and Hossain M Shawkat. (2022). Integrating remote sensing, GIS and in-situ data for structural mapping over a part of the NW Rif belt, Morocco. Geocarto International, 37(11), 3265–3292. https://doi.org/10.1080/10106049.2020.1852611
- Swayze, G. A., Smith, K. S., Clark, R. N., Sutley, S. J., Pearson, R. M., Vance, J. S., Hageman, P. L., Briggs, P. H., Meier, A. L., Singleton, M. J., & Roth, S. (2000). Using imaging spectroscopy to map acidic mine waste. Environmental Science & Technology, 34(1), 47–54. https://doi.org/10.1021/es990046w
- Taghipour, B., & Ahmadnejad, F. (2015). Geological and geochemical implications of the genesis of the Qolqoleh orogenic gold mineralisation, Kurdistan Province (Iran). Geologos, 21(1), 31–57. https://doi.org/10.1515/logos-2015-0002
- Takodjou Wambo, J. D., Pour, A. B., Ganno, S., Asimow, P. D., Zoheir, B., Reis Salles, R. D., Nzenti, J. P., Pradhan, B., & Muslim, A. M. (2020). Identifying high potential zones of gold mineralization in a sub-tropical region using Landsat-8 and ASTER remote sensing data: A case study of the Ngoura-Colomines goldfield, eAstern Cameroon. Ore Geology Reviews, 122, 103530. https://doi.org/10.1016/j.oregeorev.2020.103530
- Takorabt M, Toubal A Cherif, Haddoum H and Zerrouk S. (2018). Determining the role of lineaments in underground hydrodynamics using Landsat 7 ETM+ data, case of the Chott El Gharbi Basin (western Algeria). Arab J Geosci, 11(4). https://doi.org/10.1007/s12517-018-3412-y
- Talbot, C. J., & Alavi, M. 1996. The past of a future syntaxis across the Zagros, G.I. Alsop, D.J. Blundell, & I. Davison, Eds. Salt Tectonics, Geological Society, Special Publication, Vol. 100, https://doi.org/10.1144/gsl.sp.1996.100.01.08
- Talebian, M., & Jackson, J. (2004). A reappraisal of earthquake focal mechanisms and active shortening in the Zagros mountains of Iran. Geophysical Journal International, 156(3), 506–526. https://doi.org/10.1111/j.1365-246X.2004.02092.x
- Teillet, P. M., Fedosejevs, G., Gauthier, R. P., O’Neill, N. T., Thome, K. J., Biggar, S. F., Ripley, H., & Meygret, A. (2001). A generalized approach to the vicarious calibration of multiple Earth observation sensors using hyperspectral data. Remote Sensing of Environment, 77(3), 304–327. https://doi.org/10.1016/S0034-4257(01)00211-5
- Tripp G I and Vearncombe J R. (2004). Fault/fracture density and mineralization: a contouring method for targeting in gold exploration. Journal of Structural Geology, 26(6–7), 1108–1087. https://doi.org/10.1016/j.jsg.2003.11.002
- Upadhyay, R. (2012). Mineral abundance mapping using Hyperion dataset in Udaipur, India. in 14th Annual International Conference and Exhibition on Geospatial - Information Technology and Applications, India Geospatial Forum, Gurgaon (pp. 1–8).
- Van der Meer, F. D., Van der Werff, H. M. A., & Van Ruitenbeek, F. J. A. (2014). Potential of ESA’s Sentinel-2 for geological applications. Remote Sensing of Environment, 148, 124–133. https://doi.org/10.1016/J.RSE.2014.03.022
- Yang, C., Chai, F., Yang, F., Santosh, M., Xu, Q., & Wang, W. (2018). Genesis of the Huangtupo Cu–Zn deposit, EASTERn Tianshan, NW China: Constraints from geology, Rb–Sr and Re-Os geochronology, fluid inclusions, and H–O–S–Pb isotopes. Ore Geology Reviews, 101, 725–739. https://doi.org/10.1016/j.oregeorev.2018.08.021
- Zoheir B and Emam A. (2014). Field and ASTER imagery data for the setting of gold mineralization in Western Allaqi–Heiani belt, Egypt: A case study from the Haimur deposit. Journal of African Earth Sciences, 99, 150–164. https://doi.org/10.1016/j.jafrearsci.2013.06.006
- Zoheir B, Steele-MacInnis M and Garbe-Schönberg D. (2019). Orogenic gold formation in an evolving, decompressing hydrothermal system: Genesis of the Samut gold deposit, Eastern Desert, Egypt. Ore Geology Reviews, 105 236–257. https://doi.org/10.1016/j.oregeorev.2018.12.030