
 ?Mathematical formulae have been encoded as MathML and are displayed in this HTML version using MathJax in order to improve their display. Uncheck the box to turn MathJax off. This feature requires Javascript. Click on a formula to zoom.
ABSTRACT
The aims of our study were to molecularly assess some seedy strains of Alamar Apricot Rootstock using SCoT and ISSR techniques. In addition, assessment of the expression of P5CS gene with assay of some stress-related phytochemical parameters under salinity stress. These strains were irrigated with salt solution for 6 months from June 2016, only eight strains continued to grow under salinity stress. ISSR and SCoT techniques revealed polymorphic patterns and confirmed to be valid in discriminating these eight strains. SCoT technique was better than ISSRs in assessment for molecular diversity and discrimination capacity for all studied seedy strains. However, a significant positive correlation was found only between distances based on ISSR data and Euclidian distances based on stress-related phytochemical parameters data. These strains showed higher values than control for the studied parameters, specially A3 being the best strain in all parameters, in addition to showing a significantly increase in P5CS gene expression compared to control. Also, A3 was distinguished by a few ISSR unique markers. This, suggesting that, these markers may be used as markers assisted selection in the improvement of salinity tolerance. In addition, the possibility of utilizing this strain through other studies as a source of salinity tolerance in Alamar apricot rootstock.
Introduction
Apricot tree (Prunus armeniaca L.; 2n = 2x = 16) [Citation1] is one of the most important deciduous fruit of the family Rosaceae grown in Egypt. The production areas are concentrated in north and north-eastern parts of the country, where 20-30% of the land is seriously damaged by salinity [Citation2]. Salinity is a widespread problem around the world, it is one of most abiotic stress factors that effect on plant development, yield, fruit quality and nutritional status [Citation3]. Recently, salinity become a serious agricultural problem, especially in irrigated lands located in semiarid zones. High salt concentrations in the soil drastically reduce the yields of a variety of plants worldwide [Citation4]. Where increases the toxic ions couples with limited uptake of essential minerals resulting in significant reduction in enzymatic activity and disturbance in cell metabolism [Citation5]. Breeding methods effort that aim at production of salt-tolerant varieties have been the most efficient approaches to overcome this problem [Citation6]. One of these methods is to improve proline accumulation in plants under salt stress. Reasonably, proline is an important osmolyte accumulates under environmental stresses. Besides, it is the major compound that has a high ability to protect cells from these stresses via stabilizing the proteins and cellular membranes [Citation7]. Traditional methods for improving fruit tree species are based on phenotypic observations, but this approach is slow and submits to environmental influences. Reason is the long generation time and the large size of the fruit trees. Apricots can be adapted to specific microclimates and display significantly different morphologies when moved from one microclimate to another. For these reasons, it became essential to molecularly screen Apricot varieties for identification of markers that are associated with traits of interest [Citation8]. In addition to evaluate proline accumulation activity and related genes under salinity stress [Citation7].
Molecular markers are premium tools for assessing genetic diversity, which help breeders to select important traits support the improving productivity of economic plants. It was shown that molecular marker data are very important for any breeding program to select promising varieties with traits of interest [Citation9]. Markers such as ISSR and SCoT are used efficiently for genetic diversity assessment of plants [Citation10]. Inter-simple sequence repeats (ISSRs), a class of molecular markers involves the use of microsatellite sequences as primers in a polymerase chain reaction to generate multilocus markers, were first described by Zietkiewicz et al. [Citation11], and Kantety et al. [Citation12]. These markers targets genome regions flanked by the simple sequence repeats (SSR or microsatellite sequences). So, they offer great potential for assessing genetic diversity compared to other arbitrary markers like RAPD, since they reveal variation within unique regions of the genome at several loci simultaneously. They exhibit specificity of sequence-tagged-site markers but need no sequence information for primer synthesis featuring the random markers advantages. ISSR-primers can be based on any of the SSR motifs (di-, tri-, tetra- or penta-nucleotides) found at microsatellite loci, giving a wide array of possible amplification products [Citation11]. Having single primer, ISSR sequences can be amplified using Polymerase Chain Reaction (PCR) provided that within the amplifiable size domain. This reaction yields multiple amplification products (Amplicons) that can be used as a dominant multi-locus marker system for genetic diversity study in various organisms. Start Codon Targeted polymorphism (SCoT) is a new molecular marker technique, and not yet used in the apricot diversity studies except for study on native apricots in Southern Xinjiang of China [Citation13]. It is a novel, simple, and reliable gene-targeted marker technique based on the short-conserved region flanking the ATG start codon (initiation codon) in plant genes. This technique uses single 18-mer primers designed to anneal with surrounding regions of the start codon on both DNA strands [Citation14,Citation15]. This technique was described by Collard and Mackill [Citation16], it uses a single primer as a forward and reverse primer, like the RAPD or ISSR technique. Also, SCoT can generate dominant markers caused by sequence variations and co-dominant markers caused by insertions and deletions [Citation17]. SCoT is superior over other dominant DNA marker systems like RAPD and ISSR in higher polymorphism and better marker resolvability [Citation18].
Proline is a proteogenic amino acid important for plant growth and differentiation across life cycle. It plays beneficial role in plants exposed to various stress conditions. Proline accumulates in the cytosol of plants experiencing water limitation allowing the increase of cellular osmolarity maintaining the osmotic stability during water limitation [Citation19]. Proline not only accumulates during abiotic stress but also in different tissues of plants under non-stress conditions [Citation20]. Proline accumulation is regulated by the balance between synthesis and catabolism. Δ1pyrroline-5-carboxylate synthetase (P5CS) is the rate-limiting key enzyme in the proline mechanism [Citation7]. The P5CS catalyzes the conversion of glutamate into glutamate-1-semialdehyde (GSA) which can spontaneously interconverted into P5C which is then reduced to proline [Citation21]. Shin et al. [Citation22] indicated that the P5CS enzyme is known to been encoded by two genes P5CS1 and P5CS2 in A. thaliana. The former has been shown to increase in the root and shoot in response to abiotic stress, whereas the latter found typically in dividing cells but less noticeably up-regulated by a stress. In woody plants, no report exists as to the number of genes encoding P5CS enzyme. However, in peach P5CS1 was up-regulated in response to stress. The expression of P5CS gene was studied in some species of Rosaceae family, but these studies did not include apricots. For example, Rickes et al. [Citation23] reported a significant P5CS gene expression increase under water deficit in Prunus rootstocks, as well as a positive correlation with proline levels. Transgenic plants overexpressing P5CS showed high proline concentrations that paralleled increased tolerance to drought and salinity stresses [Citation24,Citation25].
In addition, the results obtained by Bolat et al. [Citation26] underlined the important role of some antioxidant enzymes like superoxide dismutase (SOD), catalase (CAT) and ascorbate peroxidase (APX), and compounds in protecting cellular mechanisms during water stress conditions. The increase of SOD, CAT and APX, activity and accumulation increase of non-enzymatic antioxidant reagents such as glutathione, phenolic compounds, flavonoids, and proline could represent a key mechanism for salinity tolerance in plant [Citation27].
This study aims to molecular assessment for some seedy strains of Alamar Apricot Rootstock using two molecular techniques (SCoT and ISSR). In addition to assessment of P5CS gene expression activity and salinity tolerance-related phytochemical parameters. For contribute to the ongoing efforts for improving salinity tolerance in apricot.
Materials and methods
This study was conducted through the two years 2016 and 2017 at the greenhouse in farm of Genetics Department, Faculty of Agriculture, Mansoura University.
Plant materials and salinity treatment
Plant materials of Alamar rootstock were propagated by seeds, so all obtained seedlings representing different genotypes are originated from genetic recombinations.
Fifteen seedlings (aged 1 year) from seedy strains of Alamar apricot rootstock (with similar growth and characteristics) were selected out of many seedlings. These seedlings were obtained from deciduous fruit Department, Horticultural Research Institute, Agricultural Research Centre and transplanted to 20 L pots filled with field soil and washed sand with a ratio of 1:1 under greenhouse conditions. One of them was selected for irrigation using tap water throughout the experiment (control) and the rest of seedy strains were used for salinity treatment. Salt solution was prepared according to Abou El-Khashab et al. [Citation28], as follows: 0.90 ml CaCl2 (2 M), 1.24 ml Mg SO4(1 M), 1.49 ml KCl (1 M), 1.03 ml KSO4 (1 M), 5.0 ml Na2SO4(1 M) and 2.80 ml NaCl (4 M) then dilution to a total volume of 1 L. The final concentration of this solution was 2000 ppm. At the beginning of the experiment, seedy strains selected for salinity treatment were irrigated with 1 L of salt solution as needed and leached with tap water after every fourth irrigation to prevent salt accumulation. Salt treatment was continued for 6 months. Control seedy strain was irrigated using tap water throughout the experiment. After this period, only eight seedy strains continued to grow under salinity stress. These growing seedy strains have been used in assessment.
Molecular assessment
Molecular diversity assessment
DNA isolation
Genomic DNA was isolated from fresh leaves by DNeasy plant mini kit (bio basic). DNA quality was checked using spectrophotometer and agarose gel electrophoresis.
Polymerase chain reaction
Genomic DNA was used as a template for PCR amplification using 14 ISSR primers and 10 SCoT primers in molecular assessment for the eight seedy strains continued to grow under salinity stress. ISSR primers were procured from Operon Technology, Alameda, U.S.A. SCoT primers were designed by Collard and Mackill [Citation16], depending on the consensus sequence derived from the previous studies by Joshi et al. [Citation14], and Sawant et al. [Citation15], and procured from Biobasic Com. All SCoT primers used in this study were 18-mer and were from Dataset-I which based on highly expressed gene. Dataset-I were first identified by comparing 36 genes, typically known for a high level of expression in plants on the basis of several individual studies using expressed sequence tags (ESTs) [Citation29]. They were reported based on the abundance of their transcripts and the encoded protein products in plant tissues as described by Sawant et al. [Citation15]. For SCoT primers design, the start codon ATG (+1, +2, and +3), ‘G’ at position +4, ‘C’ at position +5, and A, C, C and A at positions +7, +8, +9 and +10, respectively, were fixed (5´-----ATGGCTACCA---3´).
Amplification reactions for ISSR and SCoT techniques were performed as described by Fathi et al. [Citation30], and Xiong et al. [Citation31], respectively, and were carried out in Techni TC-512 Thermal Cycler as follows: One cycle at 94°C for 4 min followed by 40 cycles of 1 min at 94°C, 1 min at annealing temperature (57°C for ISSR and 55 for SCoT) and 2 min at 72°C, followed by 72°C for 10 min, the reaction was finally stored at 4°C.
Gel electrophoresis
Amplified products were separated on a 1.5% agarose gel with ethidum bromide and 100 bp to 1.5 kb ladder markers. The run was carried out for about 30 min at 100 V in mini submarine gel BioRad.
Gel reading and analysis
DNA banding pattern photos were photographed using Bio-1D Gel Documentation system and were analyzed by GelAnalyzer 3 software. Clear amplicons were scored as present (1) or absent (0) for each primer and entered in the form of a binary data matrix. From this matrix, DNA-profiles were performed for ISSR and SCoT techniques according to Adhikari et al. [Citation32]. Polymorphic Information Content (PIC) and DI (Diversity Index) were calculated according to, PIC = 1-p2-q2, DI = average PIC value [Citation18] where p is frequency of present amplicon and q is frequency of absent amplicon. Also, from binary data, the capability of each primer to differentiate among studied seedy strains was evaluated according to Resolving power (Rp) value calculated as described in Prevost & Wilkinson [Citation33].
According to binary data matrix, Molecular distances MD (Dissimilarity) were calculated by Dice coefficient [Citation34] and cluster analysis was performed agglomerative hierarchical clustering (AHC) analysis derived from Unweighted pair-group average UPGMA method using XLSTAT.7 software.
Gene expression activity measurement
RNA isolation and cDNA synthesis
Total RNA was isolated from leaves samples both treated and control (irrigated with tap water) using TRIzol® reagent according to manufacturer’s instruction (Ambion by Life Technologies, USA). After that, QIAGEN® RNase-Free DNase Set was used to remove genomic DNA from RNA preparations.
For cDNA synthesis, 1μg high-quality RNA was reverse transcribed using RevertAid™ First Strand cDNA Synthesis Kit (Thermo Scientific) in Techni TC-512 PCR system, following manufacturer manual.
Primer design
Specific primer pairs were designed based on sequence information available at NCBI GenBank database for Prunus mume (Japanese apricot) using Primer-BLAST and procured from Biobasic Com.
Primer pairs of target gene P5CS delta-1-pyrroline-5-carboxylate synthase (NCBI RefSeq XM_008235270.1) for gene expression analysis were:
P5CS F: 5´-GCCTGTAACGCAATGGAAACACTT-3´
P5CS R: 5´-GCTTGCCCTTGGTCCACCATATAA-3´
For normalization of gene expression level for target gene, Tubulin-beta chain (β-Tub) (NCBI RefSeq XM_008236021.1) was used as a housekeeping or reference gene according to Kumar et al. [Citation35]. Primer pairs for β-Tub gene were:
β-Tub F: 5´-ACTGTTTGTGATATCCCACCTACT -3´
β-Tub R: 5´-TCGTTCATGTTGCTCTCCGCCTCG -3´
These primers were procured from Biobasic Com. and checked on cDNA apricot samples using PCR then gel electrophoresis. The primers produced specific amplicons of 123 bp for P5CS gene and 197 bp for β-Tub gene.
Quantitative RT-PCR
Quantitative 3-step RT-PCR was performed using a SensiFAST SYBR® No-ROX protocol in RotorGene-6000 system (Corbett Robotics Australia). In this reaction, cDNA from each sample was distributed to four PCR tubes: two tubes for P5CS and the other two tubes for β-Tub. The real-time PCR program was as follows: initial denaturation at 95°C for 15 min; 40 cycles of denaturation at 94°C for 15 s; annealing at 60°C for 25 s and extension at 72°C for 30 s. Data acquisition performed during the extension step.
Gene expression analysis
Expression pattern of P5CS gene in leaves tissues was determined using Method according to Livak and Schmittgen [Citation36], and normalized to the expression of β-Tub gene as a reference gene (endogenous control). The output data were transformed to log2 fold change (FC) values relative to the control (fold relative expression) according to Youssef et al. [Citation37]. Significant differences between log2 FC values were determined according to Duncan’s Multiple Range Test at P ≤ 0.05. To verify targeting accuracy, at the end of the PCR program dissociation was carried out through slowly heating the PCR products from 72°C to 95°C and continuous recording of the reduction in SYBR Green fluorescence following the dissociation of dsDNA on melting curve for P5CS and β-Tub genes. The peak of the curve for all samples was approximately the same Tm for each amplicon (about 80°C for amplicons β-Tub gene and 82°C for amplicons P5CS of gene) (Figure S1, supplementary data).
Assay of some stress-related phytochemical parameters
Four phytochemical parameters were estimated for the tested eight seedy strains relative to control.
Proline accumulation
Proline accumulation (µg/ml) in leaves was determined by colorimetric proceeding according to Bates et al. [Citation38], and Marín et al. [Citation39], using spectrophotometer.
Total antioxidants capacity
The total antioxidants capacity (µg/ml) in apricot leaves were extracted and evaluated according to the phosphomolybdenum method Prieto et al. [Citation40], at absorbance 695 nm using spectrophotometer against methanol as the blank.
Total phenolics
The total phenolics content of methanolic extract was determined according to [Citation41].
Total flavonoids
Total flavonoids were estimated using method of [Citation42]. Significant differences between values of all the above parameters were determined at p ≤ 0.05 and 0.01 according to Fisher’s Least Significant Difference (LSD) Test using SAS 9.1 software.
Based on the phytochemical data of eight seedy strains, Euclidian distances ED were calculated and clustering dendrogram was drawn using the statistical approach based on the Euclidian distance algorithm using XLSTAT.7 software.
Finally, the relationships between molecular distances (MD) and Euclidian distances (ED) were explained based on simple correlations using the computational software Minitab 17.
Results and discussion
Molecular assessment
This is the first report of studying the genetic variability in Alamar Apricot Rootstock using SCoT markers compared with ISSR markers. Where 24 primers were tested on samples of apricot rootstock, seven ISSR and eight SCoT primers gave prominent and reproducible bands. These primers were selected for final amplification and data analysis. Banding patterns of these techniques were shown in and . Evidently, ISSR and SCoT techniques revealed polymorphic patterns and confirmed to be valid in discriminating the Apricot seedy strains.
Figure 1. Banding patterns of ISSR-PCR products for eight seedy strains of Alamar apricot rootstock produced with seven primers. L, 1.5 kbp ladder and lanes 2 to 9 represent the eight genotypes.
Figure 2. Banding patterns of SCoT-PCR products for eight seedy strains of Alamar apricot rootstock produced with eight primers. L, 1.5 kbp ladder and lanes 2 to 9 represent the eight genotypes.
DNA profiling (Figures S2 and S3, supplementary data) showed that ISSR primers except 14A generated 17 (10 negative and 7 positive) out of 77 amplicons, also SCoT primers except SCoT-2 generated 23 (15 negative and 8 positive) out of 101 amplicons. These unique amplicons may be useful as unique markers as explained by Adhikari et al. [Citation32], in Cymbopogon; Abd El-Aziz and Habiba [Citation43], in canolla; Abd El-Aziz et al. [Citation44], in tomato and Abd El-Hadi et al. [Citation45], in squash.
The molecular data estimated from banding patterns of ISSR and SCoT techniques (Figures S2 and S3 and Tables S1 & S2, supplementary data) detected that the ISSR primers (HB-12, HB-14 and HB-15) and SCoT primer (SCoT-11) showed the highest number of amplicons compared with primers of the same technique. Moreover, the SCoT primer (SCoT-12) and ISSR primer (14A) showed the lowest number of amplicons. SCoT-11, HB-12 and HB-14 primers showed the highest Rp value 8.50, 8.50 and 8.25 with polymorphism % and PIC of (82.35, 0.327) (93.33, 0.359) and (92.86, 0.382), respectively. This indicates a high discriminatory potential of these primers in accordance with previous illustrations by Prevost & Wilkinson [Citation33]. On the other hand, indicating that out of total amplicons number (77), 30 with ratio 38.96% and out of total unique amplicons (17), 5 with ratio 31.25% were generated by primers (HB-14, 14A and 44B) that contain the repetitive motif (CT)n. This, suggesting that this microsatellite is more successful in generating reliable amplicons in Alamar apricot rootstock.
Also, it is illustrated that all successfully SCoT primers in this study (Table S2, supplementary data), which target highly expressed genes as described by Sawant et al. [Citation15], were different in the last three nucleotides at the 3´ end and were similar in the last five nucleotides at the 5´ end except two primers (SCoT-11 and SCoT-12). However, all of these primers showed different data and marker profiles (), which is in agreement with those results obtained by Aswathy et al. [Citation17].
In comparison to SCoT primers, ISSRs generated less scorable and polymorphic amplicons per primer (Table S3, supplementary data). Amplicon molecular size (bp) of each ISSR and SCoT techniques ranged from 188:1627 and from 193:1903 bp, respectively. The rate of genetic diversity, unique marker % and polymorphism average % among the eight seedy strains of Alamar apricot rootstock, based on SCoT and ISSR markers were nearly equal. Although there are no clear differences between SCoT and ISSR techniques in genetic diversity rate, the average of Rp value which reflects overall discrimination capacity and identification efficiency for SCoT technique (5.75) was higher than its value for ISSR technique (4.89). More importantly, SCoT marker is generated from the functional region of the genome, the genetic analyzes using this marker would be more useful for crop improvement programs such as genotype identification, genetic diversity, construction of linkage maps and QTL mapping [Citation46].
Also, showed that among the eight seedy strains, six (A3, A4, A5, A6, A7 and A8) were characterized by 40 unique markers (15 positive and 25 negative). Seventeen (7 positive and 10 negative) from these marker loci were targeted by ISSR primers, while the other 23 unique markers (8 positive and 15 negative) were targeted by SCoT primers. A8 is characterized by the highest number of negative markers (10), while A5 had the highest number of positive markers (8). These results indicate that all techniques applied in this study succeeded in showing different marker loci which can be relied upon in distinguishing most of studied seedy strains.
Table 1. Genotypes of Alamar apricot rootstock which characterized by unique positive and/or negative markers, molecular size and total number of these markers identifying each genotype.
On the other hand, molecular distance (MD) matrix between all studied seedy strains based on SCoTs, ISSRs and combined data was recorded in .
Table 2. Molecular distances (MD) between eight Apricot rootstock strains based on Dice-dissimilarity index for ISSR, SCoT and combined data.
This matrix indicates that the range of molecular distances (MD) based on ISSR ranged from 0.127 (between A2 and A4 strains) to 0.398 (between A2 and A8 strains), was lower than the range of MD based on SCoT markers which ranged from 0.111 (between A2 and A3 strains) to 0.427 (between A3 and A8 strains). MD based on the combined data ranged from 0.164 to 0.404 among the same genotypes was defined by SCoT technique.
Hence, previous results illustrated the advantage of SCoT technique in terms of genetic diversity assessment in apricot compared to ISSR technique. These results were in agreement with Gorji et al. [Citation18], in Potato and Etminan et al. [Citation10], in durum wheat. While Baghizadeha and Dehghan [Citation47], recommended that it is better to use both techniques in conjunction with each other for distinctive fingerprinting.
Accordingly, and based on the correlation coefficients for molecular distance among ISSR, SCoT and combined data, insignificant positive correlation (r = 0.193) was shown between ISSR and SCoT techniques. Also, showed highly significant positive correlation among ISSR and SCoT with the combined data (r = 0.62 and 0.89, respectively), this matches with Xanthopoulou et al. [Citation48], in squash. So, cluster analysis was conducted using combined data only, according to Abd EL-Aziz et al. [Citation44], and Abd El-Hadi et al. [Citation45].
shows dendrogram of the AHC analysis derived from UPGMA method using Dice-dissimilarity index for combined data of ISSR and SCoT techniques according to Xanthopoulou et al. [Citation48]. This dendrogram is divided into six groups according to the truncated line at a coefficient of dissimilarity = 0.185, each group contained one seedy strain except one group contained three seedy strain A2, A3 and A6.
Figure 3. Dendrogram derived by UPGMA method using Dice-dissimilarity coefficient for combined binary data of ISSR and SCoT techniques for eight seedy strains of Alamar apricot rootstock.
Legend: TL represents truncated line at a coefficient of Dissimilarity = 0.185
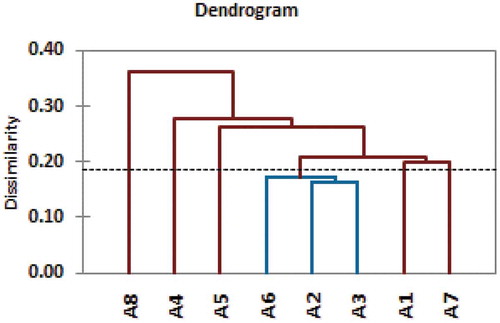
This confirms that the combined data of SCoT and ISSR techniques were suitable for evaluating the genetic relationships among the tested strains of Alamar apricot rootstock because they accurate the information about genetic diversity. This result was in agreement with that of Baghizadeha and Dehghan [Citation47], who reported that cluster analysis based on SCoT and ISSR data clearly discriminated the Iranian pistachio cultivars in terms of their genetic characterizations.
P5CS gene relative expression
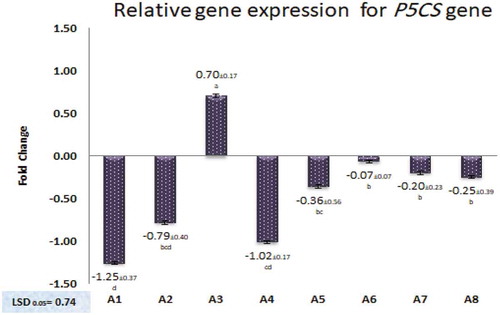
Celik and Atak [Citation7] indicated that P5CS is the main gene responsible for catalyzing proline synthesis which plays an important role in plant adaptation with salinity stresses. The expression of this gene may vary among cultivars and under different salinity conditions. In this study, Patterns of P5CS gene expression in leave tissues of the tested eight seedy strains after salinity treatment () were tested and compared. The fold changes (FC) in gene expression (Table S4, supplementary data), compared to control, were Log2 transformed. These patterns illustrate that the P5CS gene expression in A1, A2 and A4 strains were significantly down-regulated compared with control (P ≤ 0.05), whereas insignificant differences were observed between A5, A6, A7 and A8 strains with control. Where, the A3 strain was the only one that showed a significant increase in P5CS gene expression compared to control (with Log2 FC = 0.70). The reasons behind differential expression of P5CS in the tested strains may be due to variation among genotypes of these strains that indicated by the differential patterns of ISSR and SCoT techniques ( and ). This agrees with Abdel-Lateif and Hewedy [Citation49], who found that the P5CS gene expression patterns and SCoT patterns were different among eight cultivars of Egyptian wheat. Also, agrees with Al-Qurainy et al. [Citation50], who reported that cDNA-SCoT marker in date palm showed a variation in different gene expressions profiling between treated and untreated plants under various NaCl concentrations. This indicates the SCoT markers may be co-localized with P5CS gene which is increasingly expressed under water deficit [Citation23].
Figure 4. Relative expression levels to the control (Fold change log2 transformed) of P5CS gene in leaves tissues of eight seedy strains. Data were analyzed using the method.
Means are statistically different according to Duncan’s Multiple Range Test at P ≤ 0.05.
Phytochemical parameters assessment
indicates the assessment of stress-related phytochemical parameters in the eight seedy strains which were treated with salinity treatment as relative values attributed to the control. All seedy strains showed higher values than control for all parameters (Table S4, supplementary data), where A3 was the best seedy strain in all parameters.
Figure 5. The relative content to the control of total antioxidants (TA), total flavonoids (TFlav), total phenolics (TPhen) and proline (Prol) in leaves of seedy strains of Alamar Apricot Rootstock.
Means are statistically different according to Duncan’s Multiple Range Test at P ≤ 0.05.
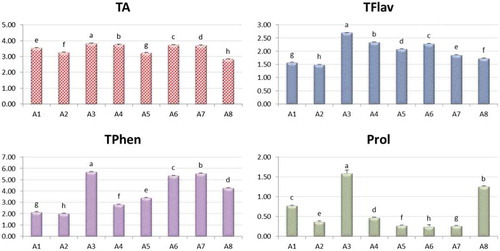
Many studies have been interested in the effect of salinity stress on phytochemical parameters such as proline, phenolics, antioxidant and flavonoids, such as Agastian et al. [Citation51], Shigeoka et al. [Citation52], Parida et al. [Citation53], Mahajan and Tuteja [Citation54], Chaves et al. [Citation55], Yuan et al. [Citation56], and Rezazadeh et al. [Citation57]. These studies indicated that these phytochemical parameters increase at higher salinity levels to help plants tolerate salinity stress.
From this result and those of P5CS gene expression activity measurement (), it is illustrated that A3 strain showed the best tolerance against salinity stress among studied seedy strains of Alamar Apricot Rootstocks.
From Phytochemical data, distances among the eight seedy strains were calculated using Euclidian method. The results of Euclidian distances (ED) matrix in exhibited that the distances ranged from 0.7 to 36.6. The highest ED value was between the strainA3 and A5, whereas the lowest ED value was between the strain A6 and A7. Also, from ED matrix, the dendrogram of cluster analysis was performed (). This dendrogram is divided into three groups according to the truncated line at a coefficient of dissimilarity = 17.16. The first group contained A8 seedy strain, the second group contained the best seedy strain A3 in all parameters and the third group contained the other six seedy strains.
Figure 6. Agglomerative hierarchical clustering (AHC) derived by UPGMA method using Euclidean distance approach for phytochemical data of eight seedy strains of Alamar apricot rootstock.
Legend: TL represents truncated line at a coefficient of Dissimilarity = 17.16
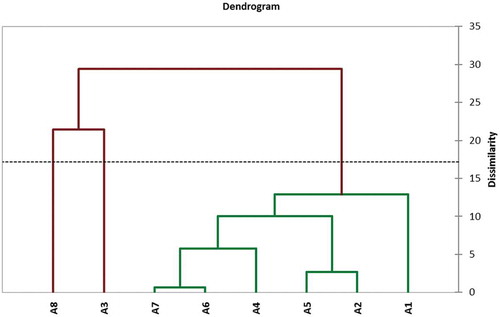
Table 3. Euclidian distances (ED) between eight Apricot rootstock strains based on dissimilarity index for obtained from phytochemical data.
On the other hand, by calculating the correlation coefficients among Euclidian distances and molecular distances based on ISSR, SCoT and combined data, significant positive correlation was found only between distances based on ISSR data and Euclidian distances (r = 0.476). This indicates that the ISSR markers in , through other studies can be associated with the traits of interest (such as salinity stress-related traits) according to Abd El-Hadi et al. [Citation45]. Especially, the unique markers which identified for A3 seedy strain that showed best performance in terms of all tested stress-related parameters. These unique markers were two positive targeted by HB-12 primer (271 and 1190 bp) and three negative targeted by 44B primer (411, 609 and 796 bp). These markers may be used as markers assisted selection in improvement of salinity tolerance in Alamar apricot rootstock.
In conclusion, the molecular analysis of the tested seedy strains of Alamar apricot has revealed clear differences at the molecular level among these strains. Also, these differences were demonstrated by the performance of these strains under salinity stress conditions in terms of P5CS gene expression and accumulation of salinity tolerance-related metabolites. The latter were correlated with differences at the molecular level that detected by ISSR molecular marker technique. Where, the A3 strain was distinct in performance and number of ISSR unique molecular markers. So, it could be suggested that this strain could be utilized as a source of salinity tolerance-related genes in Alamar apricot rootstock. In addition, we recommend propagating this strain by vegetative growth (cuttings) to widespread in reclaimed lands and salt land up to 2000ppm.
Supplemental Material
Download MS Word (128.3 KB)Disclosure statement
No potential conflict of interest was reported by the authors.
Supplementary Material
Supplemental data of this article can be accessed here.
Related Research Data
References
- Layne REC, Bailey CH, Hough LF. Apricots. In: Janick J, Moore JN, editors. Fruit breedings .I. Tree and tropical fruits. New York, Chichester, Brisbane, Toronto, Singapore: John Wiley and Sons Inc; 1996. p. 79–109.
- FAO. Crops and drops. Making the best use of water for agriculture. Roma: Food and Agriculture Organization of The United Nations; 2002. p. 26.
- Sengupta S, Majumder AL. Insight into the salt tolerance factors of a wild halophytic rice, Porteresia coarctata: a physiological and proteomic approach. Planta. 2009;229:911–992.
- Gorai M, Neffati M. Germination responses of Reaumuria vermiculatato salinity and temperature. Ann Appl Biol. 2007;151:53–59.
- Rengasamy P. World salinization with emphasis on Australia. J Exp Bot. 2006;57:1017–1023.
- Frommer WB, Ludewig U, Rentsch D. Taking transgenic plants with a pinch of salt. Science. 1999;285:1222–1223.
- Celik O, Atak C. Evaluation of proline accumulation and Δ1-pyrroline-5-carboxylate synthetase (P5CS) gene expression during salinity stress in two soybean (Glycine max L. Merr.) varieties. Pol J Environ Stud. 2012;3(21):559–564.
- Mohamed SY, Shoaib RM, Gadalla NO. Selection of some seedling apricot strains at Alamar Region. J Appl Sci. 2015;15(2):195–204.
- Zhang J, Xie W, Wang Y, et al. Potential of start codon targeted (SCoT) markers to estimate genetic diversity and relationships among Chinese Elymus sibiricus accessions. Molecules. 2015;20(4):5987–6001.
- Etminan A, Pour-Aboughadareh A, Mohammadi R, et al. Applicability of start codon targeted (SCoT) and inter-simple sequence repeat (ISSR) markers for genetic diversity analysis in durum wheat genotypes. Biotechnol Equip. 2016;30(6):1075–1081.
- Zietkiewicz E, Rafalski A, Labuda D. Genome fingerprinting by simple sequence repeat (SSR)-anchored polymerase chain reaction amplification’. Genomics. 1994;20:176–183.
- Kantety RV, Zeng XP, Bennetzen JL, et al. Assessment of genetic diversity in dent and popcorn (Zea mays L.) inbred lines using inter-simple sequence repeat (ISSR) amplification. Mol Breed. 1995;1:365–373.
- Guo L, Li H, Luoa Z. New insights into the genetic diversity and species identification of the native apricots in Southern Xinjiang of China. Genet Mol Res. 2018;17(1):16039874.
- Joshi CP, Zhou H, Huang X, et al. Context sequences of translation initiation codon in plants. Plant Mol Biol. 1997;35:993–1001.
- Sawant SV, Singhl PK, Gupta SK, et al. Conserved nucleotide sequences in highly expressed genes in plants. J Genet. 1999;78:123–131.
- Collard BCY, Mackill DJ. Start Codon Targeted (SCoT) polymorphism: a simple, novel DNA marker technique for generating gene-targeted markers in plants. Plant Mol Biol Rep. 2009;27:86–93.
- Aswathy L, Jisha RS, Masand VH. Computational strategies to antimalarial thiazine alkaloid lead compounds based on an Australian marine sponge Plakortislita. J Biomol Struct Dyn. 2017;35(11):2407–2429.
- Gorji AM, Poczai P, Polgar Z, et al. Efficiency of arbitrarily amplified dominant markers (SCOT, ISSR and RAPD) for diagnostic fingerprinting in tetraploid potato. Am J Pot Res. 2011;88:226–237.
- Knoch E, Dilokpimol A, Geshi N. Arabinogalactan proteins: focus on carbohydrate active enzymes. Front Plant Sci. 2014;5:189–198.
- Kishor PBK, Reenivasulu NS. Is proline accumulation per se correlated with stress tolerance or is proline homoeostasis a more critical issue. Plant Cell Environ. 2014;37:300–311.
- Signorelli S, Monza J. Identification of Δ1-pyrroline 5-carboxylate synthase (P5CS) genes involved in the synthesis of proline in Lotus japonicus. Plant Signal Behav. 2017 Nov 2;12(11):e1367464. doi: 10.1080/15592324.2017.1367464. Epub 2017 Oct 6. PMID: 28985146; PMCID: PMC5703238
- Shin H, Oh S, Arora R, et al. Proline accumulation in response to high temperature in winter-acclimated shoots of Prunus persica: a response associated with growth resumption or heat stress. Can J Plant Sci. 2016;96(4):630–638.
- Rickes, Leticia Neutzling et al. Differential expression of the genes involved in responses to water-deficit stress in peach trees cv. Chimarrita grafted onto two different rootstocks. Bragantia. 2019;78(1): 60–70. ISSN 0006-8705. doi: 10.1590/1678-4499.2017372.
- Hmida-Sayari A, Gargoui-Bouzid R, Bidani A, et al. Overexpression of Δ1-pyrroline-5-carboxylate synthetase increases proline production and confers salt tolerance in transgenic potato plants. Plant Sci. 2005;169:746–752.
- Ghanti KKS, Sujata KG, Vijay BM, et al. Heterologous expression of P5CS gene in chickpea enhances salt tolerance without affecting yield. Biol Plant. 2011;55:634–640.
- Bolat I, Dikilitas M, Ikinci A, et al. Morphological, physiological, biochemical characteristics and bud success responses of myrobolan 29 c plum rootstock subjected to water stress. Can J Plant Sci. 2016;96:485–493.
- Kharusi LA, Al Yahyai R, Yaish MW. Antioxidant response to salinity in salt-tolerant and salt-susceptible cultivars of date palm. Agriculture. 2019;9(1):8.
- Abou El-Khashab AM, El-Sammak AF, Elaidy AA. Paclobutrazol reduces some negative effects of salt stress in peach. J Am Soc Hortic Sci. 1996;122(1):43–46.
- Sasaki T, Song J, Koga-Ban Y, et al. Towards cataloguing all rice genes: large-scale sequencing of randomly chosen rice cDNAs from a callus cDNA library. Plant J. 1994;6:615–624.
- Fathi MA, Hussein SHM, Mohamed SY. Horticultural and molecular genetic evaluation of some peach selected strains cultivated under kalubiah governorate conditions. J Am Sci. 2013;9(1s):12–23.
- Xiong FQ, Zhong RC, Han ZQ, et al. Start codon targeted polymorphism for evaluation of functional genetic variation and relationships in cultivated peanut (Arachis hypogaea L.) genotypes. Mol Biol Rep. 2011;38:3487–3494.
- Adhikari S, Saha S, Bandyopadhyay TK, et al. Efficiency of ISSR marker for characterization of Cymbopogon germplasm and their suitability in molecular barcoding. Plant Syst Evaluation. 2015;301:439–450.
- Prevost A, Wilkinson MJ. A new system of comparing PCR primers applied to ISSR fingerprinting of potato cultivars. Theor Appl Genet. 1999;98:107–112.
- Nei M, Li WH. Mathematical model for studing genetic variation in terms of restriction endonucleases. Proc Natl Acad Sci, USA. 1979;76:5269–5273.
- Kumar V, Sharma R, Trivedi PC, et al. Traditional and novel references towards systematic normalization of qRT PCR data in plants. Aust J Crop Sci. 2011;5(11):1455–1468.
- Livak KJ, Schmittgen TD. Analysis of RELATIVE GENE EXPRESSION DATA USING REAL-TIME QUANTITative PCR and the 2−∆∆CT method. Methods. 2001;25(4):402–408.
- Youssef K, Sanzanib SM, Ligoriob A, et al. Sodium carbonate and bicarbonate treatments induce resistance to postharvest green mould on citrus fruit. Postharvest Biol Technol. 2014;87:61–69.
- Bates L, Waldren RP, Teare ID. Rapid determination of free proline for water stress studies. Plant Soil. 1973;39:205–207.
- Marin JA, Andreu P, Carrasco A, et al. Determination of proline concentration, an abiotic stress marker, in root exudates of excised root cultures of fruit tree rootstocks under salt stress. Revue Des Régions Arides. 2010;2(4):722–727.
- Prieto P, Pined AM, Anguilar M. Spectrophotometric quantitation of antioxidant capacity through the formation of a Phosphomolybdenum Complex: specific application to the determination of Vitamin E. Anal Biochem. 1999;269:337–341.
- Singleton VL, Orthofer R, Lamuela-Raventos RM. Analysis of total phenoicls and other oxidation substances and antioxidants by means of FolinCiocalteu reagent. Methods Enzymol. 1999;299:152–178.
- Woisky RG, Salation A. Analysis of propolis: some parameters and procedures for chemical quality control. J Apiculatural Res. 1998;37:99–105.
- Abd El-Aziz MH, Rehab MMH. Molecular assessment of genetic diversity in some canola homozygous lines. Egypt J Genet Cytol. 2016;45:129–145.
- Abd El-Aziz MH, Farid SM, Sara AA, et al. Evaluation of molecular and phenotypic diversity in relation to heterosis in some toma to lines under different climatic conditions. J Agric Chem Biotechn. 2016;7(5):141–151. Mansoura Univ.
- Abd El-Hadi AH, Abd El-Aziz MH, AbdAlla MA, et al. Molecular and phenotypic evaluation of some summer squash inbred lines. J Agric Chem Biotechn. 2017;8(12):581–587. Mansoura Univ.
- Hajibarat Z, Saidi A, Hajibarat Z, et al. Characterization of genetic diversity in chickpea using SSR markers, Start Codon Targeted Polymorphism (SCoT) and conserved DNA-derived polymorphism (CDDP). Physiol Mol Biol Plants. 2015;21(3):365–373.
- Baghizadeha A, Dehghanb E. Efficacy of SCoT and ISSR markers in assessment of genetic diversity in some Iranian pistachio (Pistaciavera L.) cultivars. Pistachio Health J. 2018;1(1):37–43.
- Xanthopoulou A, Ganopoulos I, Kalivas A, et al. Comparative analysis of genetic diversity in Greek Genebank collection of summer squash (Cucurbita pepo) landraces using start codon targeted (SCoT) polymorphism and ISSR markers. Aust J Crop Sci. 2015;9(1):14–21.
- Abdel-Lateif KS, Hewedy OA. Genetic diversity among Egyptian wheat cultivars using SCoT and ISSR markers. SABRAO J Breed Genet. 2018;50(1):36–45.
- Al-Qurainy F, Khan S, Nadeem M, et al. Antioxidant system response and cDNA-SCoT marker profiling in Phoenix dactylifera L. Int J Genomics. 2017;10. ID 1537538. DOI:10.1155/2017/1537538.
- Agastian P, Kingsley SJ, Vivekanandan M. Effect of salinity on photosynthesis and biochemical characteristics in mulberry genotypes. Photosynthetica. 2000;38:287– 290.
- Shigeoka S, Ishikawa T, Tamoi M, et al. Regulation and function of ascorbate peroxidase isoenzymes. J Exp Bot. 2002;53:1305–1319.
- Parida AK, Das AB, Mohanty P. Investigations on the antioxidative defense responses to NaCl stress in a mangrove, Bruguiera parviflora: differential regulations of isoforms of some antioxidative enzymes. Plant Growth Regul. 2004;42:213–226.
- Mahajan S, Tuteja N. Cold, salinity and drought stresses: an overview. Arch Biochem Biophys. 2005;444:139–158.
- Chaves MM, Flexas J, Pinheiro C. Photosynthesis under drought and salt stress: regulation mechanisms from whole plant to cell. Ann Bot. 2009;103:551–560.
- Yuan G, Wang X, Guo R, et al. Effect of salt stress on phenolic compounds, glucosinolates, myrosinase and antioxidant activity in radish sprouts. Food Chem. 2010;121:1014–1019.
- Rezazadeh A, Ghasemneshaz A, Barani M, et al. Effect of salinity on phenolic composition and antioxidant activity of artichoke (Cynara scolymus L.) leaves. Res J Med Plant. 2012;6:245–252.