
ABSTRACT
A methodology for the determination of a critical size of surface defects, above which RCF can initiate, has been developed and demonstrated with its application to the passive type of squats under typical Dutch railway loading conditions. Such a methodology is based on stress evaluation of transient rolling contact at the defects, for which a detailed 3D frictional rolling contact model is integrated in the vehicle–track interaction system. Through comparing the maximal von Mises stress at defects of different sizes with the tensile strength of the rail material, the critical size is derived for squats. Observations during a field monitoring test show a good validation of the determined critical size. In practice, the critical size can be used for distinguishing between light squats and trivial defects by visual inspection or by automatic image recognition, so that false statistics of squats can be reduced or prevented. With necessary modifications and improvements, the developed methodology may also be applied to RCF of other rolling contact pairs in general, such as bearings and gears.
1. Introduction
1.1. Rolling contact fatigue in general
Rolling contact fatigue (RCF) has become one of the main failure mechanisms of rolling components, such as bearings [Citation1] and rails [Citation2]. Especially, surface-initiated RCF has become preponderant for the steel material nowadays due to continuous developments in steelmaking in the past decades [Citation2–Citation5]. This paper tries to examine the probability of RCF initiation from surface defects based on a transient stress analysis. The initial inhomogeneity of the steel material is ignored.
For relatively hard steel used for bearings and gears working normally in a lubricated and sealed environment, micro roughness may serve as the origin of surface-initiated RCF [Citation6]. This situation occurs when the lubricant film is so thin that it is penetrated by the asperities. Plastic deformation can, therefore, occur at the vicinity of asperity contact [Citation4], and further accumulates when cyclic contact happens, leading to RCF (most likely micro-pitting) in a later stage. Stress concentration and higher friction coefficients with asperity contact (steel-to-steel contact) [Citation6] are behind the mechanism. On the other hand, steel is usually more sensitive to cracking as hardness increases, because a hardness rise is often accompanied by a higher percentage of brittle martensite [Citation7]. This characteristic is partly seen from the fact that ductility of steel usually decreases with increasing hardness (see the mechanical property data of steel shown in [Citation7–Citation9]). Thus, the high strength (or high hardness) of a hard steel also contributes to its RCF initiation. It should, however, be emphasized that surface defects (i.e. macro roughness) is more dangerous, for example, dents caused by wear particles or debris [Citation3,Citation10], decomposed sinusoidal roughness through FFT [Citation11], and the main structure of a surface finish [Citation4].
For rail steel (relatively soft), micro roughness and the influence of wear particles on the evolution of contact surfaces is less important due to the following reasons. First, the wheel–rail contact is in an open and unlubricated system, so that the contact surface of a rail is renewed quickly due to the much higher wear rate resulted from the higher friction force than those in lubricated systems. Second, wear particles cannot exist for a long time in the wheel–rail interface because the system is open. Third, rail steel has higher tolerance to cracking due to its relatively large ductility. Consequently, rail grinding, which brings about obvious surface roughness, can be applied into the railway practice safely. Nevertheless, in an open railway system rail RCF can indeed initiate when relatively large surface defects come into being, for example, at indentations caused by hard objectives trapped in the wheel–rail interface [Citation12].
It was suggested in [Citation13] that roughness at micro-pitting, caused by material removal through fatigue in the scale of asperity contact, may not grow up and lead to larger sized macro-pits. In railway field, it was also observed that most indentations do not grow up, but are gradually worn away, which is particularly observed at level crossings. These phenomena in different industries indicate that a surface defect should be large/severe enough in order to cause a notable damage to a system. This paper tries to present an approach to determine the critical size for a surface defect to initiate RCF. To this end, a fatigue criterion is employed for low cycle RCF on the basis of a detailed stress analysis performed with a 3D transient finite element (FE) model. The dynamic effect and the stress concentration caused by the surface defect are both taken into account.
Considering the great difference between industries and for the authors’ convenience, the squat type RCF occurring in the rail is analysed as an example to demonstrate the approach in detail. Micro roughness is ignored due to its negligible influence on rail RCF. For readers’ convenience, more research background about squats will be presented first in the next section before introducing the research approach.
1.2. Squat type RCF in the railway
The rail is designed to provide a smooth surface for the wheel to run on it. However, many irregularities gradually occur and grow during service in the running surface of the rail under certain conditions. Squats, which are a visual depression in the middle of the running band, are among these irregularities [Citation2,Citation12,Citation14]. They have become one of the main concerns on many railway networks with changes in maintenance practice and with continuous increase in speed, axle load, etc. In the Netherlands, squats have nowadays become the chief rail damage, since head checks are under control.
Squats usually occur in the running band of rails on straight tracks and shallow curves. They have been found on all types of track: ballasted or slab track, with wooden or concrete sleepers, with passenger, freight, or mixed traffic. They occur not only on high speed lines, but also on conventional and metro lines. A fundamental characteristic of squats is large local plastic deformation and the absence of shakedown. The initiation of squats is sometime related to vertical irregularities on the rail top, such as indentations and wheel burns.
There have been mainly three lines of research on squats: from the point of view of metallurgy, from the point of view of crack growth, and from the point of view of squats initiation, detection, and prevention.
Clayton et al. [Citation15] reviewed a metallurgical research programme at British Rail on surface-initiated rail problems, with squats among them. Longitudinal–vertical sectioning of rail specimens showed that surface-initiated cracks could branch downwards, and when they reached a certain depth, brittle fracture could occur and result in a broken rail. Bogdański and his colleagues have numerically studied squat cracks under various conditions, and their latest work treated the effect of entrapped liquid [Citation16].
Since 2006, some investigations have been concentrated on the mechanism of initiation and growth of squats, as well as their root causes. The goals of the investigations are early detection and prevention of squats. The approach consists of correlation and numerical analyses [Citation12,Citation14,Citation17,Citation18], measurement of dynamic responses [Citation19], and their validation by field monitoring [Citation12,Citation14,Citation18]. The correlation analyses related squat occurrence to certain parameters in the vehicle–track interaction system and to observations of phenomena around squats in the tracks. The numerical analyses were employed to quantify the relation between the influential parameters identified in the correlation analysis and the dynamic rolling contact forces, stresses, and strains. A few of the most influential parameters were further identified. The monitoring of squats evolution during service has provided realistic inputs to the analyses, and has provided data for validation.
Based on field observations and numerical analysis, Li et al.[Citation17] found that squats may initiate as a result of differential wear and differential plastic deformation. Such a damage mechanism may be triggered by track defects, for example, at a damaged insulated joint. More important squat origins are short wave irregularities on the rail top, such as corrugation, indentations, and welds of poor quality [Citation14]. Based on numerical simulations, a squat growth process was postulated, and the influence of friction on squat initiation and growth was predicted. The simulations also revealed that the growth of squats was related to some eigenmodes of the wheel–track interaction system and the high frequency vibration at wheel–rail contact played an important role. The validation of these numerical results is presented in [Citation12].
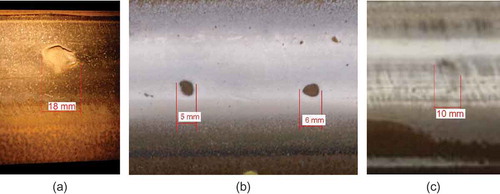
Squats in nature can be divided in two categories, namely the active and the passive. The active type refers to that arises spontaneously from differential wear and differential deformation due to material inhomogeneity, such as at welds or due to dynamic forces at corrugation. In other words, the active type squats are the consequence of imperfect design or construction of tracks. In contrast, the passive type initiates from defects caused by external factors, for example, indentations related to alien objects and from rail burns from wheel slip. shows photos of indentations and the one in was caused by a hard ball from an aerosol paint can. More information about squats is referred to [Citation12,Citation14,Citation17,Citation18].
Figure 1. Various defects in rail head: (a) an indentation caused by a steel ball from an aerosol paint can, (b) an indentation by unknown object, and (c) a defect of unknown cause.
1.3. Motivation of the work
From the viewpoint of rail infrastructure management, it is safer and more economically efficient to take preventive maintenance actions against squats. According to the squat growth process postulated in [Citation14] and validated in [Citation12], a defect causes a dynamic force, which may result in plastic deformation and material hardening. Plastic deformation usually makes the contact geometry more conformal so that the stress will be reduced, and hardening will increase the yield stress as long as the tensile strength of the material is not yet reached. Consequently, the stress may be lower during subsequent wheel passages than the increased yield stress, and the material reaches a shakedown state, if the defect is not large/deep enough. The defect will, therefore, not grow into a squat; it may eventually disappear because of wear. In other words, for the passive type of squats, there should be a critical size; a squat can develop from an initial defect only if the defect is above the critical size.
Such a critical size has the following significance. First, it can be used as a criterion to distinguish light squats which will continuously grow from trivial defects which may eventually be erased by wear. Such a quantitative criterion is still lack, and, once ready, it can reduce false alarms and the resulted unnecessary maintenance. Second, it can be employed for automated detection and classification of light squats.
This paper presents a methodology for the determination of such a critical size, demonstrated with its application to typical operation conditions of the Dutch railway. The methodology may also be applied to RCF of other rolling contact pairs in general.
2. Numerical model
Since squats grow due to plastic deformation, the maximal von Mises stress are evaluated at rail top geometry defects of various sizes and compared with the yield stress of the material to assess the growth tendency of the defects. To that end a transient FE procedure is developed, in which the contact stress at the defects is solved for in the vehicle–track interaction system with wheel–rail frictional rolling contact being treated in three dimensions. The integration of detailed contact modelling in the vehicle–track system guarantees that the mutual influence of the vehicle–track structural dynamics and the wheel–rail contact is fully taken into account. This is important for high frequency dynamics, such as in the current case of wheel–rail contact at squats. The model has been employed for previous work on squats [Citation14,Citation17], its validity in solutions of frictional rolling contact in both elasticity and elasto-plasticity has been demonstrated in [Citation20,Citation21], and very recently it was employed to study the compression-shift-rolling evolution [Citation22].
The FE model is schematically given in . A half of a typical wheelset and a half straight track are modelled due to their symmetry. Vehicle primary suspension, rail pad, sleepers, and ballast are all taken into account. Comparing with the model in [Citation14], the sleepers are modelled using solid elements instead of mass elements. A right-handed Cartesian coordinate system is defined as shown in . Its origin is on the rail surface and at the symmetry centre of the rail profile. In the longitudinal (rolling) direction, the origin is at point a in , that is, the leading edge of defects simulated later, see below. The z axis is normal to the rail surface.
Figure 2. The FE vehicle–track interaction model. (a) 3D view and (b) longitudinal–vertical view.
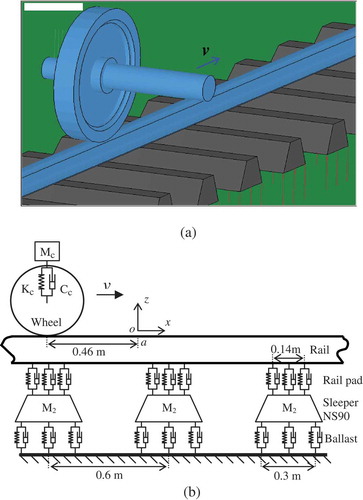
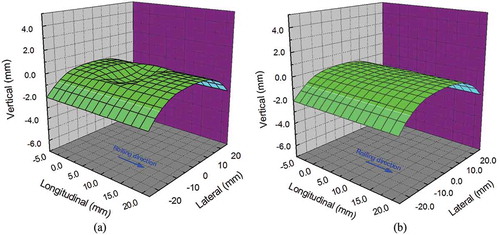
Figure 3. Rail top longitudinal–vertical profiles measured along the centre of rail head at two small defects. The measurement data point interval is 5 mm. The curves are not smoothed.
Figure 4. The shape and dimension of the generalized defects. (a) Profiles at the deepest longitudinal–vertical cross-section and (b) profiles at the deepest lateral–vertical cross-section.
Parameters of the model are listed in . To consider the worst case scenario, the static vertical contact force N is half of the wheel load increased by 30% (determined on the basis of multi-body dynamics results) to take into account the long wave dynamic force of the vehicle–track interaction. The sprung mass is lumped and supported by the primary suspension on the wheel. Elastic material is used for both the wheel and rail to calculate the maximal von Mises stress, so that it can be compared with the yield stress to assess the tendency of plastic deformation.
Table 1. The values of the parameters in the model.
Here we distinguish between coefficient of friction (COF) f and traction coefficient ,
where is the vertical contact force and
is the longitudinal friction force,
. No lateral force is considered. Because the contact force varies during rolling due to vibrations, the traction coefficients used in this paper are nominal values calculated with the static force.
3. Derivation of a critical size
The longitudinal–vertical rail profiles can be measured with the device RailProf at the centre of the rail profile. shows measurements of two light squats. The interval of the measurement data is 5 mm; the curves are therefore not very smooth.
3.1. Maximal v-M stress of defects with sharp edge
3.1.1. Defect models
A series of generalized defects with increasing size are applied to the rail head of the FE model to investigate their maximal v-M stress. The shape of the defects is generalized from the observations of many measurements at small defects and light squats, such as those shown in .
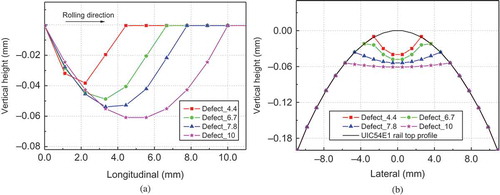
When an indentation is formed, its edge is usually sharp in the beginning. Defects with sharp edge are, therefore, first investigated. shows the longitudinal–vertical and lateral–vertical profiles of the simulated defects at their deepest cross-sections. Their appearance in three dimensions is given for Defect_10 in . The naming convention of the defects is such that Defect_4.4 represents a defect of 4.4 mm long in the rolling direction, see .
Figure 5. The 3D appearance of Defect_10 when it is applied to the rail head. (a) Defect with 10× magnification in vertical direction and (b) defect without magnification. Note in (a) the magnification is applied only to the defect, not to the rest of the rail top surface, the scale of the ordinate remains therefore unchanged.
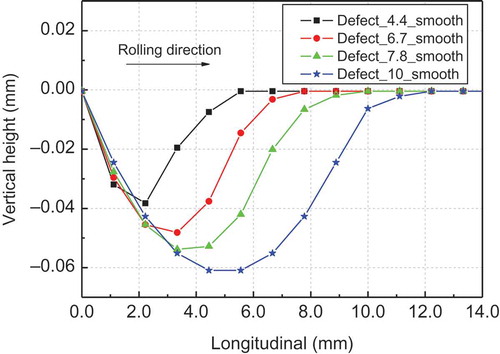
The profiles of the defects are kept as similar with each other as the FE meshing allows. Particularly, the shapes of the defects are kept the same at the trailing edges (i.e. the part of the defect which is the last to come into contact with the wheel, namely the edges on the right side in ). The depth of Defect_10 is first determined based on the fact that the dimension of a typical wheel–rail contact is in the order of 10 mm, and the corresponding typical compression of the rail is in the order of 0.05 mm. Because field observations show that wheels have usually no or very little contact with the bottom of small defects, see the black rusty bottom of the defects in , the depth of Defect_10 is therefore chosen to be 0.06 mm. The depth of the other defects is determined by keeping them geometrically similar to Defect_10.
The generalized defects are applied to the rail with abscissa 0.0 mm of being at the location a in , the origin of the coordinate system. This location is chosen because statistics [Citation14] showed that it is in this region of a sleeper span where most of squats occur, and because simulations show that the dynamic contact force is the highest there, if other conditions are the same.
3.1.2. Transient contact at defect
Still taking Defect_10 as an example, the pressure and surface shear stress distributions along the longitudinal axis of the contact patch are plotted for different instants (different time steps) in , from which the transition process of the contact patch at the defect can be observed. The instants are so chosen that the highest pressure and the highest shear stress are included. It is seen that peaks of both the pressure and the surface shear stress occur at the leading and trailing edges of the defect due to stress concentration. Comparing in the sharp peaks of the pressure at steps 642 and 654 when contact is at the defect’s edges, with the maximal pressure of step 665 when the wheel has passed the defect and is in contact completely with the smooth rail head, it is found that the stress concentration has significantly increased the maximal pressure. The same is true for the shear stress in , where the maximal values at the defect’s edges are at steps 651 and 663, while the result of the smooth contact is at step 667. As a result, the v-M stress at the defect is much higher than on the smooth surface.
Figure 6. The transition process along the longitudinal axis of the contact patch (y = 0) at Defect_10. (a) The pressure and (b) the surface shear stress.
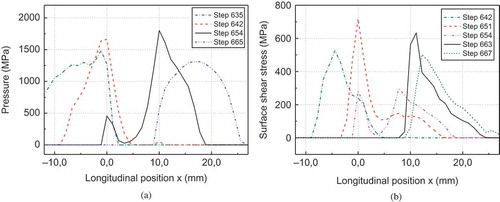
It is noted that in , the pressure and the shear stress are not given for the same time steps. The reason is that the pressure and the surface shear stress reach their respective maximums at different instants. To explain, rolling of two smooth bodies with elliptic contact patch is first looked at: when friction is not fully exploited the pressure and the surface shear stress usually reaches their maximums at different locations in the contact patch; the maximum pressure occurs always at the centre of the contact patch, whereas the maximum surface shear stress occurs at the border between the areas of adhesion and slip, see P1 and P2 in . In the presence of a defect, both the pressure and the shear stress reach their respective maximums at the defect’s edges. The highest pressure is at the trailing edge which suffers the impact, with the second highest pressure at the leading edge at x = 0 (), whereas the highest shear stress is at the leading edge (). Consequently, the instants of the highest pressure and the highest shear stress are different.
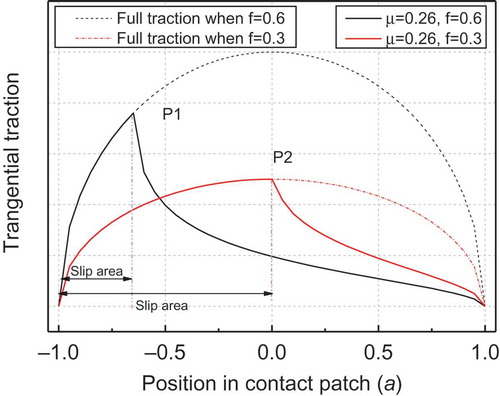
Figure 7. The tangential surface stress distribution in a contact patch under the same pressure when friction coefficient changes.
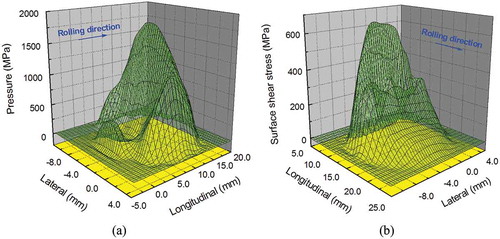
shows stress distributions when contact is at the trailing edge. As can be seen, the defect has greatly changed the pressure distribution from the ellipsoid shape that contact between smooth wheel and smooth rail should have to that of . Due to the dependency of the surface shear stress on the pressure, the shear stress distribution is also changed accordingly as shown in .
Figure 8. The 3D stress distribution at Defect_10. (a) The pressure distribution at step 654 and (b) the surface shear stress distribution at step 663.
shows that the largest shear stress is at the leading edge (x = 0.0), instead of being at the trailing one (x = 10.0), which is not necessarily true, and should be caused by the large time interval for outputting data for the plotting. Results at preselected instants were output for the plotting, because it is too costly to output results of every time step. Obviously, an output instant may not be precisely at the time of the maximum, but closely next to it. It is emphasized that this error is only for this plotting. For the analyses and for the determination of the critical size, the true calculated maximums are used.
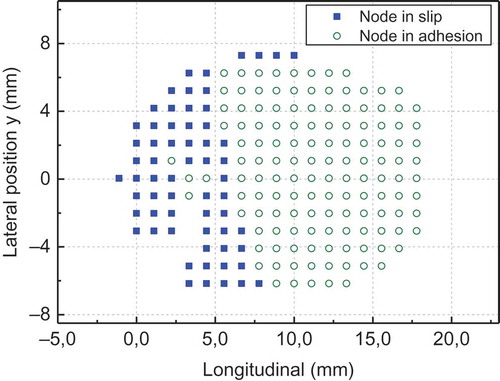
shows as an example the contact patch and its division into the areas of slip and adhesion at step 654. Compared to wheel–rail rolling contact without surface defect, the contact patch, and the areas of slip and adhesion are all changed by the presence of the defect. Although the defect is symmetric (see ), the contact patch is not symmetric about the y = 0 axis. This is owing to the rail inclination, which causes the rail to bend under the wheel load toward the gage side, so that the contact geometry is not symmetric any more. Detailed analysis of the transient rolling across the defect is beyond the scope of this paper.
Figure 9. The slip and adhesion areas at step 654.
3.1.3. v-M stress distribution along depth
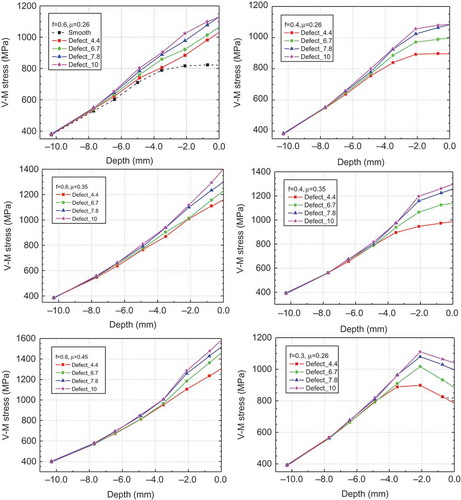
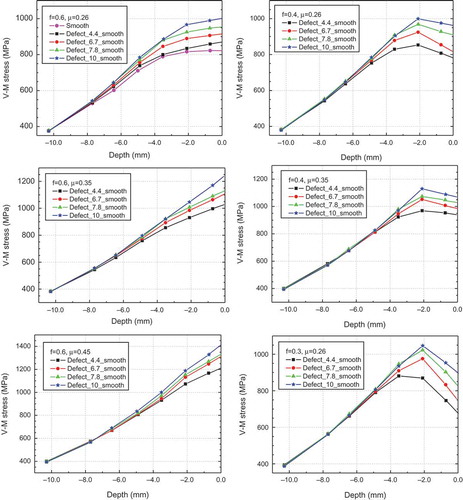
The maximal v-M stress on the surface and along the depth in the rail at the defects is shown in . Note that the maximal v-M stress shown at each depth in was found from all the v-M stress in the layer of material at that depth in the area of the trailing edge at all the time during the simulation. All the maximal v-M stress given in this paper was determined in this way. It guarantees that the true maximal is found. From the results it can be seen that with the increase in the defect size, the v-M stress increases, irrespective of the COF and the traction coefficient. For the rail material grade R260Mn, the tensile strength is 900 MPa. It can be seen in that for some of the cases the tensile strength of R260Mn is exceeded at the surface, while for some other not. This confirms the expectation that there should be a critical size below which the maximal v-M stress at the surface can be lower than the tensile strength, and shakedown may finally set in so that the defect cannot grow further. Here, the effect of plastic deformation on the reduction of the stress by making the contact geometry more conforming has not been taken into account. Here, it is also emphasized that it is the surface v-M stress which is used to compare with the material strength. This is because, on one hand, field observations have shown that the cracks initiate on the surface [Citation12], on the other hand, in the sub-surface the material behaviours differently due to the high hydrostatic pressure, and the material parameters for such condition are not yet available.
Figure 10. The Maximal v-M stress distributions along the depth in the rail at the defects with different COF (f) and traction coefficient (µ). Origin of the abscissa is at the rail top surface. The results for ‘smooth’ are obtained from the rail without defects.
3.2. Influence of COF and traction coefficient
Putting the results of Defect_6.7 with different f and µ in the same figure (), the influence of COF and traction coefficient on the v-M stress can be seen. shows that the stress level significantly increases with the rise of the traction level when the COF is kept constant. On the other hand, when the traction level keeps the same, the maximal stress on the rail surface also rises with the increase of the friction coefficient, whereas the stress in the subsurface changes conversely, as shown in . The cause of this phenomenon is explained as follows.
Figure 11. Influence of friction coefficient and traction coefficient on the maximal v-M stress for Defect_6.7. (a) The influence of traction coefficient and (b) the influence of friction coefficient.
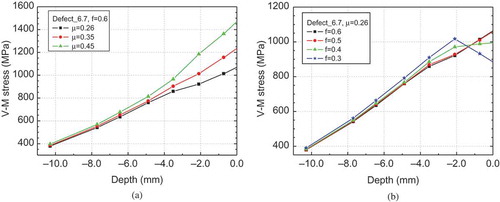
Assuming a constant traction coefficient of 0.26 and for the same pressure distribution, the tangential surface stress distribution in the contact patch is plotted in with two different friction coefficients. When the friction coefficient rises from 0.3 to 0.6, it is seen that the maximal tangential surface stress increases from P2 into P1. Correspondingly, the slip area also shrinks greatly. Because the surface v-M stress level is mainly determined by the tangential surface stress in the contact patch, the surface stress (at the depth of 0.0) in increases with the friction coefficient.
For the stress in the subsurface, the situation is different because the v-M stress is determined by both the normal pressure and the tangential surface stresses. The maximal pressure occurs always at the centre of the contact patch, while the location of the highest surface shear stress changes with COF f, that is, it shifts to the left handed side with increasing f (). Their combined effect changes the maximal v-M stress from increase with increasing f on the surface to decrease with increasing f when it is deep in the subsurface, for instance at the depth of -2 mm, see .
3.3. Influence of local curvature at the edge of defects
For the above analysis, the edges of the defects have been sharp, that is, with an infinite curvature (see ). This may be the case when an indentation is just formed. The edges will, however, be flattened by passing wheels. In order to find out the influence of the local curvature at the defects, the longitudinal profile of Defect_6.7 is adjusted at the trailing edge as shown in , named as Defect_6.7_tran. The lateral profile is kept the same as in .
Figure 12. The local curvature variation at the trailing edge of Defect_6.7.
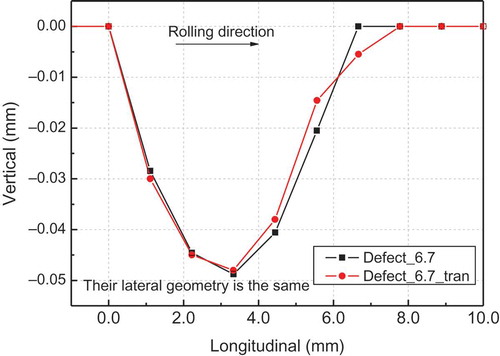
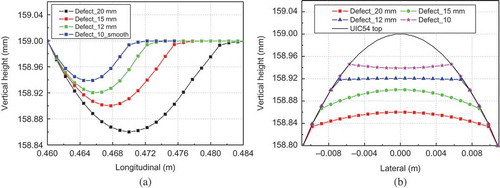
As expected, the influence of local curvature change on the total resultant contact forces is negligible. However, the surface v-M stress decreases significantly with the decrease in the local curvature, no matter what the friction coefficient is, as shown in . The influence of the local curvature decreases quickly with increasing depth into the rail and disappears gradually when the depth is over more than 3 mm.
Figure 13. The maximal stress along depth at different defects. Depth = 0.0 is at rail surface.
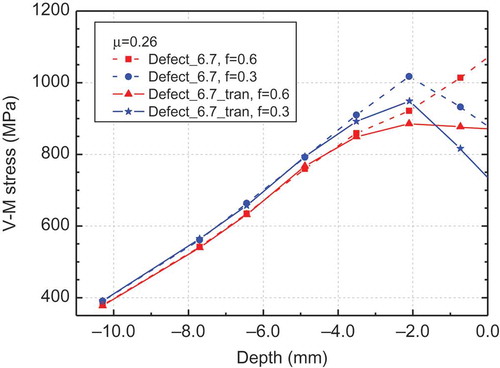
This is due to the stress concentration at the sharp edge. The higher is the local curvature, the more concentrated the stress is and the more plastic deformation would occur locally for the same load. The plastic deformation will make the contact geometry smoother and more conformal, as illustrated in with the change of the defect from Defect_6.7 to Defect_6.7_Tran. Consequently, the stress will be lower at the deformed defect for the same loading conditions (see ). If the load is not high enough, the material may shakedown and no further plastic deformation will occur, that is, the defect will not grow further.
3.4. Maximal v-M stress at smoothed defects
For the defect profiles shown in , most of the resulting surface v-M stress level is higher than the tensile strength of 900 MPa, see . Therefore, most of the defect profiles will be changed due to plastic deformation by wheel passages, becoming smoother and more conformal, as discussed in Section 3.3. Assuming that after some wheel passages the defects take the shapes shown in (designated as *_smooth), their v-M stress level is again calculated. In defining the shape of the defects, their local curvature is kept for the trailing edges as similar to each other as it is allowed by the FE meshing, as shown in . But the curvature cannot be identical due to the limited number of discrete nodal points of the FE model in the concerned area. The local curvature is chosen based on observations of measured longitudinal–vertical rail profiles at defects, see and for examples. The lateral profiles are kept the same as shown in .
Figure 14. The generalized profiles of defects in the longitudinal–vertical section, the trailing edges of which are assumed to be smoothed by plastic deformation due to wheel passages. The leading edges are the same as those of .
The maximum v-M stress on the surface and at different depth in the rail is shown in . It can be seen that for = 0.26 some of the maximal v-M stress already exceeds 900 MPa (the tensile strength of the R260Mn rail grade).
Figure 15. The Maximal v-M stress distribution at defects under different friction coefficient (f) and traction coefficient (). Origin of the abscissa is at the rail top surface.
Under normal operational conditions, the traction coefficient of most of the wheels will not be higher than 0.26 for the electrical multiple units in the Netherlands. For instance, the design value of the maximal traction coefficient is 0.22 for the mainstream VIRM train sets, whereas the adhesion coefficient for braking is usually smaller than for traction. Hence, the results with the traction coefficient of 0.26 are employed for further analysis on defect growth, taking the worst scenario into account.
In , the maximal v-M stress is listed for all the simulated defects with µ = 0.26, with sharp or smoothed trailing edge and different COF. For the smoothed cases, the maximal v-M stress, which is close to the material strength of 900 MPa, is given in bold letters. The maximal COF available in steel-on-steel wheel–rail contact under dry friction is widely accepted as being 0.6. In reality, such a high value is usually rare [Citation23]. From this we may conclude that 6.7 mm is the lower bound of the critical size, and 7.8 mm is the upper bound for a defect to grow into a squat, that is, when a defect is shorter in the rolling direction than 6.7 mm, its chance to grow into a light squat is very small, while if it is longer than 7.8 mm, the chance is high.
Table 2. The maximal surface v-M stress (unit: GPa) µ = 0.26.
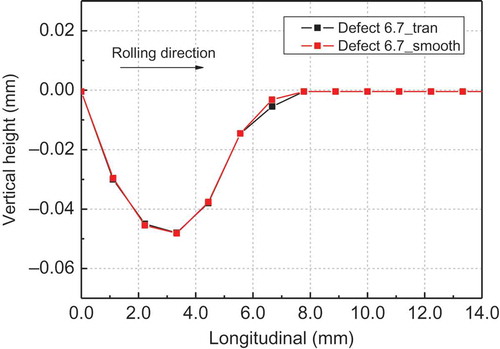
As it is mentioned above, the defect profiles were assumed based on observations of measured defect profiles. In , two profiles used above, Defect_6.7_Tran (see ) and Defect_6.7_Smooth (see ), are put together. The corresponding maximal surface v-M stress is listed in . The small difference in the profiles causes some small differences in the stress. In reality, the profiles of the defects and squats vary largely and change continuously due to wear and plastic deformation. The generalize profile is only a representative of their average.
Table 3. Influence of different smoothed profiles (= 0.26, unit: GPa).
Figure 16. Comparison of two smoothed defect profiles.
Not only diversities in the COF and in the defect profile, there are also other unpredictable factors in the vehicle–track interactions system, like irregularities in the track, variations in speed, in the thickness of rail head and wheel tire, etc. In view of these and for easy practical use, we may round the lower bound of 6.7 mm of the critical size off downwards to 6 mm, and the upper limit 7.8 mm upper wards to 8 mm, and conclude that a defect less than 6 mm long has little chance to grow, while a defect longer than 8 mm will almost certain to grow into a squat. Since large defects will cause large contact stress, see and , it can be expected that larger defects will grow faster (see statistics in [Citation18]).
Comparing lateral size of each defect shown in with its counterpart in the rolling direction (), they are approximately equal to each other. This was designed to reflect the observations: the longitudinal and lateral dimensions of a matured squat are usually similar, except when the squat is severe so that it is much extended in the longitudinal direction. This means that we can generalize the derived critical size to both the longitudinal and lateral directions, namely when a defect is smaller than 6 mm in both directions, its chance to grow into a squat is very small, and when it is larger than 8 mm and in the middle of the running band, the chance is large.
4. Validity of the critical size
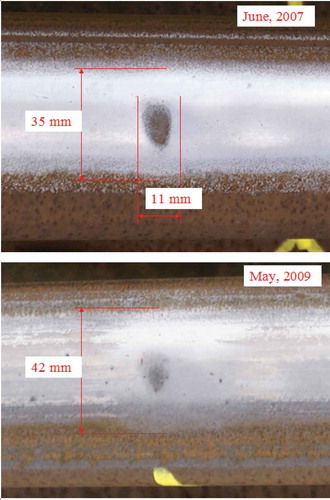
Field monitoring confirmed that the numerically derived critical size is valid. shows that two rail defects of 5 and 6 mm long in the rolling direction disappeared due to wear, and a defect of 10 mm grew into a moderate squat with the typical V form. shows the growth of another defect, possibly caused by indentation, of about 11 mm in its initial length in the rolling direction. The evidence of its growth can best be seen in the widening of the running band at the defect: in June 2007, it was about 35 mm, and in May 2009, it became 42 mm, while elsewhere the width of the running band remained more or less the same. Running band widening is a major characteristic of squats [Citation24–Citation26]. According to the squat growth process postulated in [Citation14] and validated in [Citation12], the defect of will grow into a squat.
Figure 17. Validation of the critical size. (a) Two defects of 5 and 6 mm were erased by wear, and (b) a defect of 10 mm had grown into a moderate squat with the typical V form.
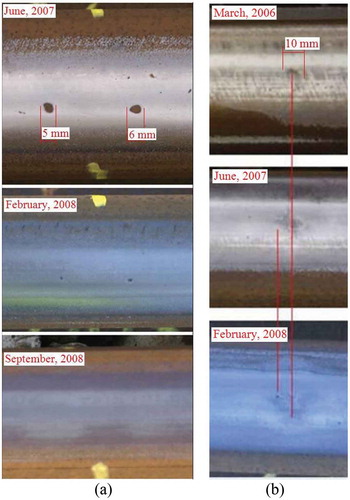
Figure 18. Validation of the critical size. A defect of original length 11 mm or so grew.
It may be worth noting that for safety reason the monitoring was carried out on a track section with only three MGT traffic a year. It is because of the light traffic and the small size, the defects in and grew slowly over time.
5. Situation under lower friction exploitation levels
As mentioned before, the traction coefficient of 0.26 corresponding to the worst scenario is considered above to derive the critical size. However, such worst case may not occur in many locations. For completeness, this section extends the above-shown analyses to include the cases with lower friction exploitation levels. The traction coefficients of 0.1 and 0.2 are separately studied as two representative cases by further simulating more defects shown in . The trailing edges of the defects are also kept the same in geometry (see ) for comparison.
Figure 19. The shape and dimension of the generalized defects. (a) Profiles at the deepest longitudinal–vertical cross-section and (b) profiles at the deepest lateral–vertical cross-section.
The obtained maximal surface v-M stresses at the different defects, which all occur in the vicinity of trailing edges, are listed in . With the same way of analysis on , a critical size can be derived from for the traction coefficient of 0.2, being about 12–15 mm. Such a value is clearly larger than the above derived one of the worst case scenario. For cases with the traction coefficient of 0.1, however, such a critical size seems not to exist, because the maximal surface v-M stress is far below the tensile strength of the rail steel for all the simulated defects. In other words, a defect will most likely not grow through surface yielding when the traction coefficient is sufficiently low.
Table 4. The maximal surface v-M stress (MPa).
6. Discussions
A methodology for the determination of a critical size of surface defects, above which RCF can initiate, has been developed. With its application to typical Dutch railway loading conditions, a critical size for squats to initiate and grow from small defects are derived. The generalized defects represent typical indentations and wheel burns, which are observed to be important initiation sources of squats. Note that such an approach is only applicable to the passive type of squats.
The parameters considered in this work are the longitudinal and lateral dimensions of defects, the COF and the traction coefficient. The tensile strength of material is used as the limiting parameter, which is typically applicable to low cycle RCF. This implies that if the strength is enhanced, the critical size can be increased. Track parameters have not been varied, though severe squats often cause local track deterioration. This is because the critical size is intended for squat initiation from small rail surface defects, which do cause significant deterioration of track due to their low dynamic forces.
For high frequency wheel–rail interactions at defects, such as squats, not only the unsprung mass is important, but also its distribution. The unsprung mass and its distribution, namely those of the wheelset and the rail, together with the traffic speed and other vehicle and track parameters used in this paper are typical of the Dutch operational conditions. For other railway the conditions may be somewhat different.
As described in Section 5, the critical size increases significantly with the decrease of traction coefficient, and becomes non-existent for a traction coefficient of 0.1. Here, it should be emphasized that such a conclusion does not mean that a large defect cannot cause problems in cases dominated by low friction exploitation levels, but not lead to a problem through surface yielding (or surface-initiated RCF). In reality, large defects can actually cause severe or even catastrophic problems through other failure mechanisms.
As mentioned in the introduction, this work focuses itself on the squat type of rail RCF. However, the approach of investigation introduced may be extended to other types of RCF, such as the ones in bearings and gears with necessary modifications and improvements. Due to the great difference between RCF in different industries, it can be expected that the 3D transient FE model should be adapted in many aspects during extension.
7. Conclusions
An FE model of the vehicle–track interaction is integrated in this paper with detailed modelling of frictional rolling contact to derive a critical size, above which a rail top defect may grow into a squat. It is found that when a defect is smaller than 6 mm in both the rolling and lateral directions, its chance to grow into a squat is very small, and when it is larger than 8 mm and in the middle of running band, the chance is large. This result has been validated by field monitoring.
The critical size can be used as a criterion for visual inspection to distinguish between light squats and other trivial defects, and consequently for maintenance actions, such as rail grinding. It may also be used for automatic image recognition of light squats.
The critical size has been determined for the typical Dutch railway operational conditions, but the developed methodology is generally applicable to other railways and other industries with rolling contact pairs, such as bearing and gears if necessary modifications and improvements are applied.
Disclosure statement
No potential conflict of interest was reported by the authors.
References
- Ai X, Moyer CA. Rolling element bearings. In: Bhushan B, editors. Modern tribology handbook. Boca Raton: CRC press LLC; 2001.
- Cannon DF, Edel KO, Grassie SL, et al. Rail defects: an overview. Fatigue Fract Engng Master Struct. 2003;26:865–887. doi:10.1046/j.1460-2695.2003.00693.x.
- Coulon S, Ville F, Lubrecht AA. Effect of a dent on the pressure distribution in dry point contacts. J Tribol. 2002;124(1):220–223. doi:10.1115/1.1396345.
- Zhou RS, Cheng HS, Mura T. Micropitting in rolling and sliding contact under mixed lubrication. J Tribol. 1989;111(4):605–613. doi:10.1115/1.3261984.
- Olver AV. The mechanism of rolling contact fatigue: an update. Proc IMechE, Part J: J Eng Tribol. 2005;219:313–330. doi:10.1243/135065005X9808.
- Spikes HA, Olver AV, Macpherson PB. Wear in rolling contacts. Wear. 1986;112:121–144. doi:10.1016/0043-1648(86)90236-X.
- Schweitzer PA. Metallic material. New York (NY): CRC press; 2003.
- Shackelford JF, Alexander W. Materials science and engineering handbook. New York (NY): CRC press; 2001.
- Esveld C. Modern railway track. 2nd ed. Zaltbommel: MRT Productions; 2001.
- Ai X, Nixon HP. Fatigue life reduction of roller bearings due to debris denting: part I — theoretical modeling. Tribol Trans. 2000;43(2):197–204. doi:10.1080/10402000008982329.
- Labiau A, Ville F, Sainsot P, et al. Effect of sinusoidal surface roughness under starved conditions on rolling contact fatigue. Proc IMechE, Part J: J Eng Tribol. 2008;222(3):193–200. doi:10.1243/13506501JET326.
- Li Z, Dollevoet R, Molodova M, et al. Squat growth—some observations and the validation of numerical predictions. Wear. 2011;271(1–2):148–157. doi:10.1016/j.wear.2010.10.051.
- Cheng HS. Gears. In: Bhushan B, editors. Modern tribology handbook. Boca Raton: CRC press LLC; 2001.
- Li Z, Zhao X, Esveld C, et al. An investigation into the causes of squats: correlation analysis and numerical modeling. Wear. 2008;265(9–10):1349–1355. doi:10.1016/j.wear.2008.02.037.
- Clayton P, Allery MBP, Bolton PJ. Surface damage phenomena in rails. In: Kalousek J, Dukkipati RV, Gladwell GML, Editors. Proceedings of the conference on contact mechanics and wear of rail/wheel systems. Vancouver (Canada); Jul 6–9 1982. p. 419–443. University of Waterloo Press.
- Bogdanski S, Lewicki R. 3D model of entrapped liquid in rolling contact fatigue cracks in rails. Wear. 2008;265(9–10):1356–1362. doi:10.1016/j.wear.2008.03.014.
- Li Z, Zhao X, Dollevoet R, et al. Differential wear and plastic deformation as causes of squat at track local stiffness change combined with other track short defects. Vehicle Syst Dyn. 2008;46(sup1):237–246. doi:10.1080/00423110801935855.
- Li Z, Molodova M, Zhao X, et al. Squat treatment by way of minimum action based on early detection to reduce life cycle costs. In: Proceedings of the ASME joint rail conference 2010(JRC2010). Urbana (IL); Apr 27–29 2010.
- Molodova M, Li Z, Dollevoet R. Axle box acceleration: measurement and simulation for detection of short track defects. Wear. 2011;271(1–2):349–356. doi:10.1016/j.wear.2010.10.003.
- Zhao X, Li Z. The solution of frictional wheel-rail rolling contact with a 3-D transient finite element model: validation and error analysis. Wear. 2011;271(1–2):444–452. doi:10.1016/j.wear.2010.10.007.
- Zhao X, Li Z. A 3-D finite element solution of frictional wheel–rail rolling contact in elasto-plasticity. J Eng Tribol. 2015;229(1):86–100.
- Wei Z, Li Z, Qian Z, et al. 3D FE modelling and validation of frictional contact with partial slip in compression–shift–rolling evolution. Int J Rail Trans. 2016;4(1):20–36. doi:10.1080/23248378.2015.1094753.
- Li Z, Arias-Cuevas O, Lewis R, et al. Rolling–sliding laboratory tests of friction modifiers in leaf contaminated wheel–rail contacts. Tribol Lett. 2009;33(2):97–109. doi:10.1007/s11249-008-9393-3.
- UIC Code 712. Rail defects. 4th ed. International Union of Railways, Jan 2002.
- Rail Damages. The blue book of RailTrack. UK; Feb 2001.
- Classification of Squats explained with examples (version 2). Squat handout. ProRail; Mar 2004 (in Dutch).