
 ?Mathematical formulae have been encoded as MathML and are displayed in this HTML version using MathJax in order to improve their display. Uncheck the box to turn MathJax off. This feature requires Javascript. Click on a formula to zoom.
Abstract
Growing research attention is focusing on Automated Vehicle (AV) technologies, promising significant safety benefits. An in-depth understanding of human driving will play an important role in determining the most acceptable AV behaviour, supporting passenger comfort and thus the adoption of the technology, but also the optimal prediction of the behaviour of the surrounding traffic. The current study examined 1740 real-world motorway pull-out manoeuvres (pull-out distance, speed differential with the leading vehicle, manoeuvre duration, pull-out comfort zone) under different conditions. The results highlighted the significant impact of the surrounding traffic and the driving characteristics on or before the manoeuvre initiation point, which reflected the overtaking strategy selected. The findings can inform the design of automated overtaking systems that resemble human driving and thus encourage their uptake; in addition, they can assist the intention prediction for lane keeping assistance systems in order to optimise the system’s response to cutting in and pull-out manoeuvres.
1. Introduction
Growing research findings support the safety benefits of Automated Vehicle (AV) technologies, estimating a 50% crash and injury reduction at an early 10% market penetration rate (Fagnant and Kockelman Citation2015). Especially in motorway environments, their application is widely advocated for, considering their low complexity (Schoenmakers, Yang, and Farah Citation2021). Their estimated benefits include not only a significant reduction of driver-related crashes, but also improvement of traffic operations by keeping shorter gaps and forming coordinated platoons (Fagnant and Kockelman Citation2015).
Nonetheless, especially in mixed traffic conditions, overtaking slower-moving vehicles will remain an essential driving task. Therefore, broad research is focusing on automated overtaking trajectory planning and tracking that takes into consideration numerous factors, including the states of the subject and lead vehicle, limits imposed by the environment, vehicle constraints, safety and comfort (Dixit et al. Citation2018). Passenger comfort is receiving a growing research interest, since it will encourage the uptake of AVs and driving assistance systems and thus enable them to reach their estimated safety benefits.
Several overtaking algorithms aimed to identify comfortable optimal trajectories, taking into consideration values of lateral and longitudinal acceleration, speed and jerk (e.g. Ballesteros-Tolosana et al. Citation2017; Lattarulo, Heß, and Pérez Citation2018). These passenger aware constraints can significantly improve comfort and thus passenger experience, but mainly address comfort as perceived by the human vestibular system (Bellem et al. Citation2016). Facets of psychological comfort, including the feeling of naturalness (familiarity with the manoeuvres experienced) (Elbanhawi, Simic, and Jazar Citation2015; Hartwich, Beggiato, and Krems Citation2018) are expected to have an important influence. Oliveira et al. (Citation2019) investigated differences in reported trust between a human and a machine-like automated driving style when approaching a road junction. Despite the absence of significant differences between the ratings, qualitative findings suggested that a human-like driving style inspired more confidence to the participants. In their investigation of trust in automated driving systems, Abe, Sato, and Itoh (Citation2018), compared participants’ rating for different overtaking styles. While users preferred longer lateral distances and earlier manoeuvre start times compared to manual driving, overall trust ratings were higher for a style that reflected their own characteristics. These findings suggest the benefit of an automated driving style that resembles human driving. Consequently, an in-depth understanding of real-world overtaking behaviour is required in order for the system to effectively imitate human trajectories.
On another level, Automated Lane Keeping Systems (ALKS) will be required to anticipate and adjust to cutting in manoeuvres performed by neighbouring vehicles (UN Citation2021) in order to avoid collisions, adding to the safety benefits of predicting human overtaking behaviour.
Literature has proposed different ways of separating the phases of overtaking, usually including 3 steps (e.g. Naranjo et al. Citation2008), two-lane changes and a path tracking component, describing the basic different dynamic states of the overtaking vehicle. Hegeman, Brookhuis, and Hoogendoorn (Citation2005) added the decision and preparation steps, while Bärgman et al. (Citation2017) separated overtaking into 6 phases, breaking each lane change into an initiating and an ending segment. On the other hand, overtaking drivers in divided roads do not consistently return to the initial lane; in their survey between Dutch drivers, Knoop et al. (Citation2018) showed that under certain driving situations up to 42% of the participants would not return to the right lane after passing a slower moving vehicle. Similarly, Chandra and Shukla (Citation2012), in their observation of overtaking in divided highways, reported that after passing, drivers either returned to the initial lane or continued travelling on the adjacent lane. Consequently, overtaking can be considered a type of discretionary lane change, i.e. a lane change performed to improve travelling conditions (Toledo, Koutsopoulos, and Ben-akiva Citation2003), followed by the passing phase and a second, optional, lane change. Therefore, the focus of the current study will be the pull-out phase of the manoeuvre, which is an essential step of motorway overtaking.
According to Matson and Forbes (Citation1938), the main overtaking strategies are: (i) normal/accelerative (the driver approaches the leading vehicle, decelerates and follows for some time before passing), (ii) flying (the driver overtakes while maintaining a constant speed) and (iii) piggybacking (the driver follows another overtaking vehicle; piggybacking can be either accelerative or flying).
However, the dynamic driving environment makes every overtaking manoeuvre unique (Dixit et al. Citation2018); therefore, literature has recognised the value of investigating the impact of different parameters on overtaking and lane changing. Numerous studies focused on lane change decision modelling (e.g. Balal, Cheu, and Sarkodie-Gyan Citation2016; Li et al. Citation2021; Toledo, Choudhury, and Ben-Akiva Citation2005), as well as gap acceptance models (e.g. Farah et al. Citation2009, Citation2007; Toledo and Farah Citation2011) aiming to predict and imitate the decision-making processes in human driving. Nonetheless, the interactions with the overtaken vehicle during the decision-making process have received less attention. Gray and Regan (Citation2005) found that in the absence of oncoming traffic, drivers in 2-lane rural roads decided whether it is safe to overtake based on a critical distance and/or a critical time headway with the overtaken vehicle, often depending on their speed. In addition, variables related to the leading vehicle (distance and speed) have been found to remain significant throughout the dynamic decision making of a lane change, in contrast with other surrounding information that tend to be ignored when approaching the initiation point (Li et al. Citation2021). In the context of powered two-wheelers (PTW), Barmpounakis, Vlahogianni, and Golias (Citation2017) found that the speed differential between the PTW and the preceding vehicle was the most influential variable during overtaking decision making.
Following the above, the distance headway and speed differential with the leading vehicle are valuable descriptors of the overtaking decision making. A number of studies have reported the range of distance headways, mainly in the USA (e.g. Toledo and Zohar Citation2007; Balal et al. Citation2014), while the initial overtaking distance has been found to be affected by traffic density, as well as the direction of the manoeuvre (Yang et al. Citation2018). However, a detailed analysis of the values of pull-out distance (i.e. the distance headway at the manoeuvre initiation point) and the parameters that affect it is limited. Similarly, although speed differential has been found to affect target lane decision (Toledo, Koutsopoulos, and Ben-akiva Citation2003), as well as gap acceptance (Yang, Wang, and Quddus Citation2019), research on the factors that influence it is scarce. While it appears that there is not a speed differential threshold at which drivers overtake (Bar-Gera and Shinar Citation2005), its range is likely to vary depending on traffic conditions.
An essential descriptor of the pull-out phase is also lane change duration, outlining the length of the manoeuvre execution. Duration is an important parameter, impacting the overall behaviour during the lane change; for instance, drivers adjust their acceleration based on their expectations of the required duration (Yang, Wang, and Quddus Citation2019). In the context of automated driving, both pull-out distance and duration have been found to significantly affect perceived safety when overtaking a slower moving vehicle (Sourelli, Welsh, and Thomas Citation2021). Traffic characteristics and vehicle kinematics, including average speed, the gap in the adjacent lane, traffic density and speed differential (Ali et al. Citation2020; Farah Citation2013; Toledo and Zohar Citation2007; Vlahogianni Citation2013), have been found to significantly affect manoeuvre duration.
However, the majority of the models of overtaking/lane change duration have been based on driving simulator data (e.g. Ali et al. Citation2020; Farah Citation2013; Vlahogianni Citation2013). Using real-world manoeuvres, Toledo and Zohar (Citation2007) and Venthuruthiyil and Chunchu (Citation2021) modelled lane change duration using the NGSIM data. Their findings highlighted the impact of the surrounding traffic as well as the direction of the lane change and manoeuvre type (interrupted/ uninterrupted). Yang, Wang, and Quddus (Citation2019) examined lane change duration using data collected in the Shanghai Naturalistic Driving Study; their findings emphasised the effect of relative speed and roadway type. Nevertheless, models of motorway overtaking duration based on naturalistic data are limited, while the differences in lane discipline between countries suggest the benefit of examining a wider range of datasets.
It is, therefore, crucial to detect the range of variation of overtaking characteristics in human driving, as well as the impact of driving conditions on them. Nonetheless, lane change parameters are not independent to each other and should be examined not only individually but as systems of relationships. Consequently, the examination of constructs that consider manoeuvre characteristics concurrently is crucial.
In driving, a comfort zone is defined as the sum of actions that according to the driver’s perception are possible without experiencing discomfort (Ljung Aust and Engström, Citation2011) and is a dynamic function, which boundaries highly rely on vehicle kinematics as well as the environment conditions (Bärgman, Smith, and Werneke Citation2015). Studies have utilised different parameters to quantify comfort zones, based on the respective driving context; post-encroachment time and lateral acceleration have been used in turning scenarios (Bärgman, Smith, and Werneke Citation2015), while distance measures have been utilised when passing cyclists (Dozza et al. Citation2016; Kovaceva et al. Citation2019).
Building upon the definition of Bärgman, Smith, and Werneke (Citation2015), the pull-out comfort zone is here defined as the envelope of spatiotemporal characteristics, with regards to the leading vehicle, under which the driver is comfortable to initiate an overtaking. Following the impact of pull-out distance and relative speed on passing decisions, their parallel investigation can outline the pull-out comfort zone, as well as its variability depending on the driving conditions.
Following the above, the aim of this study is to explore the pull-out phase of overtaking, to unravel how drivers adjust their behaviour in response to traffic conditions and thus obtain insights on automated manoeuvring preferences. Specifically, the focus is on parameters related with the leading vehicle that influence lane change decision making and execution, the pull-out distance, speed differential, manoeuvre duration and pull-out comfort zone. The parameters that affect the pull-out comfort zone will form the theoretical framework of overtaking preferences. The manoeuvring behaviour under different conditions will also be investigated in detail. The findings can inform passenger aware overtaking systems, as well as lane keeping systems by optimising intention prediction for collision avoidance.
2. Materials and methods
2.1. Data
To acquire real-world information on motorway overtaking, the highD dataset (Krajewski et al. Citation2018) was used. highD data were extracted from drone video recordings from 6 locations around Cologne (Germany) between 2017 and 2018 and include post-processed trajectories of 110,000 cars and trucks (right-hand driving). Specifically, 60 recordings of around 17 min were performed and each road segment was around 420 m long, while each vehicle was recorded 13.6 s on average.
The data collection was performed in order to ensure naturalistic driving behaviour, data privacy protection and an adequate description of the scenarios’ static and dynamic attributes (Krajewski et al. Citation2018). The resolution of the recordings was 4096 × 2160; the drone recorded on sunny days with clear weather, to ensure a high video quality.
The recorded and algorithm-generated variables include the vehicles’ coordinates, vehicle kinematics (lateral and longitudinal speed and acceleration, distance and time headway, Time To Collision), as well as information on the surrounding vehicles and lane ID. All measures are recorded at a framerate of 25 Hz.
2.2. Data pre-processing
An initial observation of the data showed that for the cases of full overtaking manoeuvres (including a returning phase) the full lane change execution could not be captured, due to the length of the recorded road segment. Consequently, vehicles that changed only one lane during the recording period were sampled (12,723 cases). In order to select vehicles with an intention to overtake, only lane changes to the left with a preceding vehicle present during the initiation of the manoeuvre were selected. In addition, since the scope of this research focuses on passenger cars, overtaking trucks were removed from the sample.
A number of lane changes seemed to appear during heavily congested traffic; in these cases, the preceding vehicle was stationary/moving in a very slow speed. To avoid conditions with completely restricted flow, all lane changes with a speed lower than 4.5 m/s (10 mph) were removed from the sample. This threshold has been used previously when analysing lane changes derived from naturalistic data (Chen, Kusano, and Gabler Citation2015), in order to classify the manoeuvres as valid. Cases with TTC < 0.8 s were also removed from the sample, since these values are rare (Kruber et al. Citation2019) and could indicate errors during the data collection.
To identify the lane change segments of the trajectories, a threshold of lateral velocity was applied; following the findings of Mahajan, Katrakazas, and Antoniou (Citation2020) and Nie et al. (Citation2016), values between [−0.2, 0.2] m/s were labelled as lane keeping, while higher absolute values were considered lane changes. To validate the determination of the initiation point of the manoeuvre, it was examined whether the timeframe when the lateral velocity reached the threshold coincided with a local maximum or minimum, i.e. direction change, in the graph of the lateral coordinate y. Specifically, the local peaks and valleys within the sample were identified using the functions findPeaks and findValleys from the R package quantmod (Ryan and Ulrich Citation2020). If the timeframe of the manoeuvre initiation did not coincide with a local minimum or maximum within 5 timeframes (0.2 s) the case was manually checked.
In order to account for the differences between overtaking strategies, the standard deviation of the longitudinal speed and acceleration at the moment right before the manoeuvre initiation were used. The choice of a strategy has been usually treated as a discrete choice, with a constant speed denoting a flying overtaking (e.g. Hegeman Citation2008), or by using a minimum speed threshold (Farah et al., Citation2019). In the current study, low values of the two selected indicators define a flying manoeuvre, while higher an accelerative. The aim is to depict the variability of human driving, which is more likely to involve an almost constant speed rather than a completely steady value, without selecting a predetermined threshold.
To pinpoint the time period during which the indicators are more influential to the examined overtaking characteristics, Kendall correlations were calculated between the pull-out distance, speed differential and manoeuvre duration and the two indicators, calculated for 10, 25 and 50 timeframes prior the manoeuvre initiation point (corresponding to 0.4, 1 and 2 s respectively). For the standard deviation of longitudinal acceleration, the strongest correlations were observed for 10 and 25 timeframes, for both the pull-out distance ( = −11.47, p < .001,
= −11.753, p < .001,
= −10.745, p < .001) and the speed differential (
= −10.907, p < .001,
= −10.655, p < .001,
= −9.468, p < .001). For the standard deviation of longitudinal speed, the strongest correlations were observed for 10 timeframes, for both the pull-out distance (
= −4.628, p < .001,
= −4.064, p < .001,
= −3.235, p < .001) and the speed differential (
= −4.682, p < .001,
= −2.678, p = .007,
= −1.253, p = .02). It should be noted that these correlations were calculated for a subsample of 1297 lane changes that included at least 50 frames recorded prior the manoeuvre initiation. Following these results and the sampling procedure described above, the values were calculated for the 10 timeframes before the initiation point, resulting to the final sample of 1740 lane changes.
Kruber et al. (Citation2019) analysed microscopic and macroscopic characteristics of the highD dataset, including the traffic density. They calculated the density per lane for each direction of the 60 recordings, identifying a significant drop of velocity for values higher than 40 vehicles/km. Based on their findings, the traffic density for each lane change was labelled as High/Low, for values higher and lower than this threshold value respectively.
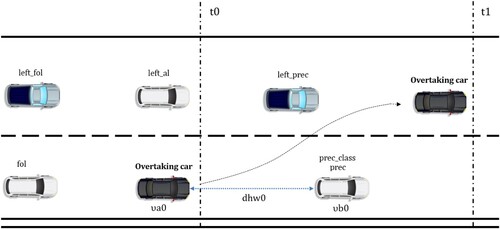
Figure displays the examined parameters (pull-out distance, speed differential, manoeuvre duration), as well as variables referring to the traffic surroundings. Specifically, the latter parameters refer to the presence/absence of surrounding vehicles at the manoeuvre initiation point (t0). Vehicles coded as fol and prec refer to the following and preceding vehicles in the initial lane respectively. The codes left_fol, left_al and left_prec refer to the vehicles in the destination (left) lane, following, alongside and preceding respectively. Finally, the variable prec_class refers to the type of the preceding (overtaken) vehicle (car or truck).
Figure 1. Diagram of the examined parameters; variables are measured at the manoeuvre initiation point (t0), dhw0 refers to the pull-out distance, while the speed differential is υa0–υb0. The manoeuvre duration is t1–t0. Variables referring to the surrounding traffic at t0 are also presented.
2.3. Statistical analysis
To investigate the drivers’ comfort zone during a pull-out manoeuvre, a Structural Equation Modelling (SEM) approach was followed. SEM methods have been previously used to examine complex constructs in manoeuvring behaviour. Barmpounakis, Vlahogianni, and Golias (Citation2016a) investigated lane change parameters as systems of relationships to capture the manoeuvrability of powered two-wheelers (PTW) using spatial indicators, accounting for road user interactions that cannot be directly observed. Also in the context of PTWs, Barmpounakis, Vlahogianni, and Golias (Citation2016b) used the latent variable ‘Comfort at Overtake' in order to quantify the driver’s gain during the manoeuvre. Li et al. (Citation2018) explored the interrelationships between the overtaking risk anticipation of lane changing and car following vehicles, as defined by vehicle kinematics.
SEM allows for latent variables to be examined as dependent variables, which cannot be achieved with traditional regression analysis (Washington, Karlaftis, and Mannering Citation2003). A SEM comprises of a measurement and a structural model; the measurement model identifies the impact of measured exogenous variables (indicators) on the latent variables, while the structural model is concerned with the relationships between the variables (latent variables as well as exogenous predictors).
The measurement model can be defined as:
where
, intercept vector;
, vector of observed indicators;
, matrix of factor loadings or regression coefficients;
, vector of latent variables;
, unique factor of yi.
The structural model can be defined as:
where
, vector of latent endogenous variables;
, vector of intercept terms; B, matrix of coefficients giving the expected effects of the latent endogenous variables (η) on each other;
, the vector of latent exogenous variables;
, the coefficient matrix giving the expected effects of the latent exogenous variables (ξ) on the latent endogenous variables (η);
, the vector of disturbances.
Multivariate normality of the independent variables and variables measured on the interval or ratio scale are among the ideal conditions for SEM (Washington, Karlaftis, and Mannering Citation2003). However, the selection of an appropriate estimator allows for the modelling of non-normal and/or categorical data. Normal theory Maximum Likelihood (ML) is among the most widely used, and while it is fairly robust against violations of normality (Golob Citation2003), its use with ordinal data can often increase type I error rate and lead to less efficient parameter estimates (Nussbeck, Eid, and Lischetzke Citation2006; Schermelleh-Engel, Moosbrugger, and Müller Citation2003). Weighted Least Squares (WLS) was developed to address these issues, however, very large samples are required in order to acquire valid results (Nussbeck, Eid, and Lischetzke Citation2006; Washington, Karlaftis, and Mannering Citation2003). Robust WLS methods include the WLS mean and variance adjusted x2 test of model fit (WLSMV estimator), as well as the Diagonally Weighted Least Squares (DWLS), both reported to show good statistical properties even with relatively small samples (Nussbeck, Eid, and Lischetzke Citation2006).
The SEM analysis was conducted in R (R Core Team, Citation2019), using the packages lavaan (Rosseel Citation2012) and semPlot (Epskamp Citation2019). To accommodate for non-normal and categorical data, the WLSMV estimator was used, which uses DWLS to estimate the model parameters, providing also robust standard errors and a mean- and variance-adjusted test statistic (Rosseel Citation2021). Since latent variables do not have a natural scale, to achieve model’s convergence, 1 indicator for each latent variable was constrained to value 1.
Linear regression models were developed in order to investigate the relationships between overtaking characteristics and the traffic context. Logarithmic transformation was applied for the models of pull-out distance and manoeuvre duration, to ensure that the predicted values would be non-negative (Toledo and Zohar Citation2007). Lognormal distribution has been found to be the best fit among gap parameters in discretionary lane changes (Balal et al. Citation2014), supporting the above choice.
The model selection was based on the Akaike Information Criterion (AIC) of the models considered. The final models were compared to mixed-effects models, introducing the recording site and day as a random parameter, to assess potential effects. The mixed-effects models did not appear to explain a higher variance nor contribute to a higher quality of the results, based on the and the Akaike Information Criterion (AIC); consequently, the linear regression models were selected.
Multicollinearity was assessed using the Variance Inflation Factor (VIF), ensuring that factors for the independent variables were below 3. The maximum Cook’s distance was calculated to reveal potential significant outliers (>1). The residuals’ distributions were graphically assessed, as well as the Q–Q plots to investigate deviations from normality. In addition, graphical inspections of the residuals vs the fitted values were performed to ensure the homogeneity of variance.
3. Results
Table displays the values of pull-out distance, speed differential with the leading vehicle at the manoeuvre initiation point and lane change duration. Pull-out distance varied between 3.22 and 223.37 m, with an average of 44.3 m, higher than the one of 30 m reported by Toledo and Zohar (Citation2007). Speed differentials between −5.08 and 19.2 m/s were reported, supporting that a threshold of speed differential at which drivers overtake cannot be strictly defined and drivers tend to pass other vehicles even when they are travelling at higher speed (Bar-Gera and Shinar Citation2005). Lane change duration varied between 2.4 and 10 s, with a mean of 5.88 s, close to the 6 s average previously reported in literature (Hill, Elefteriadou, and Kondyli Citation2015).
Table 1. Values of the overtaking parameters, pull-out distance, speed differential with the leading vehicle at the manoeuvre initiation point and lane change duration.
To explore the urgency of the lane change, a 4-point scale based on TTC values was calculated based on the approach previously used by Lee, Olsen, and Wierwille (Citation2004) and Wang, Yang, and Hurwitz (Citation2019); when TTC > 5.5 s the manoeuvre was classified as non-urgent, for values between 5.5 ≥ TTC > 3 s urgent, 3 ≥ TTC > 1 s forced and TTC ≤ 1 s critical/near crash. 54.77% of the manoeuvres were considered non-urgent, followed by 33.45% and 11.55% of urgent and forced lane changes respectively, while only 0.23% was characterised as near crash.
3.1. Structural Equation Modelling
The variables pull-out distance and speed differential at the initiation of the lane change were selected as indicators for the pull-out comfort zone; the two indicators have a strong positive correlation (z = 34.664, p < .05). However, the total number of factors that are considered by the driver prior to the manoeuvre initiation cannot be directly observed; parameters like the anticipation of the actions of the leading vehicle (Li et al. Citation2018) can also affect the comfort zone boundaries. Consequently, it was assumed that the pull-out comfort zone is a non-observable (latent) variable. Following an initial exploration of the data as well as the findings of the regression models, it was hypothesised that the pull-out comfort zone would be affected by variables referring to the traffic conditions, the type of the leading vehicle and the overtaking strategy adopted (i.e. the driving behaviour right before the manoeuvre). Similarly, these parameters are not only considered simultaneously, but also affected by numerous factors related to the behaviour of the surrounding traffic.
Consequently, 3 latent variables were included in the model, (i) the ‘pull-out comfort zone' with regards to the leading vehicle, i.e. spatiotemporal characteristics reflecting the relationship between the overtaking and overtaken vehicles, under which the driver is comfortable to initiate the manoeuvre, (ii) ‘traffic', i.e. traffic conditions at the manoeuvre initiation point and (iii) ‘strategy', i.e. the overtaking strategy selected; high values reflect and accelerative strategy and low a flying. Initially, all variables referring to the traffic conditions were included. Specifically, the presence/absence of surrounding vehicles (fol, left_fol, left_prec, left_al) (Figure ), traffic density (high/low) as well as the LC urgency (defined in section 3) were considered. Nonetheless, the presence/absence of a leading vehicle in the destination lane, as well as, following vehicles in the initial and destination lane (left_prec, left_fol, fol) resulted to the best model fit. Table displays the results of the final SEM model. The fit measures indicate a good structure (CFI > .97; RMSEA < .05; SRMR ≤ .05; NNFI ≥ .97) (Schermelleh-Engel, Moosbrugger, and Müller Citation2003). The test was not satisfied (
>3 df), however, since this test is sensitive to deviations from normality as well as the sample size it should not solely judge the model fit (Schermelleh-Engel, Moosbrugger, and Müller Citation2003). The structural part of the model shows the relationships between the examined variables. The class of the preceding vehicle (prec_v class) had the strongest impact on the pull-out comfort zone, followed by traffic. Overtaking strategy had also a significant impact, with lower values recorded for accelerative manoeuvres. Figure displays the path diagram of the model.
Figure 2. Path diagram of structural equation modelling results; square nodes indicate observed variables, circles the latent variables; the arrow indices indicate the standardised regression coefficients and factor loadings for the latent variables; double point arrows represent the variances and covariances.
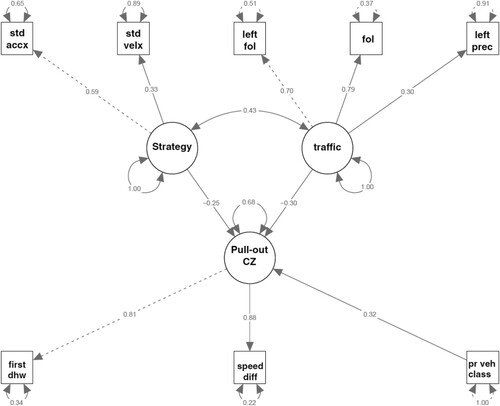
Table 2. Results of structural equation modelling.
3.2. Model of pull-out distance
Table displays the model of pull-out distance, including the final variables as selected based on the AIC, as described in section 2.3. The initial variables considered included: the presence/absence of surrounding traffic (left_fol, left_al, left_prec, fol) (Figure ), the class of the preceding vehicle (Car/Truck), traffic density (High/Low), the longitudinal velocity of the ego vehicle at the manoeuvre initiation point (υa0), the mean and standard deviation of the speed of the ego vehicle prior the manoeuvre initiation, the mean and standard deviation of the lateral acceleration during the approaching phase, the mean and standard deviation of the longitudinal acceleration prior the manoeuvre initiation and the speed differential between the ego and preceding vehicle during the initiation of the manoeuvre (υa0–υb0). The maximum Cook’s distance was 0.086, not indicating any significant outliers. The class of the preceding vehicle had the strongest impact, followed by the presence/absence of an alongside vehicle in the destination lane. Specifically, drivers initiated an overtake at a longer distance when passing a truck and without the presence of an alongside vehicle. The interaction between the vehicle’s speed at the manoeuvre initiation point and traffic density also displayed a significant effect. As it derives from Figure , for low traffic density there is a strong positive relationship between speed and pull-out distance; however, for high traffic density the pattern is less clear. The presence of the following vehicle as well as an increase in the standard deviation prior to the initiation of the manoeuvre also resulted to shorter distances.
Figure 3. Plot of the pull-out distance (m) vs. the longitudinal speed (m/s) at the manoeuvre initiation point, for different traffic density conditions; the regression lines, as well as the respective speed values measured at km/h are also displayed.
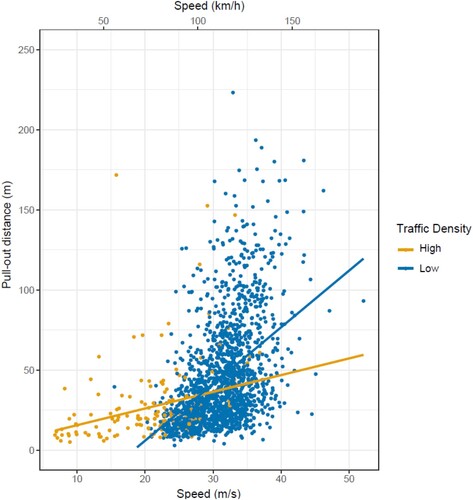
Table 3. Model of pull-out distance; lognormal linear regression.
3.3. Model of lane change duration
Table displays the model of the lane change duration, including the final variables as selected based on the AIC, as described in section 2.3. The initial variables considered included: the presence/absence of surrounding traffic (left_fol, left_al, left_prec, fol)(Figure ), the class of the preceding vehicle (Car/Truck), traffic density (High/Low), the longitudinal velocity of the ego vehicle at the manoeuvre initiation point (υa0), the mean and standard deviation of the speed of the ego vehicle prior the manoeuvre initiation, the mean and standard deviation of the lateral acceleration during the approaching phase, the mean and standard deviation of the longitudinal acceleration prior the manoeuvre initiation, the speed differential between the ego and preceding vehicle during the initiation of the manoeuvre (υa0–υb0), the pull-out distance (dhw0), LC urgency, as well as the mean longitudinal velocity and acceleration during the lane change. The maximum Cook’s distance was 0.055, which does not indicate any significant outliers. The standard deviation of the lateral acceleration before the manoeuvre initiation showed the highest impact, with higher values leading to shorter durations. Similarly, the presence of a following vehicle as well as increased lane change urgency (LC urgency) contributed to lower values. Higher speed at the manoeuvre initiation point as well as higher mean longitudinal acceleration also resulted to shorter durations, while longer pull-out distances lead to longer lane changes.
Table 4. Model of lane change duration; lognormal linear regression.
3.4. Model of speed differential
Initial modelling of the speed differential revealed low explanatory power for low values. To explore this further, the relationship between the speed differential and the longitudinal velocity at the manoeuvre initiation point was investigated. Figure shows that while for values over 30 m/s (108 km/h) there is a strong linear relationship between the variables, no clear pattern exists for lower values. Consequently, a subsample of 1025 lane changes, with values larger than 30 m/s was used to develop this model. Table displays the model of speed differential at the manoeuvre initiation point, including the final variables as selected based on the AIC, as described in section 2.3. The initial variables considered included: the presence/absence of surrounding traffic (left_fol, left_al, left_prec, fol) (Figure ), the class of the preceding vehicle (Car/Truck), traffic density (High/Low), the longitudinal velocity of the ego vehicle at the manoeuvre initiation point (υa0), the mean and standard deviation of the speed of the ego vehicle prior the manoeuvre initiation, the mean and standard deviation of the lateral acceleration during the approaching phase, the mean and standard deviation of the longitudinal acceleration prior the manoeuvre initiation and the pull-out distance (dhw0). The maximum Cook’s distance was 0.25, indicating no significant outliers. The class of the preceding vehicle had the strongest impact, followed by the pull-out distance. Lane changes were initiated at higher speed differentials when the leading vehicle was a truck and for longer distances. Higher speed of the subject vehicle and the presence of the following vehicle in the destination lane resulted to higher speed differentials. The presence of an alongside vehicle in the left lane on the other hand, was linked to decreased values.
Figure 4. Plot of the speed differential (m/s) and the longitudinal speed (m/s) at the manoeuvre initiation point; the respective speed values measured at km/h are also displayed.
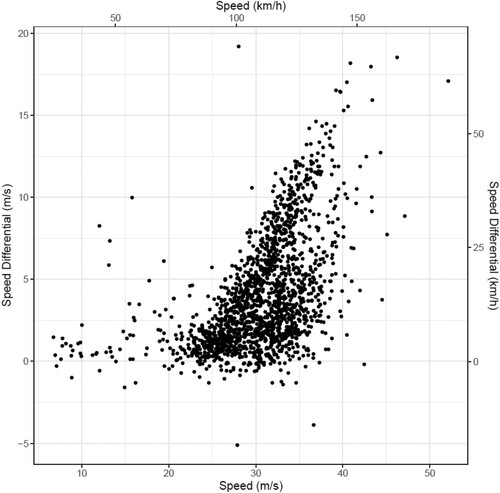
Table 5. Model of speed differential; linear regression.
4. Discussion
4.1. General discussion
This study investigated pull-out decisions and execution in a motorway context, in order to reveal preferred human behaviour patterns, supporting the planning of natural automated trajectories and the prediction of the intentions of the surrounding traffic. Pull-out characteristics were found to be strongly affected by traffic conditions as well as the driving behaviour at and before the manoeuvre initiation point.
Pull-out distance was most strongly affected by the type of the preceding (overtaken) vehicle, with drivers maintaining larger gaps when passing trucks. This result deviates from findings in car-following that reported shorter headways when the leading vehicle is a truck (Brackstone, Waterson, and McDonald Citation2009; Sayer, Mefford, and Huang Citation2003). While drivers may perceive following a truck as safer and more predictable (Sayer, Mefford, and Huang Citation2003), overtaking and lane changing require a clear view of the initial and neighbouring lanes, prompting an initiation of the manoeuvre at longer distances.
The presence or absence of surrounding vehicles also appears to have an important effect. Specifically, the presence of either a following or an adjacent vehicle in the destination lane resulted in lower pull-out distances, suggesting that the drivers felt pressured to initiate the overtake and avoid potential conflicts. Increase in the standard deviation of the longitudinal acceleration, linked to the performance of an accelerative manoeuvre, resulted in shorter pull-out distances, in line with previous literature findings in undivided highways (Papakostopoulos et al. Citation2010).
Under low traffic density, higher speeds prompted drivers to initiate a lane change at longer distances, while less clear patterns exist for high traffic density. In their simulator study of freeway overtaking and lane changing manoeuvres, Yang et al. (Citation2018) identified an important impact of traffic density on the initial overtaking distance; drivers accepted shorter gaps as the density increased from a Level of Service (LOS) B to D. In the current study high values included over 40 vehicles/km/ln, corresponding to a LOS F (Mathew and Krishna Rao Citation2007), forced traffic flow, leading to stop and go waves that may contribute to the absence of clear patterns.
Lane change duration was strongly affected by speed and acceleration values, as well as the surrounding traffic. While lateral acceleration displays limited sensitivity at the lane change initiation point, revealing no ‘tell-tale' patterns (Lee, Olsen, and Wierwille Citation2004), its values right before the manoeuvre commencement significantly affected duration. Specifically, the standard deviation of lateral acceleration before the initiation of the manoeuvre had the strongest impact; sharper increases leaded to shorter manoeuvre durations. Higher values of speed and longitudinal acceleration resulted to swifter manoeuvres, as expected, confirming previous findings in two-lane highways (Farah Citation2013) and motorways (Ali et al. Citation2020). Nonetheless, as described earlier, motorway and two-lane roads overtaking consist of different steps and are highly different manoeuvres. With regards to duration of a lane change, the road type has also been found to have an impact (Yang, Wang, and Quddus Citation2019). The latter confirms the value of research focused on motorway overtaking and suggests that comparisons between the two manoeuvres should be made with caution. The presence of a following vehicle also seems to prompt the drivers to complete the manoeuvre sooner. In line with Farah (Citation2013) and Toledo and Zohar (Citation2007), overtaking and lane change duration was found to be increased for longer pull-out distances; in addition, higher lane change urgency leaded to shorter manoeuvres. The latter findings suggest that drivers tend to perform longer manoeuvres given adequate space and for limited urgency, namely, when the perceived risk is reduced.
Traffic and driving behaviour at the initiation point had an important impact on the speed differential with the leading vehicle. Higher values were observed for longer pull-out distances, suggesting that the higher the speed differential, the larger gaps were considered suitable and safe. Longitudinal speed at the manoeuvre initiation point had also a strong positive impact. In their evaluation of passing manoeuvres in two-lane rural highways in Spain, Llorca and García (Citation2011) found that the average speed difference between an overtaking and an overtaken vehicle did not depend on the leading vehicle type. Nevertheless, the current results revealed higher differentials when the leading vehicle was a truck, probably attributed to the high speed limits in place for cars in Germany and within the highD dataset (from 120 km/h to no speed limit), comparing with the ones for divided highways in Spain (100 km/h). Moreover, as described above, motorway and two-lane roads overtaking are highly different manoeuvres and, therefore, this result may be attributed to their overall different processes. This supports the value of investigating overtaking using different datasets that take into consideration the variability of lane discipline and overall traffic regulations.
The presence of other traffic in the destination lane affected speed differential values in different ways. While an adjacent vehicle in the left lane resulted in lower relative speed values, possibly by prompting the drivers to break before performing the manoeuvre, a following vehicle in the destination lane was linked to higher values. This suggests that the presence of an approaching vehicle urged the drivers to perform the overtake and avoid a possible conflict.
No clear patterns were observed for speed values less than 30 m/s. As observed in the analysis of the pull-out distance, congested traffic and thus low speed did not affect overtaking behaviour in a consistent manner. Lower speeds have been found to increase driver frustration and intention to overtake (Kinnear et al. Citation2015), which may cause the discrepancies compared to the patterns observed in less restricted flow.
The class of the preceding vehicle had the strongest impact on the pull-out comfort zone. Following the discussion on pull-out distance and speed differential, an increase in the comfort zone boundaries for trucks is reasonable; consequently, while AVs will be equipped with sensors that can compensate the visibility challenge when passing a truck, passenger aware trajectory planning should consider broader boundaries to positively influence comfort.
The presence of surrounding traffic, on the other hand, prompted the drivers to compromise the comfort zone boundaries. In line with research on overtaking cyclists in rural roads that showed larger zones when oncoming traffic was absent (Dozza et al. Citation2016), it appears that surrounding vehicles constitute a motivation for drivers to perform the manoeuvre earlier.
It was observed that accelerative manoeuvres required shorter boundaries compared to flying overtakes. Kovaceva et al. (Citation2019) did not identify any significant differences between strategies for the minimum approaching gap when passing cyclists, however, without the presence of oncoming traffic, longer gaps were reported for flying manoeuvres. This may be partially attributed to the positive correlation between flying overtakes and the absence of surrounding traffic, as indicated by the SEM results. Specifically, it appears that without the pressure imposed by the surrounding vehicles, drivers tend to perform the manoeuvres sooner, without significantly adjusting their speed.
4.2. Limitations
The current study is based on the assumption that the driving behaviour recorded represents the preferred behaviour of the drivers for their exact driving conditions. While studies suggest the benefit of natural human-like trajectories, it is yet to be fully explored which would be the optimal automated driving style. It utilised naturalistic data, in order to capture real-world overtaking behaviour; however, in order to acquire optimal video quality, the recordings only took place during daytime, in 6 motorway locations and under clear weather conditions. In addition, due to the length of the recorded road segment, full overtaking manoeuvres could not be investigated in detail. Future research should explore the lane change and passing decisions under different environmental conditions and consider a wider range of manoeuvres, as well as more detailed information about the surrounding traffic (e.g. speed, gap in the destination lane) and the vehicle dynamics before the initiation point, in order to support the thorough investigation of the drivers’ decision making process. In addition, following the driver-related variations in overtaking behaviour (e.g. Farah Citation2013; Vlahogianni Citation2013), the investigation of the impact of driving style and demographics can unravel further patterns.
5. Conclusions
This research explored the pull-out phase of motorway overtaking, in order to map the range of variation of manoeuvre characteristics in human driving. It was found that preferred overtaking behaviour was significantly affected by the surrounding traffic conditions, as well as the driving characteristics on or before the manoeuvre initiation point, which reflected the overtaking strategy selected (flying or accelerative).
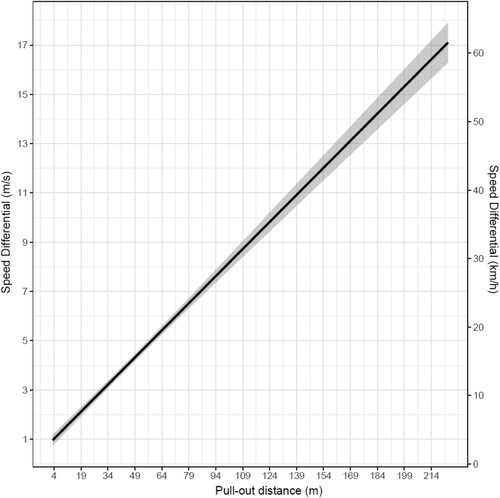
The findings can support future technologies that contribute towards the reduction of road collisions and enhance road safety levels. Specifically, the identified relationships (Tables ) can inform the development of context-adaptive corridors of average pull-out manoeuvres that can support manufacturers in the design of user-centred automated systems. For instance, Figure visualises the corridor of the relationship between the pull-out distance and the speed differential at the manoeuvre initiation point at a 95% confidence interval. The corridor can be adjusted based on the study’s findings and support the design of average, human-like overtaking trajectories that contribute to a positive passenger experience and encourage the uptake of the technology. In addition, the above relationships can assist the intention prediction for lane keeping assistance systems, in order to optimise the system’s response to cutting in and pull-out manoeuvres.
Figure 5. Speed differential at manoeuvre initiation vs. the pull-out distance; the confidence band of the regression line (±1.96 * Standard Error) is depicted in grey; the respective speed values measured at km/h are also displayed.
Acknowledgements
The authors would like to acknowledge the Institute of Automotive Engineering Aachen, RWTH Aachen University for providing the highD dataset for this research. Car top view images in figure 1 are courtesy of all-free-download.com.
Disclosure statement
No potential conflict of interest was reported by the author(s).
Additional information
Funding
References
- Abe, Genya, Kenji Sato, and Makoto Itoh. 2018. “Driver Trust in Automated Driving Systems: The Case of Overtaking and Passing.” IEEE Transactions on Human-Machine Systems 48: 85–94. doi:10.1109/THMS.2017.2781619.
- Ali, Yasir, Zuduo Zheng, Md Mazharul Haque, Mehmet Yildirimoglu, and Simon Washington. 2020. “Understanding the Discretionary Lane-Changing Behaviour in the Connected Environment.” Accident Analysis and Prevention 137: 105463. doi:10.1016/j.aap.2020.105463.
- Balal, Esmaeil, Ruey Long Cheu, Thompson Gyan-Sarkodie, and Jessica Miramontes. 2014. “Analysis of Discretionary Lane Changing Parameters on Freeways.” International Journal of Transportation Science and Technology 3: 277–296. doi:10.1260/2046-0430.3.3.277.
- Balal, Esmaeil, Ruey Long Cheu, and Thompson Sarkodie-Gyan. 2016. “A Binary Decision Model for Discretionary Lane Changing Move Based on Fuzzy Inference System.” Transportation Research Part C: Emerging Technologies 67: 47–61. doi:10.1016/j.trc.2016.02.009.
- Ballesteros-Tolosana, Iris, Sorin Olaru, Pedro Rodriguez-Ayerbe, Guillermo Pita-Gil, and Renaud Deborne. 2017. “Collision-Free Trajectory Planning for Overtaking on Highways.” IEEE 56th Annual Conference on Decision and Control, 2551–2556. doi:10.1109/CDC.2017.8264028.
- Bar-Gera, Hillel, and David Shinar. 2005. “The Tendency of Drivers to Pass Other Vehicles.” Transportation Research Part F: Traffic Psychology and Behaviour 8: 429–439. doi:10.1016/j.trf.2005.06.001.
- Bärgman, Jonas, Kip Smith, and Julia Werneke. 2015. “Quantifying Drivers’ Comfort-Zone and Dread-Zone Boundaries in Left Turn Across Path/Opposite Direction (LTAP/OD) Scenarios.” Transportation Research Part F: Traffic Psychology and Behaviour 35: 170–184. doi:10.1016/j.trf.2015.10.003.
- Bärgman, Jonas, Nicole van Nes, Christoph Michiel, Reinier Jansen, Veerle Heijne, Oliver Carsten, Mandy Dotzauer, et al. 2017. “The UDrive Dataset and Key Analysis Results.” doi:10.26323/UDRIVE.
- Barmpounakis, E. N., E. I. Vlahogianni, and J. C. Golias. 2016a. “Vision-Based Multivariate Statistical Modeling for Powered Two-Wheelers Maneuverability During Overtaking in Urban Arterials.” Transportation Letters 8: 167–176. doi:10.1080/19427867.2015.1122399.
- Barmpounakis, E. N., E. I. Vlahogianni, and J. C. Golias. 2016b. “Modeling Cooperation and Powered-Two Wheelers Short-Term Strategic Decisions During Overtaking in Urban Arterials.” International Journal of Transportation Science and Technology 5 (4): 227–238.
- Barmpounakis, E. N., E. I. Vlahogianni, and J. C. Golias. 2017. “Identifying Predictable Patterns in the Unconventional Overtaking Decisions of PTW for Cooperative ITS.” IEEE Transactions on Intelligent Vehicles 3 (1): 102–111.
- Bellem, Hanna, Thorben Schönenberg, Josef F. Krems, and Michael Schrauf. 2016. “Objective Metrics of Comfort: Developing a Driving Style for Highly Automated Vehicles.” Transportation Research Part F: Traffic Psychology and Behaviour 41: 45–54. doi:10.1016/j.trf.2016.05.005.
- Brackstone, Mark, Ben Waterson, and Mike McDonald. 2009. “Determinants of Following Headway in Congested Traffic.” Transportation Research Part F: Traffic Psychology and Behaviour 12: 131–142. doi:10.1016/j.trf.2008.09.003.
- Chandra, S., and S. Shukla. 2012. “Overtaking Behavior on Divided Highways Under Mixed Traffic Conditions.” Procedia – Social and Behavioral Sciences 43: 313–322. doi:10.1016/j.sbspro.2012.04.104.
- Chen, Rong, Kristofer D. Kusano, and Hampton C. Gabler. 2015. “Driver Behavior During Overtaking Maneuvers from the 100-Car Naturalistic Driving Study.” Traffic Injury Prevention 16: S176–S181. doi:10.1080/15389588.2015.1057281.
- Dixit, Shilp, Saber Fallah, Umberto Montanaro, Mehrdad Dianati, Alan Stevens, Francis Mccullough, and Alexandros Mouzakitis. 2018. “Trajectory Planning and Tracking for Autonomous Overtaking: State-of-the-Art and Future Prospects.” Annual Reviews in Control 45: 76–86. doi:10.1016/j.arcontrol.2018.02.001.
- Dozza, Marco, Ron Schindler, Giulio Bianchi-Piccinini, and Johan Karlsson. 2016. “How Do Drivers Overtake Cyclists?” Accident Analysis and Prevention 88: 29–36. doi:10.1016/j.aap.2015.12.008.
- Elbanhawi, Mohamed, Milan Simic, and Reza Jazar. 2015. “In the Passenger Seat: Investigating Ride Comfort Measures in Autonomous Cars.” IEEE Intelligent Transportation Systems Magazine 7: 4–17. doi:10.1109/MITS.2015.2405571.
- Epskamp, S. 2019. “semPlot: Path Diagrams and Visual Analysis of Various SEM Packages.” R package version 1.1.2. https://CRAN.R-project.org/package=semPlot.
- Fagnant, Daniel J., and Kara Kockelman. 2015. “Preparing a Nation for Autonomous Vehicles: Opportunities, Barriers and Policy Recommendations.” Transportation Research Part A: Policy and Practice 77: 167–181. doi:10.1016/j.tra.2015.04.003.
- Farah, Haneen. 2013. “Modeling Drivers Passing Duration and Distance in a Virtual Environment.” IATSS Research 37: 61–67. doi:10.1016/j.iatssr.2013.03.001.
- Farah, Haneen, Shlomo Bekhor, Abishai Polus, and Tomer Toledo. 2009. “A Passing Gap Acceptance Model for Two-Lane Rural Highways.” Transportmetrica 5: 159–172. doi:10.1080/18128600902721899.
- Farah, Haneen, Giulio Bianchi Piccinini, Makoto Itoh, and Marco Dozza. 2019. “Modelling overtaking strategy and lateral distance in car-to-cyclist overtaking on rural roads: A driving simulator experiment.” Transportation Research Part F: Traffic Psychology and Behaviour 63: 226–239. https://doi.org/10.1016/j.trf.2019.04.026.
- Farah, H., A. Polus, S. Bekhor, and T. Toledo. 2007. “Study of Passing Gap Acceptance Behavior Using a Driving Simulator.” Advances in Transportation Studies: An International Journal Special Issue 2007: 9–16.
- Golob, Thomas F. 2003. “Structural Equation Modeling for Travel Behavior Research.” Transportation Research Part B: Methodological 37: 1–25. doi:10.1016/S0191-2615(01)00046-7.
- Gray, Rob, and David M. Regan. 2005. “Perceptual Processes Used by Drivers During Overtaking in a Driving Simulator.” Human Factors 47: 394–417. doi:10.1518/0018720054679443.
- Hartwich, Franziska, Matthias Beggiato, and Josef F. Krems. 2018. “Driving Comfort, Enjoyment and Acceptance of Automated Driving–Effects of Drivers’ Age and Driving Style Familiarity.” Ergonomics 61: 1017–1032. doi:10.1080/00140139.2018.1441448.
- Hegeman, Geertje. 2008. “Assisted Overtaking An Assessment of Overtaking on Two-Lane Rural Roads.” PhD diss., The Netherlands TRAIL Research School.
- Hegeman, Geertje, Karel Brookhuis, and Serge Hoogendoorn. 2005. “Opportunities of Advanced Driver Assistance Systems Towards Overtaking.” European Journal of Transport and Infrastructure Research (EJTIR) 5: 281–296.
- Hill, Corey, Lily Elefteriadou, and Alexandra Kondyli. 2015. “Exploratory Analysis of Lane Changing on Freeways Based on Driver Behavior.” Journal of Transportation Engineering 141: 04014090. doi:10.1061/(ASCE)TE.1943-5436.0000758.
- Kinnear, Neale, Shaun Helman, Caroline Wallbank, and Graham Grayson. 2015. “An Experimental Study of Factors Associated with Driver Frustration and Overtaking Intentions.” Accident Analysis and Prevention 79: 221–230. doi:10.1016/j.aap.2015.03.032.
- Knoop, V. L., M. Keyvan-Ekbatani, M. De Baat, H. Taale, and S. P. Hoogendoorn. 2018. “Lane Change Behavior on Freeways: An Online Survey Using Video Clips.” Journal of Advanced Transportation 2018. doi:10.1155/2018/9236028.
- Kovaceva, Jordanka, Gustav Nero, Jonas Bärgman, and Marco Dozza. 2019. “Drivers Overtaking Cyclists in the Real-World: Evidence from a Naturalistic Driving Study.” Safety Science 119: 199–206. doi:10.1016/j.ssci.2018.08.022.
- Krajewski, Robert, Julian Bock, Laurent Kloeker, and Lutz Eckstein. 2018. “The HighD Dataset: A Drone Dataset of Naturalistic Vehicle Trajectories on German Highways for Validation of Highly Automated Driving Systems.” 2018 21st International Conference on Intelligent Transportation Systems (ITSC): 2118-2125. doi:10.1109/ITSC.2018.8569552.
- Kruber, Friedrich, Jonas Wurst, Samarjit Chakraborty, and Michael Botsch. 2019. “Highway Traffic Data: Macroscopic, Microscopic and Criticality Analysis for Capturing Relevant Traffic Scenarios and Traffic Modeling Based on the HighD Data Set.” https://arxiv.org/abs/1903.04249.
- Lattarulo, Ray, Daniel Heß, and Joshue Pérez. 2018. “A Linear Model Predictive Planning Approach for Overtaking Manoeuvres Under Possible Collision Circumstances.” 2018 IEEE Intelligent Vehicles Symposium (IV), 1340–1345. doi:10.1109/IVS.2018.8500542.
- Lee, Suzanne E., Erik CB Olsen, and Walter W. Wierwille. 2004. A Comprehensive Examination of Naturalistic Lane-Changes. Washington, DC: National Highway Traffic Safety Administration.
- Li, Ye, Ruifeng Gu, Jaeyoung Lee, Min Yang, Qinghong Chen, and Yinggui Zhang. 2021. “The Dynamic Tradeoff Between Safety and Efficiency in Discretionary Lane-Changing Behavior: A Random Parameters Logit Approach with Heterogeneity in Means and Variances.” Accident Analysis and Prevention 153: 106036. doi:10.1016/j.aap.2021.106036.
- Li, Li, Dong Zhang, Zhi Gang Xu, Ping Wang, and Gui Ping Wang. 2018. “The Roles of Car Following and Lane Changing Drivers’ Anticipations During Vehicle Inserting Process: A Structural Equation Model Approach.” Journal of Advanced Transportation 2018. doi:10.1155/2018/6372861.
- Ljung Aust, Mikael, and Johan Engström. 2011. A Conceptual Framework for Requirement Specification and Evaluation of Active Safety Functions.” Theoretical Issues in Ergonomics Science 12: 44–65. doi:10.1080/14639220903470213.
- Llorca, Carlos, and Alfredo García. 2011. “Evaluation of Passing Process on Two-Lane Rural Highways in Spain with New Methodology Based on Video Data.” Transportation Research Record 2262: 42–51. doi:10.3141/2262-05.
- Mahajan, Vishal, Christos Katrakazas, and Constantinos Antoniou. 2020. “Prediction of Lane-Changing Maneuvers with Automatic Labeling and Deep Learning.” Transportation Research Record 2674: 336–347. doi:10.1177/0361198120922210.
- Mathew, Tom V., and K. V. Krishna Rao. 2007. “Capacity and Level of Service at Unsignalized Intersections, Final Report: Volume 1-Two-Way Stop-Controlled Intersections.” In Introduction to Transportation Engineering, 3:46. http://pubsindex.trb.org/view.aspx?id=476626.
- Matson, T. M., and T. W. Forbes. 1938. “Overtaking and Passing Requirements as Determined from a Moving Vehicle.” Highway Research Board Proceedings 18: 100–112.
- Naranjo, José E., Carlos González, Ricardo García, and Teresa De Pedro. 2008. “Lane-Change Fuzzy Control in Autonomous Vehicles for the Overtaking Maneuver.” IEEE Transactions on Intelligent Transportation Systems 9: 438–450. doi:10.1109/TITS.2008.922880.
- Nie, Jianqiang, Jian Zhang, X. Wan, Wanting Ding, and Bin Ran. 2016. “Modeling of Decision-Making Behavior for Discretionary Lane-Changing Execution.” 2016 IEEE 19th International Conference on Intelligent Transportation Systems (ITSC): 707–712. doi:10.1109/ITSC.2016.7795631.
- Nussbeck, Fridtjof W., Michael Eid, and Tanja Lischetzke. 2006. “Analysing Multitrait-Multimethod Data with Structural Equation Models for Ordinal Variables Applying the WLSMV Estimator: What Sample Size Is Needed for Valid Results?” British Journal of Mathematical and Statistical Psychology 59: 195–213. doi:10.1348/000711005X67490.
- Oliveira, Luis, Karl Proctor, Christopher G. Burns, and Stewart Birrell. 2019. “Driving Style: How Should an Automated Vehicle Behave?” Information 10: 219. doi:10.3390/info10060219.
- Papakostopoulos, Vassilis, Eleana Georgia Spanou, Dimitris Nathanael, and Kostas Gkikas. 2010. “Understanding Overtaking, Beyond Limitations of the Visual System in Making Spatiotemporal Estimations.” ECCE 2010 – European Conference on Cognitive Ergonomics 2010: The 28th Annual Conference of the European Association of Cognitive Ergonomics, 169–72. doi:10.1145/1962300.1962334.
- R Core Team. 2019. “R: A Language and Environment for Statistical computing”. Vienna, Austria: R Foundation for Statistical Computing. https://www.r-project.org/
- Rosseel, Y. 2012. “lavaan: An R Package for Structural Equation Modeling.” Journal of Statistical Software 48: 1–36. https://www.jstatsoft.org/v48/i02/.
- Rosseel, Y. 2021. “The lavaan tutorial.” lavaan Tutor. 37.
- Ryan, J. A., and J. M. Ulrich. 2020. quantmod: Quantitative Financial Modelling Framework. R package version 0.4.18. https://CRAN.R-project.org/package=quantmod.
- Sayer, James R, Mary Lynn Mefford, and Ritchie W Huang. 2003. “The Effects of Lead-Vehicle Size on Driver Following Behavior: Is Ignorance Truly Bliss?” Second International Driving Symposium on Human Factors in Driver Assessment, Training and Vehicle Design, 21–24. doi:10.17077/drivingassessment.1127.
- Schermelleh-Engel, Karin, Helfried Moosbrugger, and Hans Müller. 2003. “Evaluating the Fit of Structural Equation Models: Tests of Significance and Descriptive Goodness-of-Fit Measures.” MPR-Online 8: 23–74.
- Schoenmakers, Mathijs, Dujuan Yang, and Haneen Farah. 2021. “Car-Following Behavioural Adaptation When Driving Next to Automated Vehicles on a Dedicated Lane on Motorways: A Driving Simulator Study in the Netherlands.” Transportation Research Part F: Traffic Psychology and Behaviour 78: 119–129. doi:10.1016/j.trf.2021.01.010.
- Sourelli, Anna-Maria, Ruth Welsh, and Pete Thomas. 2021. “Objective and Perceived Risk in Overtaking: The Impact of Driving Context.” Transportation Research Part F: Traffic Psychology and Behaviour 81: 190–200. doi:10.1016/j.trf.2021.05.018.
- Toledo, Tomer, Charisma F. Choudhury, and Moshe E. Ben-Akiva. 2005. “Lane-Changing Model with Explicit Target Lane Choice.” Transportation Research Record 1934: 157–165. doi:10.3141/1934-17.
- Toledo, Tomer, and Haneen Farah. 2011. “Alternative Definitions of Passing Critical Gaps.” Transportation Research Record: Journal of the Transportation Research Board 2260: 76–82. doi:10.3141/2260-09.
- Toledo, Tomer, Haris N Koutsopoulos, and Moshe E Ben-akiva. 2003. “Modeling Integrated Lane-Changing Behavior.” Transportation Research Record 1857: 30–38.
- Toledo, Tomer, and David Zohar. 2007. “Modeling Duration of Lane Changes.” Transportation Research Record 1999: 71–78. doi:10.3141/1999-08.
- United Nations. 2021. Uniform Provisions Concerning the Approval of Vehicles with Regard to Automated Lane Keeping Systems. Addendum 156 – UN Regulation No. 157. https://unece.org/sites/default/files/2021-03/R157e.pdf.
- Venthuruthiyil, Suvin P., and Mallikarjuna Chunchu. 2021. “Interrupted and Uninterrupted Lane Changes: A Microscopic Outlook of Lane-Changing Dynamics.” Transportmetrica A: Transport Science, 1–20. doi:10.1080/23249935.2021.1965240.
- Vlahogianni, Eleni I. 2013. “Modeling Duration of Overtaking in Two Lane Highways.” Transportation Research Part F: Traffic Psychology and Behaviour 20: 135–146. doi:10.1016/j.trf.2013.07.003.
- Wang, Xuesong, Minming Yang, and David Hurwitz. 2019. “Analysis of Cut-in Behavior Based on Naturalistic Driving Data.” Accident Analysis and Prevention 124: 127–137. doi:10.1016/j.aap.2019.01.006.
- Washington, Simon P., Matthew G. Karlaftis, and Fred L. Mannering. 2003. Statistical and Econometric Methods for Transportation Data Analysis. Boca Raton, FL: Chapman and Hall.
- Yang, Liu, Xiaomeng Li, Wei Guan, H. Michael Zhang, and Lingling Fan. 2018. “Effect of Traffic Density on Drivers’ Lane Change and Overtaking Maneuvers in Freeway Situation – A Driving Simulator–Based Study.” Traffic Injury Prevention 19: 594–600. doi:10.1080/15389588.2018.1471470.
- Yang, Minming, Xuesong Wang, and Mohammed Quddus. 2019. “Examining Lane Change Gap Acceptance, Duration and Impact Using Naturalistic Driving Data.” Transportation Research Part C: Emerging Technologies 104: 317–331. doi:10.1016/j.trc.2019.05.024.