ABSTRACT
This study describes the development and utility of a new self-report measure of attentional capacities of adults with Attention Deficit Hyperactivity Disorder (ADHD): the Everyday Life Attention Scale (ELAS). Different from previous attention scales, attentional capacities are rated for nine everyday situations. Study 1 investigated the factor structure, validity, and reliability of the ELAS in 1206 healthy participants. Confirmatory factor analysis supported a situation-specific approach which categorizes everyday attention into nine situation scales: Reading, Movie, Activity, Lecture, Conversation, Assignment, Cooking, Cleaning up, and Driving. Each scale was composed of ratings for sustained, focused, selective, and divided attention as well as motivation, and had good internal consistency. Most scales showed weak correlations with ADHD Symptoms, Executive Functioning, and Memory Efficacy. Study 2 further investigated the sensitivity of the ELAS in 80 adults with ADHD compared to matched healthy controls and a mixed clinical group of 56 patients diagnosed with other psychiatric disorders. Compared to healthy controls, patients with ADHD reported reduced attentional capacities with large effect sizes on all situation scales and had a substantially higher number of situations with impaired attention scores. The ELAS may become useful in the clinical evaluation of ADHD and related psychiatric disorders in adults.
Self-report questionnaires are often used in psychological practice for the assessment of people’s attentional capacities. They are efficient tools for determining attentional impairments in patients with mental disorders, particularly in the field of Attention Deficit Hyperactivity Disorder (ADHD) as behavioral symptoms of inattention are a requirement for the diagnosis of ADHD (American Psychiatric Association, Citation2013; Kooij et al., Citation2008; Kooij et al., Citation2010). Self-reports of cognitive functions, including attention but also memory and executive functioning, often appear to be unrelated to objectively measured task performance on neuropsychological tests and are therefore assumed to provide unique information about the patients’ self-perceived impairments in everyday life (Barkley & Murphy, Citation2011; Fuermaier et al., Citation2015; Koerts et al., Citation2011; Salthouse & Siedlecki, Citation2005). However, the validity of questionnaires measuring symptoms of inattention or attentional capacities has been called into question because of several reasons which are discussed below (see, for a systematic review, Taylor, Deb, & Unwin, Citation2011). The aim of the present study was to develop a questionnaire for the assessment of everyday attentional capacities in adults, taking two important limitations of existing attention questionnaires into account. This questionnaire, the Everyday Life Attention Scale (ELAS), may become relevant for the assessment of ADHD in adults as well as other psychiatric or neurological disorders.
One drawback of existing attention questionnaires is that they rely on a participant’s own judgement of difficulty or frequency of a particular attentional impairment, without providing a clear reference point of what is commonly regarded as “difficult” or “often.” Attention questionnaires usually present items stating a specific attentional difficulty that has to be rated on a 4- or 5-point Likert scale ranging from “very rarely” or “never” to “very often” (Broadbent, Cooper, Fitzgerald, & Parkes, Citation1982: Cognitive Failures Questionnaire; Conners, Citation1999: Conners’ Adult ADHD Rating Scale; DuPaul et al., Citation1998: ADHD Rating Scale for Children; DuPaul et al., Citation2001: ADHD Rating Scale for Adults; Ponsford & Kinsella, Citation1991: Rating Scale of Attentional Behavior; Suslow, Arolt, & Junghanns, Citation1998: Fragebogen Erlebter Defizite der Aufmerksamkeit). In these questionnaires, it is not explicated what should be regarded as “often”: for example, one person may consider once a day as “often” whereas another person may consider once a week as “often.” This may be especially difficult to judge for adults with ADHD, because their attention problems typically have an early onset that may give them a different reference point of what is regarded as normal attentional functioning. For patients with brain damage, this evaluation may be easier, because they have their premorbid attention functioning as a reference point.
A second drawback of attention questionnaires is that most of them ask about attentional difficulties in general and, therefore, disregard the context in the rating of attentional capacities or inattention symptoms. In practice, patients sometimes find it difficult to provide general answers because answers often depend on the situation. For example when asking about focused attention, reading a book might be difficult whereas watching television poses no problems. This caveat has also been acknowledged in the Handbook of Clinical Neuropsychology (Spikman & van Zomeren, Citation2010):
General statements about “the attention” of a patient should be avoided. The situation (or task) to a large extent determines which aspects of attention will be essential and whether deficits will become apparent. A patient’s attention may be adequate for a social chat, but inadequate for driving a car through dense traffic rush hour. Thus, statements about the attention of a patient should always be qualified in terms of the specific task and situation. The assessment of attention should never be limited to performance on a single task. (p. 81)
Some questionnaires do ask for symptoms of inattention or attentional capacities during various situations or task demands, but collapse the scores across situations into one general attentional ability score (Caterino, Gomez-Benito, Balluerka, Amador-Campos, & Stock, Citation2009: Caterino Scale; Schepers, Citation2007: Attention Questionnaire; Suslow et al., Citation1998: Fragebogen Erblebter Defizite der Aufmerksamkeit). Especially for the assessment of ADHD, it is important to assess symptoms of inattention in various situations as pervasiveness of the symptoms across settings is an important criterion for the diagnosis (American Psychiatric Association, Citation2013). This criterion has been incorporated well in the development of an assessment tool for ADHD in children: the Parent Interview for Child Symptoms (PICS) (Ickowicz et al., Citation2006). This interview prompts parents with everyday life situations their children face, such as playing outside or having dinner, and asks in a semi-structured way about specific symptoms of inattention, hyperactivity, impulsivity and oppositionality that might typically occur in these situations. The questionnaire presented here was inspired by this situation-specific approach, which could be useful in the clinical evaluation of adult with ADHD as well.
The development of the ELAS was furthermore inspired by neuropsychological theory. Our definition of attention is for a large part based on the multi-component model of attention by van Zomeren and Brouwer (Citation1994), which has its roots in earlier models by Posner and Rafal (Citation1987) who proposed the component theory of attention, by Kahneman (Citation1973) who introduced the selectivity and intensity aspects of attention, and by Shallice (Citation1982) who devised the concept of supervisory attentional control. The neuropsychological model by van Zomeren and Brouwer divides attention into five interdependent components that have been empirically supported to be selectively affected by different focal brain lesions: alertness (tonic and phasic), vigilance/sustained attention, focused/selective attention, divided attention, and strategy/flexibility. Alertness and vigilance/sustained attention refer to the “intensity of attention,” meaning that relatively stable levels of activation can be maintained for an unbroken period of time that may be enhanced in the occurrence of an event of high priority, i.e., the stimulus to noise ratio is relatively increased. Focused/selective and divided attention refers to the “selectivity of attention,” meaning that attention can be focused in the face of distractors or can be divided across competing tasks. Strategy/flexibility refers to attentional control of which information from competing sources will be selectively processed. Next to these components, also “mental effort” has an important role in the quality of attention, which can be seen as a limited capacity energy pool for controlled attentional processing (van Zomeren and Brouwer, Citation1994). Application of the model by van Zomeren and Brouwer on children and adults with ADHD indeed showed impairments in the components of vigilance, selective attention, divided attention, and flexibility (but not in alertness) in these patients (L. Tucha et al., Citation2008; O. Tucha et al., Citation2006). Furthermore, more recent work in the field of ADHD acknowledges the role of reinforcement sensitivity in cognitive and attentional processing, which can be expressed by the motivation to perform specific tasks well (Luman, Tripp, & Scheres, Citation2010).
Based on these neuropsychological aspects of attention, we included items in the questionnaire capturing sustained attention, focused/selective attention, divided attention, effort, and motivation. The strategy/flexibility component was not captured in the items itself but was taken into account by including situations with different task demands. We sketched nine different situations that people commonly face in everyday life and instructed them to rate their unbroken attention span in minutes (sustained attention) and their attentional abilities (focused attention, selective attention, divided attention, motivation, and effort) in percentages of their full focus on or commitment to the respective task. By asking for absolute values, participants were not required to make a self-judgement about their level of ability or impairment. Instead, by using the “level of performance approach,” the judgement of ability or impairment is determined afterward by comparing the individual scores to normative data.
Present study
The present study describes the psychometric characteristics of the ELAS. In Study 1, we introduce the ELAS and describe its factor structure, reliability, and validity in a large sample of healthy participants. Situation-specific factor models were compared to multicomponent attention models in order to test the validity of a situation-specific approach. Validity was further tested by investigating associations with self-reports of ADHD Symptoms, Executive Functioning, and Memory Efficacy. We chose to validate the ELAS in a healthy sample first, because ADHD symptoms follow a normal distribution in the general population of which clinical ADHD may represent the extreme end of a dimension (Coghill & Sonuga-Barke, Citation2012). Studying nonclinical symptoms for validation purposes offers some advantages, because the pure relationship between ADHD symptoms can be studied in the absence of comorbid disorders and because analyses of dimensional measures offer greater statistical power than categorical measures. In Study 2, we further validated the sensitivity of the ELAS for assessing attentional capacities in adult patients with ADHD in comparison to matched healthy participants and patients with psychiatric disorders other than ADHD.
Study 1
Methods
Participants
In total, 1490 participants in the age of 18 + were recruited during a period of four years (2012–2016). Participants were approached via the researchers (e.g., personal requests, e-mail, social media), by spreading flyers from door to door in the city of Groningen, and via the research participants pool of our department of psychology. Part of the participants started the survey but did not finish completing the ELAS and were dropped from the analysis (n = 204). Participants who indicated to have a psychological or psychiatric disorder were also excluded from the analysis (n = 80). Consequently, 1206 participants (n = 738 females, n = 468 males) were included in the analysis. The age ranged from 18 till 86 years, with a mean of 36 years (SD = 15.6 years). The sample consists primarily of average to highly educated people. More than half of the sample was highly educated and had a degree in higher professional or academic education (higher professional education: 19.4%, academic education: 29.4%). A total of 24.2% had a degree in senior secondary vocational/general education or pre-university education, 21.3% in junior secondary vocational/general education, and 0.3% only finished primary school. More than half of the participants was enrolled in a full-time educational program (54.9%), 13.4% was enrolled in a part-time educational program, and around one third was not enrolled in an educational program (31.4%). The study was approved by the Ethical Committee of Psychology affiliated with the University of Groningen, The Netherlands. All participants provided active informed consent by clicking the option in the online form that they agreed with participation in this study.
Furthermore, in order to determine test–retest reliability of the scale, 43 healthy individuals were recruited from the network of the second author to complete the same ELAS questionnaire twice on a retest period of 28 days. Participants for the test–retest study (19 females, 24 males) had a mean age of 33.9 years (SD = 13.9), ranging from 19 to 60 years. These participants had on average 15.6 years of education (SD = 3.8 years).
Procedure
Via Qualtrics software (Qualtrics, Citation2005) we distributed a survey that contained five questionnaires. After providing informed consent, participants started completing a brief questionnaire about their demographic characteristics. Thereafter, they completed the ELAS, followed by questionnaires about Memory Efficacy, Executive Functioning, and ADHD Symptoms (see Materials). Participants completed these questionnaire in their preferred language; Dutch (n = 468), English (n = 304), or German (n = 434). Completion time was around 45 minutes. However, participants were encouraged to take a break when needed. Some participants did not complete the whole survey and skipped some questionnaires following the ELAS: n = 22 skipped the Memory Efficacy questionnaire, n = 39 skipped the Executive Functioning questionnaire, n = 51 skipped the ADHD symptoms questionnaire.
Materials
Everyday life attention scale (ELAS)
The ELAS questionnaire is provided in Appendix A (for a Dutch or German version as well as preliminary scoring and norm forms please contact the authors). A scoring form and norm forms of the final version are provided in Appendix B. The questionnaire consists of nine sketches of situations that many people encounter in everyday life (see ): reading a book (Reading), watching a movie or documentary (Movie), performing an indoor activity (Activity), attending a lecture or open evening (Lecture), having a conversation (Conversation), doing an assignment/administration (Assignment), preparing a meal (Cooking), cleaning up the house (Cleaning up), and driving a car (Driving). We picked situations that have a substantial duration and by this require sustained attention (all around two hours of time), and situations that require some attentional effort or strategy (i.e., we excluded routine tasks that could elicit effortless attention). Situations could be categorized as receptive situations in which the person is taking in information (reading a book, watching a movie/documentary, attending a lecture or open evening, having a conversation) and productive situations in which the person is producing something or interacting (performing an indoor activity, having a conversation, doing assignments/administration, preparing a meal, cleaning up, and driving a car).
Table 1. Sketches of the nine ELAS situations.
Participants were asked to imagine an average week or day on which they come across the described situation, and to answer the subsequent questions regarding this situation. We encouraged them to mentally visualize the situations as much as they could and to respond to the questions even if they had no regular experience with a specific situation. For each situation, the same questions were asked about the different components of attention: sustained attention (“How long can you carry this out without having a break (so without a break or mind wandering)?”), focused attention (“How well can you focus on this?”), selective attention (“How well can you focus on this if there is distraction around you (e.g., children playing)?”), divided attention (“How well can you concentrate if you have to do something else at the same time (e.g., talking to a friend about a different subject)?”), motivation (“How motivated are you to perform the task well (so to take in all details)?”), effort (“How much effort does it cost you to perform well in this situation?”). Some questions did not fit with each situation, therefore the “divided attention” question was omitted from the situation referring to Reading, and the “sustained attention” question was omitted from the situation referring to Cooking. The participants indicated their level of attention on an 11-point Likert scale ranging from 0 to 100% with steps of 10%. Reference points were given by labeling the scale at the end points and the center. The scale was labeled at 0% (no focus/no concentration/ no motivation/ no effort), at 50% (50% of your focus on the task/50% of concentration/ motivated to perform the task 50% correctly/50% of all my effort), and at 100% (100% of your focus on the task/fully concentrate/ motivated to perform the task 100% correctly/all your effort). Only for the sustained attention questions, the participants indicated the duration of their unbroken attention on a sliding scale depicting minutes, ranging from 0 to 120 minutes. The sustained attention scores were recalculated to percentages of the total time ((score/120)x100). For the purpose of this validation study, the participants were also asked to indicate how often they encounter each situation (on a 9-point Likert scale, ranging from “never” to “several times a day”), and how important they find it to perform well in each situation (on a 5-point Likert scale ranging from “not at all important” to “very important”). Lastly some questions were asked about experiences of effortless attention that were not included in the present study.
The questionnaire was originally written in Dutch. Forward translations to English and German were performed by native speakers belonging to the research group.
Memory self-efficacy questionnaire (MSEQ)
A brief version of the MSEQ was included to find evidence for discriminant validity of the ELAS. The MSEQ aims to asses a person’s memory abilities in several everyday life situations (Berry, West, & Dennehy, Citation1989; West, Thorn, & Bagwell, Citation2003). In addition to the original English questionnaire, Dutch and German translations were used. The participants indicated whether they could do a specific memory task (e.g., “If a sick friend asked me to do 8 errands for her, I could remember to do all 8 errands”) and had to indicate their confidence on an 11-point Likert scale ranging from 0% (I cannot do it) to 100% (100% sure I can do it). In this brief version, four subscales were included: errand recall, shopping list recall, name recall, story recall. For each scale, five questions were asked, that were ordered hierarchically from high performance (all items remembered correctly) to low performance (only two items remembered correctly). The average amount of confidence across scales was used as a measure of Memory Efficacy. The reliability of (the brief versions of) the MSEQ appeared good in previous studies (Berry et al., Citation1989; West, Bagwell, & Dark-Freudeman, Citation2005) and a brief version was recently shown sensitive to measure memory complaints in adult patients with ADHD (Fuermaier et al., Citation2014). In our sample (n = 1184) the internal consistency of the MSEQ scale was high (Cronbach’s α = .92).
Barkley deficits in executive functioning scale (BDEFS)
Three out of the five subscales of the BDEFS were included to find evidence for discriminant validity of the ELAS. The BDEFS was developed to measure dimensions of executive functioning in daily life activities: Self-Management to Time, Self-Organization/Problem-Solving, Self-Discipline, Self-Motivation, and Self-Activation/Concentration (Barkley & Murphy, Citation2011). In addition to the original English questionnaire, Dutch and German translations were used. For the present study only the subscales Self-Management to Time, Self-Organization/Problem-Solving, and Self-Discipline were included. The subscale scores were used as measures of Executive Functioning in everyday life. Previous work indicated that the BDEFS scales have good reliability and have predictive validity for having ADHD (Barkley, Citation2011; Barkley & Murphy, Citation2011). In our sample (n = 1167) the internal consistency of the BDFES scales was high (Self-Management to Time: Cronbach’s α = .93; Self-Organization/Problem-Solving: Cronbach’s α = .93; Self-Discipline: Cronbach’s α = .89).
ADHD rating scale (ARS)
The ARS of current ADHD symptoms (during the past 6 months) and childhood ADHD symptoms (before the age of 12) was included to find evidence for construct validity of the ELAS. The ARS assesses the DSM-IV symptoms of ADHD (Kooij et al., Citation2005). In addition to the original Dutch questionnaire, English and German translations were used. The participant judges to what extent he or she meets (or in childhood met) the behavior symptoms of ADHD by rating 23 items on a 4-point Likert scale (0 = rarely or never, 1 = sometimes, 2 = often, 3 = very often). Inattention, hyperactivity/impulsivity and total sum scores were computed for current and for childhood symptoms. Previous studies demonstrated good reliability and validity for measurement of ADHD symptoms (Kooij et al., Citation2005; Kooij et al., Citation2008). In our sample (n = 1155 for current) the internal consistency of the ARS scales was high (ARS current: Cronbach’s α = .91; ARS childhood: Cronbach’s α = .95).
Statistical analyses
Confirmatory factor analysis
Factor analysis was performed with LISREL 8.8 (Jöreskog & Sörbom, Citation2006) in order to determine whether situation-specific factor models or multi-component attention models fit best to the assessment of attention in everyday life. Confirmatory factor analyses (CFA) were performed on a nine-factor model (situation-specific model with the nine situation sketches), a two-factor model (distinction between receptive and productive situations), a five-factor model (based on multicomponent model of attention as devised by van Zomeren & Brouwer, Citation1994), a three-factor model (based on a simplification of the multicomponent model of attention by van Zomeren & Brouwer, Citation1994), and a one-factor model (no differentiation between factors of attention). The item distributions of the competing models are presented in Appendix C. Maximum Likelihood (ML) estimation method was applied for all CFAs. Scaling of latent variables was achieved by setting the factor variance to 1. All analyses were carried out on the total sample of 1206 participants that considerably exceeds the criterion of a minimum sample size of 200 respondents for CFA (Hinkin, Citation1998).
The fit of the respective factor structure to the data was evaluated by the following statistics of CFA: Chi-Square value with corresponding p-value, normed Chi-Square (χ2/df), Root Mean Squared Error of Approximation (RMSEA), 90%-confidence interval (CI) of the RMSEA, Standardized Root Mean Square Residual (SRMR), and Comparative Fit Index (CFI). The Chi-Square value with its corresponding p-value belongs to the class of absolute fit indices (Hu & Bentler, Citation1999). Disadvantages of Chi-Square statistics are that both deviations from normality and large sample sizes may result in model rejection (Hooper, Coughlan, & Mullen, Citation2008). Therefore, less weight was given to the Chi-Square test than to the descriptive measure of the normed Chi-Square (Wheaton, Muthen, Alwin, & Summers, Citation1977). Recommendations for an acceptable ratio of the normed Chi-Square range from 5.0 to 2.0 with a good fit below a value of 3.0 (Hinkin, Citation1998; Hooper et al., Citation2008). Furthermore, the Root Mean Squared Error of Approximation (RMSEA) and a 90%-CI of the RMSEA were calculated (Steiger, Citation1990). There is consensus about an upper limit of RMSEA of .07 (Steiger, Citation2007) and of an upper limit of the CI of the RMSEA of less than .08 (Hooper et al., Citation2008). The Standardized Root Mean Square Residual (SRMR) ranges from 0 to 1 with acceptable models obtaining values up to .08 (Hu & Bentler, Citation1999). The Comparative Fit Index (CFI) is a revised version of the Non-Normed Fit Index (NNFI), also known as Tucker-Lewis Index (Bentler, Citation1990). There is an agreement that a CFI of > .90 to > .95 indicates a good model fit (Hu & Bentler, Citation1999). The goodness-of-fit statistics of the respective factor model were compared to the cut-offs and recommendations as previously cited. More importantly, the goodness-of-fit statistics were compared across the five models as previously suggested, in order to derive the best of the available approaches for the assessment of self-reported capacity of attention.
Scale descriptives
The scale descriptives were calculated to derive mean scores, standard deviations as a measure of variability, as well intercorrelations (Pearson’s correlations) between scale scores. Pearson’s correlation coefficients are interpreted according to Cohen’s (1988) categorization in terms of negligible (r < .1), small (0.1 < r < .3), medium (0.3 < r < .5), and large effects (r > .5).
Reliability
Scale reliability for each scale as well as the total set of items was assessed by Cronbach’s α as a measure of internal consistency. Test–retest reliability was determined on a retest period of 28 days by Pearson’s correlations.
Validity
Predictive validity was assessed by calculating Pearson’s correlations between the ELAS scores and self-reported levels of ADHD symptom severity. Discriminant validity was assessed by testing associations between ELAS scores and self-reported measures of memory and executive functioning. All associations were determined by Pearson’s correlation coefficients and were interpreted according to Cohen’s (Cohen, Citation1988) categorization in terms of negligible (r < .1), small (0.1 < r < .3), medium (0.3 < r < .5) and large effects (r > .5).
Results
Factor structure
presents goodness-of-fit statistics of all competing factor models. An inspection of fit indices revealed that none of the models yielded indices indicating a well-fitting model according to recommendations as previously suggested. However, a comparison of fit indices between models demonstrated that the nine-factor model (situation-specific approach) clearly outperformed the competing five-factor model (attentional components), three-factor model (attentional factors: intensity/selectivity), two-factor model (situational factors: receptive/productive), as well as the one-factor model (attention). Based on the comparison of the competing models, it was concluded that the situation-specific approach is most optimal for the assessment of self-reported attention in everyday life. Further analyses of the ELAS were therefore conducted on the situation-specific approach with nine factors.
Table 2. Fit indices of competing factor models, see Appendix C for a description of the models (study 1, N = 1206).
Scale descriptives and internal consistency
presents the internal consistencies (Cronbach’s α) of the derived scales. The scale reliabilities were mostly unsatisfactory, ranging from 0.50 to 0.70, but increased considerably when the mental effort items were excluded. also presents internal consistencies of the scales after these items were excluded, demonstrating mostly good internal consistency ranging from 0.77 to 0.87. Overall scale reliability of the entire set of items when excluding the effort items was excellent (Cronbach’s α = 0.93). It was therefore decided to exclude items describing mental effort from further analyses of the ELAS. After removal of the effort items the fit indices of the situation-specific 9-factor model improved, however still no satisfactory fit was obtained (χ2(866) = 11719, p < .001; χ2/df = 13.5; RMSEA = 0.14; CI-RMSEA = .14–.15; SRMR =.08; CFI =.86).
Table 3. Internal consistency (Cronbach’sα) and descriptive statistics of situation scales of the ELAS (study 1, N = 1206).
presents the descriptive statistics of the scale scores. An inspection of these scores revealed that the task demands differ across the situations presented, as indicated by a large variability of mean scores ranging from 47 to 77%. Furthermore, standard deviations of 17 to 20% per scale indicated a large degree of inter-individual variability in the respondents’ self-reported attention capacity per situation. The majority of intercorrelations between the situation scales was medium of size, but ranged from small to large size (). Only Lecture correlated strongly with Assignment. Small- to medium-sized associations between scales further supported a situation-specific differentiation in the assessment of self-reported capacity in attention.
Table 4. Intercorrelations (Pearson correlations) between the situation scales of the ELAS (study 1, N = 1206).
Most situations were on average encountered by the participants a couple of times per month or once a week, indicating that situations were picked that are frequently occurring for most people. Also, the participants regarded performing well in these situations on average as “neither important nor unimportant” to “somewhat important,” indicating that the situations were regarded as relevant. Most people regularly encountered the following situations: Movie, Activity, Conversation, Assignment, Cooking, and Cleaning up (at least a couple of times per year or more often). However, a substantial amount of participants (more than 10%) encountered the following situations only once per year or never: Reading, Lecture, and Driving.
Test–retest reliability
Test–retest reliability was assessed on 43 healthy individuals on a retest period of 28 days. Test–retest reliability was large for seven of the nine scales, Reading (r = .582; p < .001), Movie (r = .618; p < .001), Activity (r = .508; p = .001), Conversation (r = .591; p < .001), Assignment (r = .549; p < .001), Cleaning (r = .574; p < .001), and Driving (r = .673; p < .001). Medium sized correlations were found between the first and the second assessment for the scales Lecture (r = .477; p = .002) and Cooking (r = .320; p = .036).
Predictive and discriminant validity of subscale scores
Correlations of the subscales of the ELAS with measures for Memory Efficacy (MSEQ) and Executive Functioning (BDEFS) in everyday life, and self-reported ADHD symptoms (ARS) are depicted in . The correlations between the ELAS subscales and Memory Efficacy and Executive Functioning were small to medium in size, indicating that different cognitive functions of everyday life are being tested. Medium correlations were found between Reading as well as Assignment and two subscales of the BDEFS (Self-management to Time and Self-discipline). This indicates that higher attention ratings during Reading and Assignment are related to better Executive Functioning in everyday life.
Table 5. Pearson correlations between situation scales of the ELAS and measures for Memory Efficacy (MSEQ), Executive Functioning (BDEFS) in everyday life, and self-reported ADHD Symptoms (ARS) (study 1, N = 1206).
Unexpectedly, mostly small correlations were found between self-reported ADHD symptoms (both childhood and current) and the ELAS subscales. The correlations with inattention symptoms (small to medium in size) were, however, systematically stronger than the correlations with the hyperactive/impulsive symptoms (negligible in size). Again, only the situations Reading and Assignment showed medium correlations with self-reported ADHD symptoms, in particular with the inattention symptoms, indicating that participants with higher ADHD scores report lower attentional functioning in these situations. At the same time, ratings of Executive Functioning strongly correlated with self-reported ADHD symptoms (Self-management to Time: r = .599; p < .001; Problem solving: r = .619, p < .001; Self-discipline: r = 661, p < .001) but weakly with Memory Efficacy only (r = −.213, p < .001).
Predictive and discriminant validity of number of low attention scores (NLAS)
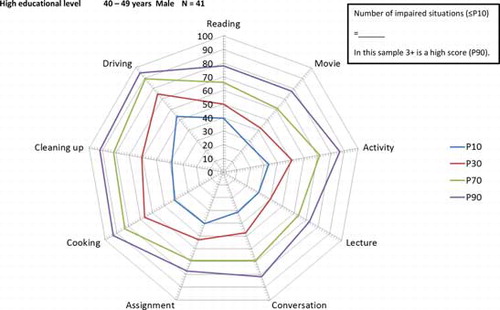
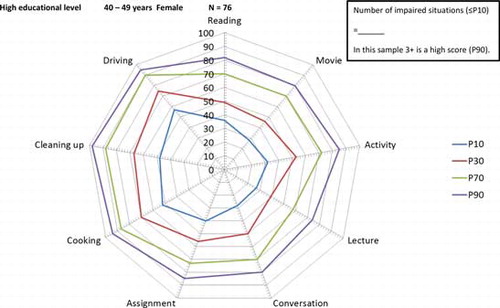
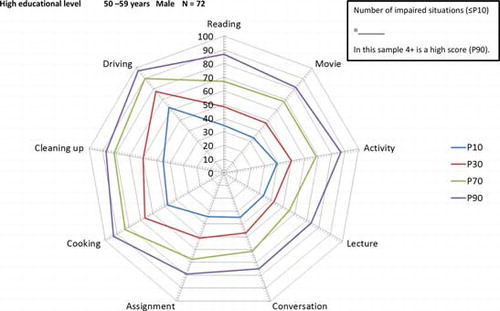
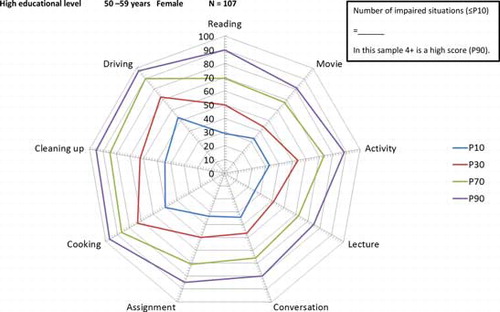
As the situation-specific approach clearly outperformed the one-factor structure, we chose not to calculate a total ELAS score. However, in order to gain insight into attention capacities across situations, we classified level of performance by means of a generally accepted categorization, using the criterion of below the 10th percentile for low performance (Lezak, Howieson, & Loring, Citation2004). First we calculated for each situation whether participants scored attention abilities of percentile 10 or lower compared to the whole sample, and then we counted the number of situations in which participants reported such low scores, resulting in a score for Number of Low Attention Situations (NLAS). Most participants had no low attention performance in any of the situations (mode = 0). The majority of participants (88%) scored low in two situations or less and the other twelve percent of the participants reported low attention performance in three situations or more.
See for the correlations between the NLAS score and the MSEQ, BDEFS, and ARS. NLAS had medium correlations with current ADHD symptoms. This correlation was stronger with inattention symptoms (medium correlations) than with hyperactive/impulsive symptoms (small correlations). Participants with higher NLAS scores also reported lower levels of Memory Efficacy and Executive Functioning, as indicated by mostly small- to medium sized correlations.
Interim discussion
We developed a questionnaire for the assessment of attention in everyday life that takes different situational contexts into account. The ELAS contains questions about several attentional capacities in a variety of situations, which are rated on a fine-grained scale of how much focus or unbroken time is spend on the task. Both situation-specific factor models and multi-component attention factor models were tested but none of them had an optimal fit. However, the best fitting model of attention in everyday life was the situation-specific approach, meaning that everyday attentional capacities can best be categorized by its contextual demand: Reading, Movie, Activity, Lecture, Conversation, Assignment, Cooking, Cleaning up, and Driving. Within each of these nine situations, ratings of attentional focus, concentration, motivation, and duration constituted reliable subscales. The items about mental effort had to be excluded to optimize the model fits. Exclusion of the effort items does not mean that mental effort is theoretically not associated with attention, however in this data-driven approach effort items do not contribute to the measurement of attention in everyday life. The situation-specific approach demonstrates that in everyday life situations, the different components of attention (vigilance/sustained attention, focused/selective attention, divided attention, but also motivation; van Zomeren & Brouwer, Citation1994) all blend together into the experience of attention. This is not surprising considering that people experience that they are, in comparison to others, unsuccessful in certain situations but not in specific sub-functions of attention which are difficult to comprehend and differentiate, particularly if there is overlap between functions (e.g., a divided attention task is also a sort of selective attention task). This finding is in line with early studies on the different components of attention by means of reaction time tests. Factor analyses with attention test scores revealed that not the attentional components determine the structure of abilities, but the characteristics of the task (van Zomeren & Brouwer, Citation1994):
If scores on tests of attention intercorrelated highly, it was often on the basis of task similarities not related to the variation of the requirement to focus, divide, or sustain attention such as stimulus or response modality or area of skill. If factor structure reflects the structure of abilities, then it appears that individual attentional abilities cannot be easily categorized in terms of focused, divided, and sustained attention. (p. 29).
Attentional capacities are therefore best described by performance on several tasks with different task demands. Our findings moreover indicated that attentional capacities between situations may vary independently, because the intercorrelations between the situation scales were small to medium in size. Furthermore, attention scores varied substantially between situations and ranged from averages of 47 to 77%, and within situations inter-individual differences were rather large (with standard deviations of 17 to 20%). The only situations highly correlating with each other were Lecture and Assignment, which may be regarded as situations with relatively high cognitive demands as often encountered in educational settings.
The ELAS proved to be a reliable measure with good internal consistency for each situation when items measuring mental effort were excluded. Also the test–retest reliability after four weeks was good for the majority of situations. Only for Lecture and Cooking the test–retest reliability was medium, which may point to attentional fluctuations across time or to different examples of these situations imagined during completion of the questions.
Investigation of the validity of the ELAS revealed that the situation-specific attention ratings were only weakly associated with other cognitive capacities of everyday life, including Memory Efficacy (measured by the MSEQ) and Executive Functioning (measured by the BDEFS). This could mean that situation-specific attention ratings are relatively independent of everyday life memory and executive functioning, and that different cognitive capacities are measured. However, the number of low attention situations on the ELAS did associate moderately with Memory Efficacy and Executive Functioning, which indicates that more pervasive attention impairments across situations does relate to poorer memory and executive functioning. This converges to findings that impairments in everyday life attention, memory, and executive functioning (in people with and without ADHD) can exist in combination, but also in isolation (Fuermaier et al., Citation2014). Other studies, however, question the distinctiveness of neuropsychological domains in everyday life cognitive functioning of patients with and without mental disorders, because items covering attention, memory, and executive functions strongly correlate (Beblo et al., Citation2010; Beblo, Kunz, Lautenbacher, Albert, & Aschenbrenner, Citation2012). This suggests that everyday attentional impairments can be expected to correlate to other domains of everyday cognitive functioning. Furthermore, two specific situations were also moderately associated with Executive Functioning (Self-management to Time and Self-discipline): Reading and Assignment. Attentional performance in these specific situations therefore relates to the person’s abilities to self-manage time and to be self-disciplined and -organized. Both attentional performance during these situations and executive functioning are crucial in educational settings and for academic achievement (e.g., Best, Miller, & Naglieri, Citation2011), which may explain their moderate correlation.
With regard to validity, we furthermore expected that ADHD symptoms in a non-patient sample would be associated with lower attention ratings in the situations included in the ELAS, which would be in favor of predictive validity. Against our predictions only small correlations were found. Interestingly, the two situations that loaded moderately on Executive Functioning (Reading and Assignment) were also moderately associated with current ADHD symptoms. This indicates that specifically those situations with a relatively high cognitive demand and which request more executive control are also more strongly associated with ADHD symptoms in a healthy sample. This is in favor of Barkley’s theory that ADHD is a disorder of executive functions (Barkley, Citation1997; Barkley & Murphy, Citation2011); lower attentional capacities in more cognitively demanding situations may therefore be secondary to executive dysfunctions. Medium correlations were also found between ADHD symptoms and the number of low attention situations, indicating that more pervasive impairments of attention are related to more ADHD symptoms, in particular to the inattention symptoms. This finding shows that pervasiveness of attentional impairment across situations is more predictive of ADHD symptoms in a healthy population than ratings of attention in single situations.
Our first investigation with the ELAS in a large healthy sample (N = 1206) thus suggests that the ELAS can reliably measure attention in everyday life by means of a situation-specific approach. The situation-specific factor structure of the ELAS is in line with the clinical neuropsychological recommendation that the attention of a patient should always be qualified in terms of the specific task and situation (Spikman & van Zomeren, Citation2010). Therefore, the ELAS could constitute a clinically relevant measure of attention in everyday life. Evidence for its validity is still limited as most situation scales correlated only weakly with ADHD symptoms in this healthy sample. However, pervasiveness of attentional impairment across situations appeared more predictive of inattention symptoms of ADHD, showing a moderate association. Based on this finding, it can be predicted that patients with ADHD would be characterized by more pervasive attentional impairments across situations. Additionally, those situations requesting more executive control, that is, Reading and Assignment, also had moderate associations with self-ratings of ADHD Symptoms of inattention. These situations can therefore be expected to be mostly impaired in patients with ADHD. In the second part of our study, it was our aim to further test the usefulness and the validity of the ELAS in the clinical evaluation of adult patients with ADHD and patients with mental disorders other than ADHD.
Study 2
Methods
Participants
Two clinical groups were included for participation in study 2, recruited via the inpatient and outpatient clinic of the Department of Psychiatry and Psychotherapy of the SHR clinic Karlsbad-Langensteinbach, Germany.
First, 80 adults diagnosed with ADHD were recruited in order to obtain a patient group with pronounced attention impairments as one of their primary clinical features (age: 32.2 ± 10.7 years, 37 females and 43 males, 11.2 ± 18 years of education). Patients were self-referred or referred from local psychiatrists or neurologists to the outpatient clinic. Diagnostic assessments were performed by experienced clinicians associated to the Department of Psychiatry and Psychotherapy and involved a clinical psychiatric interview based on DSM-IV criteria for ADHD (Barkley & Murphy, Citation1998), including both the retrospective assessment of childhood symptoms as well as current symptoms. All diagnoses were made by mutual agreement between at least two clinicians who were part of a diagnostic team and experienced in the assessment and treatment of adults with ADHD. The diagnostic assessment also included identifying objective impairments supporting the diagnosis of ADHD (e.g., evidence derived from school reports, failure in academic and/or occupational achievement) and comprised multiple informants, such as employer evaluation and partner- or parent-reports. Moreover, all patients with ADHD completed two standardized self-report rating scales designed to quantify current and retrospective ADHD symptoms. Childhood ADHD symptoms were self-rated on the short version of the Wender Utah Rating Scale (WURS-K) which includes 25 items rated on a 5-point scale (Ward, Wender, & Reimherr, Citation1993). Severity of current ADHD symptoms was self-rated with the ADHD self-report scale (Adler et al., Citation2006; Kessler et al., Citation2005) consisting of 18 items rated on a four-point scale corresponding to the diagnostic criteria of DSM-IV. Twenty patients with ADHD met DSM-IV criteria for ADHD—predominantly inattentive type, 2 patients met criteria for ADHD—hyperactive-impulsive type, and 58 patients met criteria for ADHD—combined type. Of the 80 patients with ADHD, 29 were diagnosed with one or more comorbid disorders, including mood disorders (n = 20), anxiety disorders (n = 9), personality disorders (n = 3), eating disorder (n = 1), post-traumatic stress disorder (PTSD) (n = 1), and substance abuse disorder (with no substance abuse in the previous 6 months) (n = 1). Twenty of the 80 patients with ADHD were treated with antidepressant medication for comorbid disorders. However, none of the patients with ADHD were treated yet for their ADHD symptoms, neither in the present nor in the past, that is, none of the patients with ADHD were treated with stimulant medication.
Second, a mixed clinical group of 56 patients diagnosed with one or more psychiatric disorders other than ADHD (age: 31.4 ± 8.8 years, 25 females and 31 males, 10.6 ± 1.6 years of education) was recruited at the inpatient and outpatient clinic of the Department of Psychiatry and Psychotherapy. The mixed clinical group did not differ from the ADHD group with respect to age, gender, and educational level. All patients of this group were formally diagnosed with at least one psychiatric disorder according to DSM-IV criteria, including psychotic disorders (n = 17), mood disorders (n = 31), anxiety and somatoform disorders (n = 8), personality disorders (n = 15), mental disorders due to psychoactive substances (n = 7), behavioral syndromes associated with physiological disturbances (n = 2), and developmental disorders (n = 2). However, none of the patients of the mixed clinical group met diagnostic criteria for ADHD in adulthood, or have been diagnosed with ADHD in their childhood. Thirty-three of the 56 patients of the mixed clinical group were currently treated with antidepressant and/or antipsychotic medication.
The two clinical groups as previously described were compared to a healthy control group of 80 individuals that were selected from the sample of study 1. These healthy participants were matched by age, gender, and educational level to the ADHD group and therefore the healthy control group had comparable demographic characteristics as the patient groups (age: 32.3 ± 11.2 years, 39 females and 41 males, 10.8 ± 1.5 years of education). The three groups did not differ significantly with regard to age (F(2,213) = 0.155, p = .857), gender (χ2(2) = 0.236, p = .888), or educational level (F(2,199) = 1.727, p = 0.181).
Materials
Participants of study 2 were requested to complete the ELAS as described in study 1.
Procedure
All participants were invited to take part in the study on a voluntary basis and received no reward for participation. It was pointed out to all patients that all data collected in the research project will be analyzed anonymously and will not affect clinical assessment and treatment. Participants were asked to fill out a paper version of the ELAS to the best of their knowledge and not to seek help from the examiner or to discuss questions or their responses. The study was approved by the medical ethical committee of the University of Heidelberg, Germany.
Statistical analysis
Groups/concurrent validity was determined by comparing ELAS scores of the healthy control group with the ADHD patient group and the mixed clinical group. Multivariate analysis of variance (MANOVA), followed by univariate comparisons for each situation scale score of the ELAS and the NLAS score was performed. Pairwise group differences were assessed by Tukey’s honest significant difference (HSD) post-hoc tests. A rigorous α-level of .01 was chosen in order to control for α-error growth in multiple comparisons. Furthermore, interpretations were largely based on effect sizes. Effect sizes were calculated to address factorial effects (η2) as well as pairwise mean differences (Cohen’s d). As described by Cohen (Citation1988), η2 is a function of the effect size index f, whereas a small effect size (f = .10) corresponds to η2 = .0099, a medium effect size (f = .25) to η2 = .0588 and a large effect size (f = .40) to η2 = .1379. For pairwise comparisons of means, negligible effects (d < 0.20), small effects (0.2 < d < 0.5), medium effects (0.5 < d < 0.8) and large effects (d > 0.8) were distinguished (Cohen, Citation1988). Predictive validity of the ELAS among patients with ADHD was determined by calculating associations between ELAS scale scores and self-reported levels of ADHD symptom severity, both currently and retrospectively in childhood.
Results
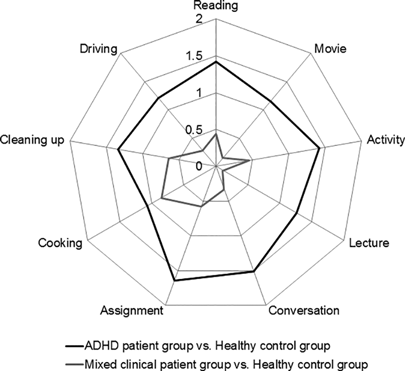
presents the descriptive statistics of the three groups for the ELAS situation scores and presents the effect sizes of group differences. The group differences are graphically presented in . MANOVA indicated a large effect of group membership on the ELAS situation scales in a multivariate comparison, Wilk’s lambda = 0.521, F(18,350) = 7.493, p < .001, η2 = .278. Univariate follow-up comparisons revealed significant large effects on each of the nine situations scales ( and ). Post-hoc pairwise comparisons (Tukey’s HSD) showed that patients with ADHD indicated significantly lower attention scores compared to the healthy control group on all scales. Although all effects were of large size as shown by effect sizes of greater than one standard deviation, effect sizes in the impaired range (Cohen’s d > 1.3) were observed on five scales: Reading, Activity, Conversation, Assignment, and Cleaning up.
Table 6. Comparison of situation scale scores (M ± SD) of the ELAS between healthy individuals (Control), a mixed clinical group (Clinical), and patients with ADHD (ADHD) (Study 2, N = 215).
Table 7. Effect sizes (Cohen’s d) of pairwise group comparisons on situation scale scores of the ELAS between a healthy control group (Control), a mixed patient group (Mixed), and an ADHD patient group (ADHD) (Study 2, N = 215).
Figure 1. Graphical impression of the effect sizes (Cohen’s d) of the group differences on situation scale scores of the everyday life attention scale (ELAS). Larger values stand for lower everyday attention scores compared to healthy controls (Study 2, N = 215).
When comparing patients with ADHD to the mixed clinical sample, it was found that patients with ADHD also scored significantly lower on all of the situation scales with exception of Cooking where no significant difference was found ( and ). Effect sizes of lower attentional capacities of patients with ADHD compared to the mixed clinical group were large for seven out of nine situation scales, with a medium effect observed for Cleaning up and a small effect for Cooking (). The mixed clinical group scored significantly lower than the healthy control group on three situation scales with effects ranging from medium to large size, i.e., in Assignment, Cooking, and Cleaning up. The remaining differences between the mixed clinical group and the healthy control group were nonsignificant and of negligible to small size ( and ).
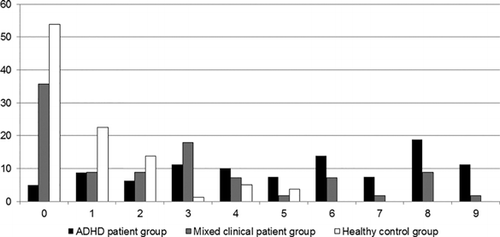
The mean Number of Low Attention Situations (NLAS; as compared to the normative data of study 1) discriminated the three groups very well with large effect sizes ( and ). More than half of the patients with ADHD (52%) reported impaired attention in five or more situations (median = 6), whereas only few people from the matched control group reported impaired attention in five situations (4%) and none reported more than five situations (median = 0). Also in the mixed clinical group, only a minority of patients (20%) reported impaired attention in five or more situations (median = 2). See for a frequency distribution of the NLAS measure.
Figure 2. Frequency distribution (in percentages) of patients with ADHD, mixed clinical patients and healthy controls across the number of low attention situations they reported (Study 2, N = 215).
presents the correlations between the ELAS situation scores and ratings of ADHD symptom severity in the ADHD patient group (n = 80). Correlations between ELAS situation scores and self-reported current ADHD symptoms were small to medium. The significance level was reached in six out of ten correlations, with the largest associations for Movie and Cleaning up. Nonsignificant correlations of mostly negligible size were found between ELAS scores and self-reported childhood ADHD symptoms.
Table 8. Pearson correlations between ELAS situation scores and self-reported ADHD symptom severity among patients with ADHD (Study 2, n = 80).
Discussion
The present study presented the ELAS and described its psychometric characteristics. The development of the ELAS was inspired by neuropsychological theory that categorizes attention into different components (van Zomeren & Brouwer, Citation1994) and clinical neuropsychology guidelines that recommend to measure attention in various different situations or tasks (Spikman & van Zomeren, Citation2010). The ELAS contains items that ask about multiple components of attention in nine common everyday situations. Different from other attention questionnaires, the items do not require the participants to self-judge whether their attention is impaired or unimpaired. Instead, reference labels are provided on an 11-point scale, depicting the unbroken attention span in minutes (0–120 min) and the focus on or commitment to the task in percentages (0–100%). This way of questioning allows the clinician to compare the score of the participant after the assessment to a norm value in order to determine the level of impairment. This “level of performance” approach is well-accepted in neuropsychological theory and practice (Lezak et al., Citation2004; Woods, Lovejoy, & Ball, Citation2002). Testing the psychometric properties of the ELAS revealed that attention in everyday life can be reliably measured by situation-specific scales (Study 1, see Interim discussion) and that these scales are sensitive for attentional difficulties in patients with ADHD (Study 2). The English version of the ELAS (excluding the effort items) is provided in Appendix A (a Dutch or German version is available on request with the authors) and the preliminary scoring and norm forms are provided in Appendix B.
In Study 1, we demonstrated in a large sample of healthy participants that attention ratings vary between contexts with different cognitive demands and that attention in everyday life should preferably be measured in a context-specific way. By means of factor analysis, we found nine reliable situation scales of the ELAS for Reading, Movie, Activity, Lecture, Conversation, Assignment, Cooking, Cleaning up, and Driving. Each of these situation scales was constituted by self-ratings of sustained, focused, selective, and divided attention as well as motivation during these situations. Although none of the tested factor models had satisfactory fits, the factor structure with the nine situations had the most optimal fit compared to categorizations that were based on attentional components. Even though the situation-specific model fit was not satisfactory, it seems to be the most valid way for the assessment of attention, given the heterogeneous ways of asking for attention in the clinic and in research. Reliability analyses furthermore pointed out that the situation-specific scales can be used independently from each other for evaluation of attentional capacities, because the inter-correlations were generally small to medium. The situation-specific attention ratings were relatively independent of other everyday life cognitive capacities, including Memory Efficacy (measured by the MSEQ) and Executive Functioning (measured by the BDEFS). Only the situations Reading and Assignment loaded moderately on Executive Functioning, which indicates that these are relatively more cognitively demanding situations. These situations are common in educational settings and attention performance in these situations as well as executive functioning may share a role in academic achievement (Best et al., Citation2011). A weakness of the present study is that no other attention scale was included for the confirmation of convergent validity, and therefore future studies should validate the ELAS with other attention scales and tests. Evidence for predictive validity of single situation scales for ADHD symptoms in a healthy sample was limited. Only the two situation scales loading moderately on Executive Functioning (Reading and Assignment) had moderate associations with self-reported inattention symptoms of ADHD (see Interim discussion). Also, the number of situations in which healthy participants reported low attention performance (<10th percentile of the total group) appeared to be moderately associated with inattention symptoms of ADHD, as well as with Memory Efficacy and Executive Functioning. Pervasiveness of low attention scores across situations is therefore more predictive of ADHD-symptoms than attention scores in single situations (except for Reading and Assignment). Based on these findings, we predicted that adult patients with ADHD would obtain lower attention scores on the ELAS situations, particularly in the cognitively demanding situations (i.e., Reading and Assignment), and would have more pervasive impairments across situations compared to healthy controls and psychiatric patients without severe attention deficits (without ADHD).
In Study 2 we indeed found convincing evidence that adult patients with ADHD have clearly reduced attention scores (with large effect sizes) on all nine situation scales of the ELAS compared to matched healthy controls. Instead, a mixed clinical group of psychiatric patients (including depression and schizophrenia) without ADHD deviated from the healthy sample only on three situations with medium to large effect sizes (Assignment, Cooking, and Cleaning up). Patients with ADHD showed particularly strong attentional difficulties in comparison to both the control and the mixed clinical group in the following situations: Reading, Assignment, Activity, and Conversation. The ELAS appears to be a sensitive measure for ADHD-related attentional difficulties particularly for these four situations. It would, therefore, be advisable for clinicians to elaborate on these situations in interviews in the process of diagnosing ADHD. Furthermore, only a minority of patients with mixed psychiatric problems without ADHD reported impaired attention scores in five or more situations, whereas more than half of the patients with ADHD indicated impaired attention scores in five situations or more. This finding demonstrates that patients with ADHD experience attentional difficulties in everyday life that are much more pervasive across situations than in patients with other psychiatric conditions (see for a graphical impression). These findings are in line with previous findings of large reductions of self-reported attentional functioning in adults with ADHD as compared to a healthy comparison group, with the majority of patients falling in the impaired range (scores below the 10th percentile; Fuermaier et al., Citation2014). On top of information from regular attention questionnaires, the ELAS adds additional information about the pervasiveness of the everyday attentional difficulties across situations. Furthermore, the ELAS situation scales correlated only weakly to moderately with self-reported ADHD symptom severity, which may indicate that the ELAS assesses attentional capacities that are not captured by symptom scales that are routinely used in the diagnostic process of ADHD. As the ELAS demonstrated high sensitivity for attentional difficulties in patients with ADHD, we conclude that its use may provide additional, nonredundant information for the clinical evaluation of adults with ADHD. As this is the first description of the psychometric properties of the ELAS, its validity and sensitivity should be replicated in ADHD patient groups and further tested in different patient groups with psychiatric disorders or neurological damage.
Clinical implications
The ELAS proved to be a reliable and sensitive measure for attentional difficulties in adult patients with ADHD. Although its validity should be further tested, the ELAS has the potential to add relevant information to the clinical evaluation of inattention symptoms and impairments of adults with ADHD, as well as to treatment planning. The situation-specific approach provides important qualitative and quantitative insights into the attentional functioning of a patient in different situations of everyday life. This information can be relevant in the diagnostic process, because the diagnostic criteria of ADHD require pervasiveness of the symptoms across settings (American Psychiatric Association, Citation2013). However, the ELAS has not been developed to diagnose ADHD; it may complement to existing diagnostic tools (see limitations section). Situation-specific everyday attention profiles may furthermore inform treatment choice. For example, severe global attentional impairments across situations might require slow-release stimulant medication that remains active during the entire day, whereas more selective attentional impairments in specific situations can be targeted with short-release stimulant medication aimed at improving specific situations. In a similar way, psychosocial interventions can be selected to specifically address those situations with the most impairment and relevance for the patient. The ELAS could subsequently be used as a treatment evaluation tool, in order to see whether treatment improved attentional functioning in the targeted situations. The ELAS appeared suitable for retesting, as its test-retest reliability in a healthy sample was good (except for Lecture and Cooking). Also, the “level of performance approach” of determining impairment might be especially useful for retesting because patients are not asked to self-judge their level of impairment, which makes the ELAS less susceptible for subjective bias. There is a necessity for measures of attention that can be reliably used for treatment evaluation, because existing evaluation tools have their limitations. For example, objective tests for attention often have low test-retest reliability (particularly accuracy measures) or are highly susceptible to practice effects (particularly speed measures) (Fernández-Marcos, de la Fuente, & Santacreu, Citation2017). Existing self-report scales for attention may have too narrow Likert scales to be able to detect (subtle) changes after treatment, even though they can be suitable for discriminating the presence of attention problems. As the ELAS has a fine-grained scale (11 points) it might be more sensitive than other attention scales as an evaluative measure, because the detection of changes in health outcomes requires such fine-grained scales (Kirshner & Guyatt, Citation1985). Clinical research with the ELAS is necessary to evaluate its usefulness for choice of treatment and treatment evaluation.
Attentional impairments are only one aspect of the neuropsychological functioning of patients with ADHD. Previous work on adults with ADHD found support for a neuropsychological profile that can be characterized by impairments in simple as well as complex attention, (especially verbal) working memory, (especially verbal) executive functioning/problem solving, and response variability (see for meta-analytic reviews: Alderson, Kasper, Hudec, & Patros, Citation2013; Boonstra, Oosterlaan, Sergeant, & Buitelaar, Citation2005; Hervey, Epstein, & Curry, Citation2004; Schoechlin & Engel, Citation2005). Not one cognitive function is specifically predictive for the diagnosis of ADHD, and accordingly neuropsychological assessment will be most sensitive when the battery approach is taken, i.e., when a broad array of attentional and executive function tests is included (Woods et al., Citation2002). The ELAS may constitute a good option for assessing attentional difficulties as part of such a battery approach, in combination with assessments of other cognitive functions as well as interviews about symptoms of ADHD. One particular strength of the ELAS compared to regular attention tests and questionnaires is that it provides information regarding the pervasiveness of attentional impairments across situations, which in this study was uniquely impaired in patients with ADHD in comparison to other psychiatric patients.
Thus, the ELAS has not been developed for diagnosing ADHD on its own, but to assess attention capacities/impairments of adults with ADHD as part of a battery approach. This can be helpful for a thorough assessment of strengths and weaknesses in daily life, to quantify attention problems experienced in daily life, and for treatment planning and evaluation. It should, therefore, be complemented by self- and informant reports for the assessment of symptoms and impairments related to ADHD as well as by measures of symptom and performance validity in order to determine the credibility of clients. This is relevant as it has been demonstrated that a considerable proportion of individuals at clinical evaluation of adults with ADHD show noncredible performance and symptom reporting (e.g., Fuermaier et al., Citation2017; Marshall, Hoelzle, Heyerdahl, & Nelson, Citation2016; L. Tucha, Fuermaier, Koerts, Groen, & Thome, Citation2015).
Limitations
The results of this study have to be viewed in the light of several limitations. Factor analysis of the ELAS could not obtain satisfactory fits for any of the proposed models; however, the best fit available was obtained by the situation-specific approach consisting of nine factors. The scale reliability and fit indices improved after removal of the effort items. Future studies should further validate the ELAS excluding the effort items, preferably with patient samples. When including patient samples, medication intake should be controlled for; our ADHD patient sample was medication-free, but more than half of the patients with other psychiatric conditions received antidepressants or antipsychotics which may have caused an underestimation of their attention problems. Even though the fit indices of the ELAS were not perfect, the data support the notion that a situation-specific approach is the best available way to quantify attention in everyday life. The present study did not include other questionnaires or tests of attention and therefore evidence for convergent validity should be further explored. Even though further validation is important we do not expect strong associations between ELAS scores and cognitive test performance, as previous studies showed weak associations between self-ratings of cognitive functioning and objective test performance in several aspects of cognition (e.g., Fuermaier et al., Citation2015). Both types of measures therefore provide unique information that may complement each other in the clinical assessment. Furthermore, for testing predictive and discriminant validity in the healthy participants sample (n = 1206) we only included self-report questionnaires which suffer from the same limitations that we criticized in the introduction section, that is, the use of Likert scales with unclear reference points and disregard of context. We could not find good alternatives that were also time efficient, which was the reason for the development of the ELAS in the first place. For future studies it is recommended to use a more thorough assessment of cognitive functions and ADHD symptoms by means of performance tests and/or (semi)structured interviews. The included samples represented mostly average to highly educated people, and therefore the findings cannot be generalized to people with low education. More normative data of people with lower education needs to be collected. It is also necessary to collect more normative data per language area (Dutch, German, English) or nationality in order to have representative samples. As the original Dutch ELAS was only translated forward, it is recommended to validate the German and English versions by backward translation before further validation.
Acknowledgments
We are grateful to Katinka de Vries for her contribution in the development of the questionnaire during the early pilot phase of the study. We furthermore thank the clinicians at the SHR clinic for supporting the recruitment of patients. Lastly, we are thankful of the participants for their voluntary contribution of time and effort to this research.
References
- Adler, L., Spencer, T., Faraone, S., Kessler, R., Howes, M., Biederman, J., & Secnik, K. (2006). Validity of pilot adult ADHD Self-Report Scale (ASRS) to rate adult ADHD symptoms. Annals of Clinical Psychiatry, 18(3), 145–148.
- Alderson, R. M., Kasper, L. J., Hudec, K. L., & Patros, C. H. G. (2013). Attention-deficit/hyperactivity disorder (ADHD) and working memory in adults: A meta-analytic review. Neuropsychology, 27(3), 287–302. doi:10.1037/a0032371
- American Psychiatric Association. (2013). Diagnostic and statistical manual of mental disorders (5th ed.). Arlington, VA: American Psychiatric Publishing.
- Barkley, R. A. (1997). Behavioral inhibition, sustained attention, and executive functions: Constructing a unifying theory of ADHD. Psychological Bulletin, 121(1), 65–94.
- Barkley, R. A. (2011). Barkley Deficits in Executive Functioning Scale (BDEFS for adults). New York, NY: Guilford Press.
- Barkley, R. A., & Murphy, K. R. (1998). Attention-deficit hyperactivity disorder: A clinical workbook. New York, NY: Guilford.
- Barkley, R. A., & Murphy, K. R. (2011). The nature of executive function (EF) deficits in daily life activities in adults with ADHD and their relationship to performance on EF tests. Journal of Psychopathology and Behavioral Assessment, 33(2), 137–158. doi:10.1007/s10862-011-9217-x
- Beblo, T., Kunz, M., Brokate, B., Scheurich, A., Weber, B., Albert, A., … Lautenbacher, S. (2010). Construction of a questionnaire for complaints of cognitive disturbances in patients with mental disorders. Zeitschrift für Neuropsychologie, 21, 143–151. doi:10.1024/1016-264X/a000013
- Beblo, T., Kunz, M., Lautenbacher, S., Albert, S., & Aschenbrenner, S. (2012). Vienna test system (VTS): Mental ability questionnaire (FLei). Vienna, Austria: Schuhfried.
- Bentler, P. M. (1990). Comparative fit indexes in structural models. Psychological Bulletin, 107(2), 238–246. doi:10.1037/0033-2909.107.2.238
- Berry, J. M., West, R. L., & Dennehy, D. M. (1989). Reliability and validity of the self-efficacy questionnaire. Developmental Psychology, 25, 701–713.
- Best, J. R., Miller, P. H., & Naglieri, J. A. (2011). Relations between executive function and academic achievement from ages 5 to 17 in a large, representative national sample. Learning and Individual Differences, 21(4), 327–336.
- Boonstra, A., Oosterlaan, J., Sergeant, J., & Buitelaar, J. (2005). Executive functioning in adult ADHD: A meta-analytic review. Psychological Medicine, 35(8), 1097–1108. doi:10.1017/S003329170500499X
- Broadbent, D. E., Cooper, P. F., Fitzgerald, P., & Parkes, K. R. (1982). The cognitive failures questionnaire (cfq) and its correlates. British Journal of Clinical Psychology, 21, 1–16.
- Caterino, L. C., Gomez-Benito, J., Balluerka, N., Amador-Campos, J. A., & Stock, W. A. (2009). Development and validation of a scale to assess the symptoms of attention-deficit/hyperactivity disorder in young adults. Psychological Assessment, 21(2), 152–161. doi:10.1037/a0015577
- Coghill, D., & Sonuga-Barke, E. J. S. (2012). Annual research review: Categories versus dimensions in the classification and conceptualisation of child and adolescent mental disorders – implications of recent empirical study. Journal of Child Psychology and Psychiatry, 53(5), 469–489. doi:10.1111/j.1469-7610.2011.02511.x
- Cohen, J. (1988). Statistical power analysis for the behavioral sciences (2nd ed.). Hillsdale, NJ.
- Conners, C. K. (1999). Clinical use of rating scales in diagnosis and treatment of attention-deficit/hyperactivity disorder. Pediatric Clinics of North America, 46(5), 857–870.
- DuPaul, G., Anastopoulos, A., Power, T., Reid, R., Ikeda, M., & McGoey, K. (1998). Parent ratings of attention-deficit/hyperactivity disorder symptoms: Factor structure and normative data. Journal of Psychopathology and Behavioral Assessment, 20(1), 83–102. doi:10.1023/A:1023087410712
- DuPaul, G., Schaughency, E., Weyandt, L., Tripp, G., Kiesner, J., Ota, K., & Stanish, H. (2001). Self-report of ADHD symptoms in university students: Cross-gender and cross-national prevalence. Journal of Learning Disabilities, 34(4), 370–379. doi:10.1177/002221940103400412
- Fernández-Marcos, T., de la Fuente, C., & Santacreu, J. (2017). Test–retest reliability and convergent validity of attention measures. Applied Neuropsychology: Adult, 1–9. doi:10.1080/23279095.2017.1329145
- Fuermaier, A. B. M., Tucha, L., Koerts, J., Aschenbrenner, S., Kaunzinger, I., Hauser, J., … Tucha, O. (2015). Cognitive impairment in adult ADHD-perspective matters! Neuropsychology, 29(1), 45–58. doi:10.1037/neu0000108
- Fuermaier, A. B. M., Tucha, L., Koerts, J., Aschenbrenner, S., Weisbrod, M., Lange, K. W., & Tucha, O. (2014). Cognitive complaints of adults with attention deficit hyperactivity disorder. Clinical Neuropsychologist, 28(7), 1104–1122. doi:10.1080/13854046.2014.964325
- Fuermaier, A. B. M., Tucha, O., Koerts, J., Butzbach, M., Weisbrod, M., Aschenbrenner, S., & Tucha, L. (2017). Susceptibility of impairment scales to noncredible responses in the clinical evaluation of adult ADHD. Clinical Neuropsychologist, doi:10.1080/13854046.2017.1406143
- Hervey, A., Epstein, J., & Curry, J. (2004). Neuropsychology of adults with attention-deficit/hyperactivity disorder: A meta-analytic review. Neuropsychology, 18(3), 485–503. doi:10.1037/0894-4105.18.3.485
- Hinkin, T. R. (1998). A brief tutorial on the development of measures for use in survey questionnaires. Organizational Research Methods, 1(1), 104–121. doi:10.1177/109442819800100106
- Hooper, D., Coughlan, J., & Mullen, M. R. (2008). Structural equation modelling: Guidelines for determining model fit. Electronic Journal of Business Research Methods, 6(1), 53–60.
- Hu, L. T., & Bentler, P. M. (1999). Cutoff criteria for fit indexes in covariance structure analysis: Conventional criteria versus new alternatives. Structural Equation Modeling-a Multidisciplinary Journal, 6(1), 1–55. doi:10.1080/10705519909540118
- Ickowicz, A., Schachar, R., Sugarman, R., Chen, S., Millette, C., & Cook, L. (2006). The parent interview for child symptoms: A situation-specific clinical research interview for attention-deficit hyperactivity and related disorders. Canadian Journal of Psychiatry-Revue Canadienne De Psychiatrie, 51(5), 325–328.
- Jöreskog, K. G., & Sörbom, D. (2006). LISREL 8.8 for windows. Lincolnwood, IL: Scientific Software International.
- Kahneman, D. (1973). Attention and effort. Englewood Cliffs, NJ: Prentice-Hall.
- Kessler, R., Adler, L., Ames, M., Demler, O., Faraone, S., Hiripi, E., … Walters, E. E. (2005). The world health organization adult ADHD Self-Report Scale (ASRS): A short screening scale for use in the general population. Psychological Medicine, 35(2), 245–256.
- Kirshner, B., & Guyatt, G. (1985). A methodological framework for assessing health indexes. Journal of Chronic Diseases, 38(1), 27–36. doi:10.1016/0021-9681(85)90005-0
- Koerts, J., Tucha, L., Leenders, K. L., van Beilen, M., Brouwer, W. H., & Tucha, O. (2011). Subjective and objective assessment of executive functions in Parkinson’s disease. Journal of the Neurological Sciences, 310(1–2), 172–175. doi:10.1016/j.jns.2011.07.009
- Kooij, J. J. S., Bejerot, S., Blackwell, A., Caci, H., Casas-Brugué, M., Carpentier, P. J., … Gaillac, V. (2010). European consensus statement on diagnosis and treatment of adult ADHD: The European network adult ADHD. BMC Psychiatry, 10, 67. doi:10.1186/1471-244X-10-67
- Kooij, J. J. S., Boonstra, A. M., Swinkels, S. H. N., Bekker, E. M., de Noord, I., & Buitelaar, J. K. (2008). Reliability, validity, and utility of instruments for self-report and informant report concerning symptoms of ADHD in adult patients. Journal of Attention Disorders, 11(4), 445–458. doi:10.1177/1087054707299367
- Kooij, J. J. S., Buitelaar, J. K., van, D. O., Furer, J. W., Rijnders, C. A. T., & Hodiamont, P. P. G. (2005). Internal and external validity of attention-deficit hyperactivity disorder in a population-based sample of adults. Psychological Medicine, 35(6), 817–827. doi:10.1017/S003329170400337X
- Lezak, M. D., Howieson, D. B., & Loring, D. W. (Eds.). (2004). Neuropsychological assessment (4th ed.). Oxford, UK: Oxford University Press.
- Luman, M., Tripp, G., & Scheres, A. (2010). Identifying the neurobiology of altered reinforcement sensitivity in ADHD: A review and research agenda. Neuroscience and Biobehavioral Reviews, 34(5), 744–754.
- Marshall, P. S., Hoelzle, J. B., Heyerdahl, D., & Nelson, N. W. (2016). The impact of failing to identify suspect effort in patients undergoing adult attention-deficit/hyperactivity disorder (ADHD) assessment. Psychological Assessment, 28(10), 1290–1302. doi:10.1037/pas0000247
- Ponsford, J., & Kinsella, G. (1991). The use of a rating scale of attentional behaviour. Neuropsychological Rehabilitation, 1, 241–257.
- Posner, M. I., & Rafal, R. D. (1987). Cognitive theories of attention and the rehabilitation of attentional deficits. In M. J. Meier, A. Benton & L. Diller (Eds.), Neuropsychological rehabilitation (pp. 182–201). New York, NY: Guilford Press.
- Qualtrics. (2005). Qualtrics software. (2012th ed.). Provo, UT: Author. Retrieved from http://www.qualtrics.com.
- Salthouse, T., & Siedlecki, K. (2005). Reliability and validity of the divided attention questionnaire. Aging Neuropsychology and Cognition, 12(1), 89–98. doi:10.1080/13825580590925143
- Schepers, J. M. (2007). The construction and evaluation of an attention questionniare. SA Journal of Industrial Psychology, 33(2), 16–24. doi:10.4102/sajip.v33i2.373
- Schoechlin, C., & Engel, R. (2005). Neuropsychological performance in adult attention-deficit hyperactivity disorder: Meta-analysis of empirical data. Archives of Clinical Neuropsychology, 20(6), 727–744. doi:10.1016/j.acn.2005.04.005
- Shallice, T. (1982). Specific impairments of planning. In D. E. Broadbent, & L. Weiskrantz (Eds.), The neuropsychology of cognitive function (pp. 199–209). London, UK: The Royal Society.
- Spikman, J., & van Zomeren, E. (2010). Assessment of attention. In J. Gurd, U. Kischka & J. Marshall (Eds.), The handbook of clinical neuropsychology (2nd ed., pp. 81–96). Oxford, UK: Oxford University Press.
- Steiger, J. H. (1990). Structural model evaluation and modification - An interval estimation approach. Multivariate Behavioral Research, 25(2), 173–180. doi:10.1207/s15327906mbr2502_4
- Steiger, J. H. (2007). Understanding the limitations of global fit assessment in structural equation modeling. Personality and Individual Differences, 42(5), 893–898. doi:10.1016/j.paid.2006.09.017
- Suslow, T., Arolt, V., & Junghanns, K. (1998). Differential validity of the fragebogen erblebter defizite der aufmerksamkeit, an attention deficit instrument - Concurrent validation results with schizophrenic and depressive patients. Zeitschrift Fur Klinische Psychologie Psychiatrie Und Psychotherapie, 46(2), 152–165.
- Taylor, A., Deb, S., & Unwin, G. (2011). Scales for the identification of adults with attention deficit hyperactivity disorder (ADHD): A systematic review. Research in Developmental Disabilities, 32(3), 924–938. doi:10.1016/j.ridd.2010.12.036
- Tucha, L., Fuermaier, A. B. M., Koerts, J., Groen, Y., & Thome, J. (2015). Detection of feigned attention deficit hyperactivity disorder. Journal of Neural Transmission, 122, 123–134. doi:10.1007/s00702-014-1274-3
- Tucha, L., Tucha, O., Laufkötter, R., Walitza, S., Klein, H. E., & Lange, K. W. (2008). Neuropsychological assessment if attention in adults with different subtypes of attention-deficit/hyperactivity disorder. Journal of Neural Transmission, 115(2), 269–278.
- Tucha, O., Walitza, S., Mecklinger, L., Sontag, T. A., Kübber, S., Linder, M., & Lange, K. W. (2006). Attentional functioning in children with ADHD — Predominantly hyperactive-impulsive type and children with ADHD — combined type. Journal of Neural Transmission, 113(12), 1943–1953.
- van Zomeren, A. H., & Brouwer, W. (1994). Clinical neuropsychology of attention. New York, NY: Oxford University Press.
- Ward, M. F., Wender, P. H., & Reimherr, F. W. (1993). The Wender Utah Rating Scale — An aid in the retrospective diagnosis of childhood attention-deficit hyperactivity disorder. American Journal of Psychiatry, 150(6), 885–890.
- West, R. L., Bagwell, D. K., & Dark-Freudeman, A. (2005). Memory and goal setting: The response of older and younger adults to positive and objective feedback. Psychology and Aging, 20(2), 195–201.
- West, R. L., Thorn, R. M., & Bagwell, D. K. (2003). Memory performance and beliefs as a function of goal setting and aging. Psychology and Aging, 18(1), 111–125.
- Wheaton, B., Muthen, B., Alwin, D. F., & Summers, G. (1977). Assessing reliability and stability in panel models. Sociological Methodology, 8(1), 84–136.
- Woods, S. P., Lovejoy, D. W., & Ball, J. D. (2002). Neuropsychological characteristics of adults with ADHD: A comprehensive review of initial studies. The Clinical Neuropsychologist, 16(1), 12–34. doi:10.1076/clin.16.1.12.8336
Appendix A
Date:
Age (years):
Sex: male / female / different
Highest level of education, attested with a diploma:
Everyday Life Attention Scale
This questionnaire sketches nine situations in everyday life: reading a book, watching a movie or documentary, performing an indoor activity, attending a lecture or open evening, having a conversation, doing an assignment/ administration, preparing a meal, tidying up the house, and driving a car.
When reading the description of the situation, please imagine an average week or day on which you come across a similar situation.
The questions beneath each described situation are about that specific situation. Whenever a new situation is described, all the questions pertain to the new situation.
We ask you to mentally visualize the situations as much as you can and to fill out an answer even if you do not regularly experience a situation.
Situation A: Reading a book
You are reading a book of average interest (if you never read a book imagine reading something else like an abstract, manual or guidelines) and have two hours to do some reading.
A1. How long can you carry this out without having a break (so without a break or mind wandering)? (Please mark the correct number of minutes)
A2. How well can you focus on this?
A3. How well can you focus on this if there is distraction around you (e.g., children playing)?
A5. How motivated are you to perform the task well (so to take in all details)?
Situation B: Watching a movie/documentary
You want to see a movie or documentary of average interest that lasts for two hours.
B1. How long can you carry this out without having a break (so without a break or mind wandering)? (Please mark the correct number of minutes.)
B2. How well can you focus on this?
B3. How well can you focus on this if there is distraction around you (e.g., children playing)?
B4. How well can you concentrate if you have to do something else at the same time (e.g., talking to a friend about a different subject)?
B5. How motivated are you to perform the task well (so to take in all details)?
Situation C: Performing an indoor activity
You have two hours to perform an indoor activity of average interest (e.g., board game, handcrafting, solving a puzzle).
C1. How long can you carry this out without having a break (so without a break or mind wandering)? (Please mark the correct number of minutes.)
C2. How well can you focus on this?
C3. How well can you focus on this if there is distraction around you (e.g., children playing)?
C4. How well can you concentrate if you have to do something else at the same time (e.g., talking to a friend about a different subject)?
C5. How motivated are you to perform the task well (so to take in all details)?
Situation D: Attending lecture or open evening
You are attending a lecture or open evening of average interest which lasts for two hours.
D1. How long can you carry this out without having a break (so without mind wandering or doing something else)? (Please mark the correct number of minutes.)
D2. How well can you focus on this?
D3. How well can you focus on this if there is distraction around you (e.g., other people talking to each other)?
D4. How well can you concentrate if you have to do something else at the same time (e.g., texting a friend)?
D5. How motivated are you to perform the task well (so to take in all details)?
Situation E: Having a conversation
You are having a conversation with a person of average interest for which you have two hours of time.
E1. How long can you carry this out without having a break (so without a break or mind wandering)? (Please mark the correct number of minutes.)
E2. How well can you focus on this?
E3. How well can you focus on this if there is distraction around you (e.g., children playing)?
E4. How well can you concentrate if you have to do something else at the same time (e.g., texting a friend)?
E5. How motivated are you to perform the task well (so to take in all details)?
Situation F: doing an assignment/administration
You have two hours to work on an assignment of average interest, consisting of several steps and for which you have to think (e.g., administration or an assignment for a training).
F1. How long can you carry this out without having a break (so without a break or mind wandering)? (Please mark the correct number of minutes.)
F2. How well can you focus on this?
F3. How well can you focus on this if there is distraction around you (e.g., children playing)?
F4. How well can you concentrate if you have to do something else at the same time (e.g., texting a friend)?
F5. How motivated are you to perform the task well (so to take in all details)?
Situation G: Preparing a meal
You are preparing a meal for some people visiting you (meat/vegetables/potatoes).
G2. How well can you focus on this?
G3. How well can you focus on this if there is distraction around you (e.g., children playing)?
G4. How well can you concentrate if you have to do something else at the same time (e.g., talking to a friend about a different subject)?
G5. How motivated are you to perform the task well (so to take in all details)?
Situation H: Cleaning up
Your home is a mess and you decide it’s time to start cleaning up. You have two hours.
H1. How long can you carry this out without having a break (so without a break or mind wandering)? (Please mark the correct number of minutes.)
H2. How well can you focus on this?
H3. How well can you focus on this if there is distraction around you (e.g., children playing)?
H4. How well can you concentrate if you have to do something else at the same time (e.g., texting a friend)?
H5. How motivated are you to perform the task well (so to take in all details)?
Situation I: Driving a car
You are driving a car and are on your way to a destination where you have never been before. The drive takes two hours.
I1. How long can you carry this out without having a break (so without a break or mind wandering)? (Please mark the correct number of minutes.)
I2. How well can you focus on this?
I3. How well can you focus on this if there is distraction around you (e.g., people talking to each other in the back of the car)?
I4. How well can you concentrate if you have to do something else at the same time (e.g., talking to your passenger about a different subject)?
I5. How motivated are you to perform the task well (so to take in all details)?
Appendix B
Everyday Life Attention Scale (ELAS) Scoring and Norm forms
Step 1: Calculate the situation scores
Step 2: Determine the right norm form
Determine the best norm sample to compare to the individual situation scores. Look up the page with the norm form of your choice, print it out, mark the situation scores in the norm form, and connect the lines. < P10 = low /impaired; <P30 = low average; <P70 = average; <P90 = high average; P90 + = high. Note the number of impaired situations.