
Abstract
Background
Despite the bourgeoning of digital tools for bioethics research, education, and engagement, little research has empirically investigated the impact of interactive visualizations as a way to translate ethical frameworks and guidelines. To date, most frameworks take the format of text-only documents that outline and offer ethical guidance on specific contexts. This study’s goal was to determine whether an interactive-visual format supports frameworks in transferring ethical knowledge by improving learning, deliberation, and user experience.
Methods
An experimental comparative study was conducted with a pre-, mid-, and post-test design using the online survey platform Qualtrics. Participants were university based early-stage health researchers who were randomly assigned to either the control condition (text-only document) or the experimental condition (interactive-visual). The primary outcome variables were learning, (measured using a questionnaire), deliberation (using cases studies) and user experience (measured using the SED/UD Scale). Analysis was conducted using descriptive statistics and mixed-effects linear regression.
Results
Of the 80 participants, 44 (55%) used the text-only document and 36 (45%) used the interactive-visual. Results of the knowledge-test scores showed a statistically significant difference between participants’ post-test scores, indicating that the interactive-visual format better supported understanding, acquisition, and application of the framework’s knowledge. Findings from the case studies showed both formats supported ethical deliberation. Results further indicated the interactive-visual provided an overall better episodic and remembered user experience compared with the text-only document.
Conclusions
Our findings show that ethical frameworks formatted with interactive and visual qualities provide a more pleasing user experience and are effective formats for ethics learning and deliberation. These findings have implications for practitioners developing and deploying ethical frameworks and guidelines (e.g., in educational or employee-onboarding settings), in that the knowledge generated can lead to more effective dissemination practices of normative guidelines and health data ethics concepts.
Introduction
Bioethics is taking a digital turn as new tools (such as virtual reality and artificial intelligence) emerge for ethics research, policy, and engagement. For example, in the past years we have seen a popularization in digital tools that use visualization, gamification, simulation-based, and collaborative learning approaches to foster bioethics reflection and exploration, correlating to the pandemic necessitating distance education (Schrier and Gibson Citation2010; Michl et al. Citation2021). Some scholars propose calling such tools “design bioethics” in that they align with theoretical frameworks and support bioethics education, engagement and empirical research (Pavarini et al. Citation2021; Lyreskog et al. Citation2023). Others use “digital bioethics” to describe technologies developed for bioethics research purposes (Salloch and Ursin Citation2023; Schneider, Vayena, and Blasimme Citation2021), or more broadly to also include “digital tools to communicate bioethical issues, considerations, and guidelines” (Schneider Citation2021, 10). Scholarly attention on these tools has also highlighted that digital formats offer potential for enriched ethics engagement and scaled reach (Skupin, Biberstine, and Börner Citation2013). However, to date, few such tools report evidence of effectiveness and research is needed to guide practitioners as to which digital format best serves what end.
The purpose of this study is to investigate the potential of interactive-visualization formats, one sub-category of digital tools, for translating the knowledge of ethical frameworks. Within the realm of policy instruments, ethical frameworks function as authoritative reference points for responsible and ethical conduct and are key instruments for transferring ethics knowledge and normative values. Beyond information transfer, these documents seek to sensitize readers to ethical issues and provide guidance on how to resolve dilemmas. Yet, as soft-law documents (not legally binding), frameworks need to be engaging and persuasive – which can be a challenge considering their standard text-only format, which contrasts with today’s media-rich communication landscape. Furthermore, frameworks need to meet the needs of diverse users. One potential approach to address these challenges is using an interactive visualization format. Within the bioethics literature, investigations into the pedagogic value of interactive-visual communication for ethics education or sensitization remain scarce (Lyreskog et al. Citation2023; Sader et al. Citation2021). However, turning to the learning sciences and field of human-computer interaction (HCI), research shows that the combination of visual and text media can improve understandability (Zudilova-Seinstra, Adriaansen, and van Liere Citation2009; Li Citation2018), user experience (Tan and Nijholt Citation2010), and engagement (Edmonds, Muller, and Connell Citation2006; Doukianou, Daylamani-Zad, and O’Loingsigh Citation2021). Further, graphical representations can improve knowledge retrieval, acquisition, and application (Passera Citation2015; Keller et al. Citation2006). Cognitive load theory (Sweller Citation2010) and the cognitive theory of multimedia learning (Mayer Citation2005) support the notion that combining visual and textual information helps to manage cognitive load. Furthermore, research highlights that visual design and aesthetics contribute to perceptions of usefulness (Passera and Haapio Citation2013; McLachlan and Webley Citation2021; Keller et al. Citation2006), and visual restructuring of a text can be enough to improve the user experience, supporting learning, engagement, and intrinsic motivation (Passera Citation2015; Alexiou and Schippers Citation2018).
The current study contributes to empirical bioethics literature by evaluating the format of interactive visualizations for translating knowledge contained in an ethical framework. Taking into account scholarly disagreement about how ethical frameworks can be evaluated, this study adopts a pragmatic approach to assess how format impacts a framework’s function as a stand-alone learning tool. To this end, we first measure ethical learning (the understanding, acquisition, and application of ethics knowledge) with a knowledge test alongside case studies intended to examine ethical deliberation – understood as a) identifying ethical issues, b) envisioning action scenarios, and c) reaching a reasonable judgment (Senghor and Racine Citation2022). Second, we examine the format’s impact on user experience, according to both pragmatic (usability) and hedonic (aesthetic) dimensions. Informed by HCI and learning science literature presented above, our first hypothesis is that users of the interactive-visual will learn more effectively than those using a text-only format. The second hypothesis is that users of the interactive-visual framework would have a better user experience.
Interactive visualization of an ethical framework
This study uses the Swiss Personalized Health Network’s (SPHN) Ethical Framework for Responsible Data Processing in Personalized Health Research as a case study, comparing the text document with an interactive visualization (https://ethicalsystemsmap.hest.ethz.ch/). The interactive-visual format provides an enriched multimedia experience for understanding health data ethics, that seeks to motivate engagement with this voluntary soft-law (i.e., non-legally binding) health data ethics instrument. Unique features distinguishing this tool from the text-only document include its use of icons and diagrams (visuality) and its use of interactivity to highlight relationships between concepts and content.
Methods
Study design
This study employed an experimental comparative design (Field Citation2018) with participants randomly assigned to one of two conditions: a) text-only ethical framework or b) an interactive-visual (see the Supplementary Materials for details). Drawing upon theories of both cognitive sciences (Sweller Citation2010; Mayer Citation2005) and user experience (Marti and Iacono Citation2016; Lallemand, Gronier, and Koenig Citation2015), we used a pre-test, mid-test, and post-test design to measure learning performance alongside user experience. This study was approved by the institutional research ethics commission.
Participants
The study’s target population was the framework’s end users, referring to anyone processing personal data (broadly defined) or human biological samples for health research within the SPHN’s network of university hospitals, public institutions, and organizations (Lawrence, Selter, and Frey Citation2020). Due to the population’s breadth, we used a convenience and non-probabilistic sampling approach, and focused on early career university researchers as a key user group. Inclusion criteria were that participants worked with samples or health data and spoke English, to ensure a basic understanding of the health data topics communicated in the ethical framework. We excluded participants who had worked with data and samples for less than one year, who had an English level below B1 as determined by the Common European Framework of Reference for Languages (Council of Europe and Council for Cultural Co-Operation Citation2001), or who completed the mid-test survey but did not use the tool. The minimum sample size of 35 participants per group was determined based on an a priori power analysis that showed with α = 0.05, we would have 80% power to explain observed differences between the groups’ knowledge scores, with an anticipated mean score of 5.0, and 1.5 standard deviation for the control group, based on pilot testing.
Measures
To record demographics and measure learning and user experience, we devised an online survey consisting of 34 questions, with an estimated one-hour completion time for the first session, and half an hour for the second. The questions addressed sample characteristics; ethical knowledge, understanding, and application; along with expected, episodic, and remembered user experience.
Measuring learning: Ethics knowledge acquisition, understanding and application
In this study we refer to ethics learning as the understanding, acquisition, and application of ethical knowledge, based on the cognitive processes of acquiring, understanding, applying, analyzing, synthesizing, and evaluating knowledge (Bloom Citation1956; Krathwohl Citation2002). Given this definition, we first measured the format’s ability to accurately communicate health data ethics concepts and guideline information. We administered a 10-question multiple choice questionnaire, initially created as part of an online health data ethics training course with the SPHN. We then applied a test-retest approach to ensure reliability of the scores (see supplementary files for questionnaire). Each correct answer received one point, with total knowledge scores varying from 0 (all incorrect) to 10 (all correct). Questions without answers were marked as incorrect. Finally, we recorded test completion times as a measure of performance and participants’ confidence of responses, using a 5-point Likert scale (Taddio et al. Citation2013; Anzinger, Elliott, and Hartling Citation2020).
Ethical frameworks serve as deliberation tools that sensitize readers to moral issues (ethical sensitivity) and help them deal with conflicts (ethical judgment) (Martinov-Bennie and Mladenovic Citation2015). Senghor and Racine (Citation2022) write that ethical deliberation “features three important moments: (1) broadening and deepening the understanding of the situation, (2) envisioning action scenarios, (3) coming to a judgment based on the comparative evaluation of scenarios”. To measure these deliberation dimensions wherein participants apply their knowledge, we took a pragmatic approach informed by Johnson et al. (Citation2012), and used rubric based grading of participants’ answers to four hypothetical case studies. These cases (provided in the Supplementary Materials) described realistic ethical challenges encountered when using health data and samples in research. The cases were developed by bioethics experts, who helped draft and evaluate each case to ensure content relevance, along with clarity, complexity, diversity, and alignment with the learning objectives. We tested and re-tested the cases using pilot testing with a sample of early-stage health researchers. No case study baseline data was collected; rather the knowledge test scores served as a proxy for measuring participant’s familiarity and knowledge of the topic. In the final study, participants were asked to read each case study and identify the ethical issues and principles, tensions between them, and appropriate courses of action. Participants answered two cases with time pressure and two cases without, to test which format performed better in conditions of pressure (Tsiga et al. Citation2013; C.M. Wu et al. Citation2022). Correct answers were included in the analysis, with “0” for incorrect and “1” for correct answers, with a maximum of four points per case.
Measuring the user experience of an ethical framework’s format
User experience refers to the subjective experience of products and technologies (Marti and Iacono Citation2016). Scholars highlight that user experience is dynamic, and outline several relevant time spans; from these we focus on anticipated (before usage), momentary (during usage), and remembered (episodic) user experience (Lallemand, Gronier, and Koenig Citation2015). Pragmatic (or utilitarian) and hedonic qualities are also key dimensions influencing experience, as the former refers to perception of usefulness and functionality, whilst the latter includes enjoyment, gratification, and pleasure (Marti and Iacono Citation2016). Informed by user experience research, we assess both dimensions using the Hedonic/Utilitarian Scale (HED/UT) (Spangenberg, Voss, and Crowley Citation1997; Voss, Spangenberg, and Grohmann Citation2003; Passera Citation2015). This validated tool has a reported internal reliability coefficient of α = 0.88 for the hedonic subscale and α = 0.87 for the utilitarian subscale (Voss, Spangenberg, and Grohmann Citation2003).
Data collection
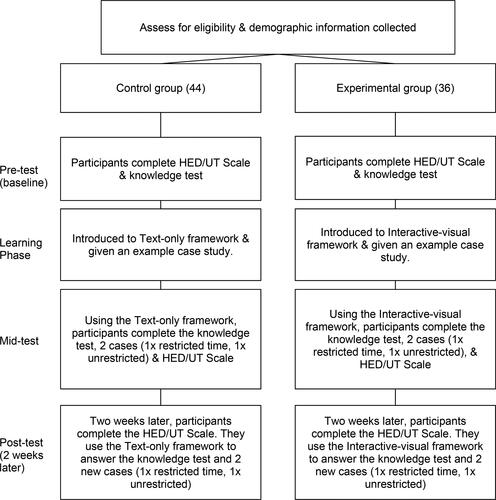
We used the online survey software Qualtrics (Qualtrics Citation2020) to recruit, screen, and randomly assign participants, as well as to obtain informed consent. Data collection occurred in two sessions conducted two weeks apart. The first session comprised the pretest, learning phase, and mid-test, wherein we used Qualtrics to collect participants’ answers to the knowledge test and HED/UT scale before and after exposure to the ethical framework, along with completion times and confidence of answers. In the second session two weeks later, we collected participants’ answers to the same measures, allowing them to access the ethical framework format that they had used in the first session ().
Figure 1. Design and procedure of study design.
Analysis
As a primary analysis we used descriptive statistics for all study variables, calculating frequency, percentage, mean, and standard deviation. For case studies, we analyzed participants’ answers using content analysis and with a pretested marking scheme (see Supplementary Tables 4 and 5). To reduce bias, the researcher graded blindly and randomized the order of responses. Inconsistencies were reconciled through a deliberative process. Questions for which answers were not clear or were reported in the wrong section were marked as incorrect. We then used a proportional odds mixed-effects linear model (Liu and Hedeker Citation2006) to investigate the effects and interactions of the format on the outcome variable of knowledge test scores, as a proxy of knowledge acquisition. This model took pre-, mid-, and post-test times into consideration, alongside user differences. We selected this model due to the ordinal nature of the knowledge test scores (with a “stepwise” increase between scores). This is in contrast to linear regression, in which the outcome is measured as a continuous variable (McNulty Citation2022). The model included only knowledge test score results, whilst the case analysis scores were analyzed as a measure of whether the learned knowledge from different formats could be applied equally well. We excluded covariates measured post-treatment, to avoid post-treatment bias (Clifford, Sheagley, and Piston Citation2021). We then used a linear mixed-effects model (Brown Citation2021) to investigate the effects of the format on user experience at the three points in time. Each model included a random effect for participant identity, to counteract the correlation caused by within- and across-subject variability. We conducted post-hoc tests to compare groups using the emmeans function (Lenth Citation2022) and Spearman correlation coefficient (Hauke and Kossowski Citation2011). All analyses were conducted using R software (R Core Team Citation2018), and with a confidence level of 95% (Alpha = 0.05).
Results
Respondent characteristics
In total 101 early career researchers working with health data at the university were recruited, and 80 completed both phases of the study. 44 participants (55%) used the text-only document (control group), and 36 participants (45%) used the interactive-visual (treatment group). Details of participant characteristics are provided in the Supplementary Materials (Supplementary Table 6) Just over half of participants were female (57.5%) and most were between 18 and 30 of age (91.25%), had “advanced” or “proficient” English (86.25%), were “confident” or “very confident” with digital technologies (85%), and had little to no ethics training (78.75%). These participants had mainly one to two years of experience working with health data or samples (75%), which mainly involved activities such as analysis and reportage, collection processes, and preparation such as cleaning. The only statistically significant difference between groups was in participant experiences preparing data and samples (Kruskal-Wallis chi-squared = 1.8118, df = 1, p = 0.1783).
Learning
Ethics knowledge acquisition
summarizes the knowledge scores, confidence scores, and test completion scores at all three time points. Before exposure to the ethical framework (pretest), both groups yielded similar average knowledge-test scores, confidence scores, and test completion times. After using the framework, both groups had improved average knowledge-test scores (). Results of the proportional odds mixed-effects linear model, which had considerable explanatory power (conditional R2 = 0.54), showed that while both groups improved, the interactive-visual group had statistically significantly (Beta = 1.43, p = 0.015) higher post-test knowledge-test scores. Further analysis examined the relationship between knowledge test scores and time. As shows, the interactive-visual group took significantly longer in the mid-test (M = 665.89 s, SD = 341.98 s) compared to the text-only group (M = 474.93 s, SD = 294.61 s), but the groups had similar post-test completion times. A positive and statistically significant correlation with medium effect size was found between knowledge scores and test times in the mid-test (Spearman’s rho = 0.27, p = 0.014), and a large effect size in the post-test (Spearman’s rho = 0.32, p = 0.004). This indicates that greater time spent resulted in better knowledge test scores.
Table 1. Descriptive statistics of knowledge test analysis scores.
Application of knowledge (ethical sensitivity and judgment)
As shows, the interactive-visual group’s mid-test case analysis scores were higher on average, but the groups’ post-test scores were similar. Further analysis investigated differences in case analysis question types, with results showing that both groups scored similarly well on ethical issue identification and resolution. However, the interactive-visual group scored slightly higher in identifying conflicts between principles. These results indicate that both formats supported ethical sensitivity (ability to identify and be aware of an ethical issue), along with ethical judgment (ability to determine possible courses of action) ().
Figure 2. Line graphs of knowledge test scores.
Graphs depict the raw data mean and standard error for knowledge test and confidence scores at three points in time.
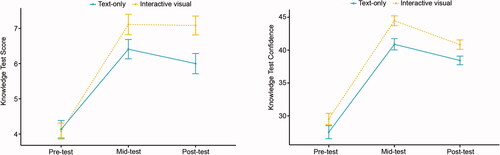
Table 2. Descriptive statistics of case study analysis scores.
User experience
summarizes user experience scores, and shows that before using the ethical framework, participants had similar expectations (M = 46.80, SD = 8.23). After exposure to the ethical framework, the interactive-visual group had on average higher scores (M = 53.06, SD = 10.60) compared with the text-only group (M = 46.48, SD = 9.73). A slight drop in the text-only group’s mid-test from pretest scores could indicate that this format’s user experience was less pleasing than what they had expected – but results are not significant. Both groups’ post-test remembered UX scores decreased compared to the episodic scores in mid-test but remained on average higher for the interactive-visual group (M = 50.14, SD = 9.02) compared with the text-only group (M = 43.91, SD = 8.84). shows that the difference in scores comes mainly from the hedonic dimension. We then fitted a mixed-effects linear model to assess the effect and interaction of the format at the pretest, mid-test, and post-test. The model’s total explanatory power was substantial (conditional R2 = 0.66), with a significant interaction effect of format at both mid-test (t(232) = 3.81, p < 0.001) and post-test (t(232) = 3.66, p < 0.001), indicating that the interactive-visual predicts a much better user experience than the pdf. These results support our second hypothesis, that the format of an ethical framework affects user experience.
Figure 3. Line graph of user experience scores.
Graphs show mean and standard error for overall user experience scores, made up of both the hedonic and utilitarian dimensions.
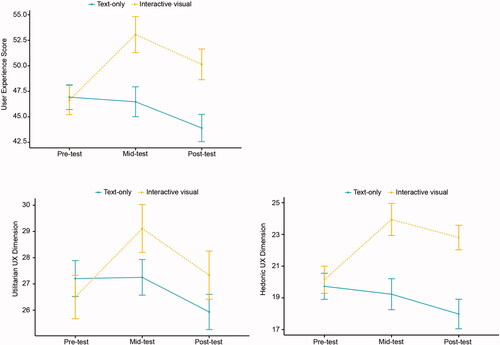
Table 3. Descriptive statistics of user experience scores.
Discussion
This study investigated whether an interactive-visual format of an ethical framework (as a stand-alone learning tool) would improve ethics learning, deliberation, and user experience. Results showed that while both formats supported ethics knowledge acquisition and application, the interactive-visual users had significantly higher post-test knowledge scores (two weeks later). This group also had higher hedonic and utilitarian scores on the user experience measure, indicating they had a more pleasing experience. Taken together, our data demonstrate that the interactive-visual format promotes longer-term understanding and application of ethical knowledge and does so in a more engaging way. In post-test knowledge-test scores, the interactive-visual group had a mean score of 7.08 compared with a mean of 6 for the text-only group, and the interactive-visual group had higher user experience mid-test scores on average (M = 53.06 compared with M = 45 in text-only group). At the same time, results from the case study analysis showed that both formats supported users in identifying ethical issues (ethical sensitivity) and applying principles to propose a solution that addresses the problem at hand (ethical judgment). This finding aligns with research that finds ethical guidelines and frameworks to be helpful tools for ethical reflection, judgment, and resolution of conflict (Martinov-Bennie and Mladenovic Citation2015).
Furthermore, beyond holding pedagogic value, our study data suggest that interactive visuals could be preferable to traditional formats due to their more positive user experience, which could motivate usage, thereby helping to address the voluntary nature of ethical frameworks (Moula and Sandin Citation2015). Time spent using a tool is often seen as a measure of engagement (Couper et al. Citation2010; A. Wu et al. Citation2021). While this variable was not the focus of the current study and acted more as a control measure, the results that the interactive-visual users took longer in the mid-test, along with reporting a good user experience and improving more in the knowledge test, suggest that this format may have prompted deeper engagement with the content. Further data are necessary to confirm this, as engagement consists of more than just time and action, but includes emotions, values, and context, referred to as “higher-order personal goals or values” (Zhou et al. Citation2022). Future studies should consider measuring engagement, as it represents a vital aspect of the learning process (Boekaerts Citation2016), and scholars still debate the extent to which emotions and engagement influence moral deliberation and decision-making (Mackenzie Citation2009; Prinz Citation2016).
Our study findings hold value for organizations and institutions publishing and deploying ethical frameworks (i.e., employee-onboarding or continuing education settings), as understanding how format and user experience impact learning and knowledge transfer is essential for creating effective tools and learning approaches. Moving beyond research which simply acknowledges the explanatory role of interactive visuals for policy (Rojas-Padilla, Metze, and Termeer Citation2022), our study demonstrates their purposiveness for ethical knowledge transfer, thereby broadening the scope of valid communication formats that health organizations, research institutes, biobanks, and large-scale projects can employ to address issues in public health and bioethics (Dawson and Marchant Citation2020). Notably, the interactive-visual format tested in this study is now integrated in an online training for health data ethics supported by SPHN. Martinov-Bennie and Mladenovic (Citation2015) emphasize that it is still necessary to integrate frameworks into educational practice to foster ethical sensitivity. Nevertheless, by validating this interactive format for use in bioethics knowledge dissemination and engagement, and outlining an approach for studies to evaluate ethical frameworks, our findings contribute to the emerging fields of “design bioethics” and “digital bioethics”, which are concerned with technologies that convey and communicate bioethical issues, concepts, and guidelines (Schneider, Vayena, and Blasimme Citation2021; Pavarini et al. Citation2021; Schneider Citation2021). More broadly, this study contributes to bioethics as a scientific enterprise by empirically investigating the representational power of the discourse’s formats. Furthermore, the study generates knowledge that can lead to more effective dissemination practices of normative guidelines and health data ethics concepts.
In discussing the added value of interactive visualization for bioethics, we must also consider some of the limitations that shadow developing digital tools using new technologies and innovations. For example, digital tools must consider accessibility, both in terms of web content (Macakoğlu and Peker Citation2022) and the digital divide, referring to the gap between individuals with or without access to information technologies (Elena-Bucea et al. Citation2021). Designers aware of these concerns can often overcome them, as exemplified by the Lowry (Citation2022) knowledge browser visualization tool. Another consideration is that tools must be careful not to misuse aesthetic appeal, for “visual content presentation influences user perceptions of usability, trust, and confidence” (Lynch Citation2010, 14). Here, we refer to tools that use attractive aesthetics to entice users to engage with content but lack validity or reliability testing. Such tools contribute to ethics-washing (Ayling and Chapman Citation2022), and reinforce the need for evaluation studies such as this one.
Findings of this study should be considered in light of both strengths and limitations. First, due to the lack of standardized approaches for measuring the effectiveness of ethical frameworks, we purposively developed the questionnaire and case studies to fit the content of the tested framework. This approach to measuring learning performance using an unvalidated questionnaire was informed by previous experimental studies assessing knowledge retrieval and application using visualization (Keller et al. Citation2006; Passera Citation2015). Future research could develop more broadly-applicable ethical deliberation assessment methods, to enable comparative analysis of frameworks’ effectiveness. Furthermore, as we sourced participants for our study from the university, the sample comprised mainly early-stage health researchers. As a result, this sample does not reflect the diversity or broadness of the researcher population internationally. Therefore, the generalizability of the findings to broader populations is problematic but could be addressed with additional research. Nonetheless, the sample tested represents a key user group for this framework and for ethical guidelines more generally, as learning ethical guidelines is an integral part of early career health researchers’ integration and onboarding in research institutions. Finally, there is the question of whether performance measured in the study setting transfers to performance in real-life situations. Although study participants used their personal computers to test the tool, their learning was guided by questions and case studies, with a minimum time required for reading and practice. Future research could complement our study by investigating real-world ethical framework usage practices; for example, how format influences learning within traditional ethical training or university educational settings.
Conclusion
Empirical evidence from this study shows that ethical frameworks, as stand-alone learning and deliberation tools, can use formats that harness visual and digital qualities to improve learning and user experiences. Our study findings have several implications for deploying ethical frameworks in educational settings (e.g., to train new employees or research ethics committee members), including a shift in pedagogic approach, new opportunities for content creation, and support for differentiated instruction. The current findings contribute to the literature by providing a framework to evaluate ethical frameworks’ formats as digitally mediated tools for ethical deliberation and reflection. Furthermore, this paper contributes to establishing the validation and evaluation of digital tools as a phenomenon of interest in bioethics research and health policy communication. Future research should investigate the role of engagement, ethical deliberation, and decision-making, and examine which aspects of visuality can have the greatest impact on improving the learning of ethical frameworks.
Ethics approval
This study was approved by the ETH Zurich ethics commission, project number: EK 2022-N-57).
Supplementary_Materials_0703.docx
Download MS Word (328.6 KB)Acknowledgements
We would like to thank the ETH Decision Science Laboratory for their help setting up the study and recruiting participants. As well, we thank Vasilios Nittas and Agata Feretti for their expert advice in the case study development and Shannon Hubbs for her help with editing. Also, Jakob Heimer from the university office of statistics for guidance with the models.
Disclosure statement
The authors report no conflict of interest.
Data availability statement
The data for the evaluation study is available in a non-identifiable format through the ETH Research Collection: https://www.research-collection.ethz.ch/handle/20.500.11850/590438
Additional information
Funding
References
- Alexiou, A., and M. C. Schippers. 2018. Digital game elements, user experience and learning: A conceptual framework. Education and Information Technologies 23 (6):2545–67. doi: 10.1007/s10639-018-9730-6.
- Anzinger, H., S. A. Elliott, and L. Hartling. 2020. Comparative usability analysis and parental preferences of three web-based knowledge translation tools: Multimethod study. Journal of Medical Internet Research 22 (3):e14562. doi: 10.2196/14562.
- Ayling, J., and A. Chapman. 2022. Putting AI ethics to work: Are the tools fit for purpose? AI and Ethics 2 (3):405–29. 10.1007/s43681-021-00084-x. doi: 10.1007/s43681-021-00084-x.
- Bloom, B. S. 1956. Taxonomy of educational objectives, handbook: The cognitive domain. New York: David McKay.
- Boekaerts, M. 2016. Engagement as an inherent aspect of the learning process. Learning and Instruction 43:76–83. doi: 10.1016/j.learninstruc.2016.02.001.
- Brown, V. A. 2021. An introduction to linear mixed-effects modeling in R. Advances in Methods and Practices in Psychological Science 4 (1):251524592096035. https://journals.sagepub.com/doi/abs/10.1177/2515245920960351. doi: 10.1177/2515245920960351.
- Clifford, S., G. Sheagley, and S. Piston. 2021. Increasing precision without altering treatment effects: Repeated measures designs in survey experiments. American Political Science Review 115 (3):1048–65. doi: 10.1017/S0003055421000241.
- Council of Europe and Council for Cultural Co-Operation. 2001. Education committee. Modern languages. In Common European framework of reference for languages: Learning, teaching, assessment. Cambridge: Cambridge University Press.
- Couper, M. P., G. L. Alexander, N. Zhang, R. J. Little, N. Maddy, M. A. Nowak, J. B. McClure, J. J. Calvi, S. J. Rolnick, M. A. Stopponi, et al. 2010. Engagement and retention: Measuring breadth and depth of participant use of an online intervention. Journal of Medical Internet Research 12 (4):e1430. doi: 10.2196/jmir.1430.
- Dawson, A., and A. Marchant. 2020. Varicella vaccination, counting harms and benefits, and obligations to others. The American Journal of Bioethics : AJOB 20 (9):76–8. doi: 10.1080/15265161.2020.1795536.
- Doukianou, S., D. Daylamani-Zad, and K. O’Loingsigh. 2021. Implementing an augmented reality and animated infographics application for presentations: Effect on audience engagement and efficacy of communication. Multimedia Tools and Applications 80 (20):30969–91. doi: 10.1007/s11042-021-10963-4.
- Edmonds, E., L. Muller, and M. Connell. 2006. On creative engagement. Visual Communication 5 (3):307–22. doi: 10.1177/1470357206068461.
- Elena-Bucea, A., F. Cruz-Jesus, T. Oliveira, and P. S. Coelho. 2021. Assessing the role of age, education, gender and income on the digital divide: Evidence for the European Union. Information Systems Frontiers 23 (4):1007–21. doi: 10.1007/s10796-020-10012-9.
- Field, A. 2018. Discovering statistics using IBM SPSS statistics. 5th ed. London: Sage.
- Hauke, J., and T. Kossowski. 2011. Comparison of values of Pearson’s and Spearman’s correlation coefficients on the same sets of data. QUAGEO 30 (2):87–93. doi: 10.2478/v10117-011-0021-1.
- Johnson, J. F., Z. Bagdasarov, S. Connelly, L. Harkrider, L. D. Devenport, M. D. Mumford, and C. E. Thiel. 2012. Case-based ethics education: The impact of cause complexity and outcome favorability on ethicality. Journal of Empirical Research on Human Research Ethics: JERHRE 7 (3):63–77. doi: 10.1525/jer.2012.7.3.63.
- Keller, T., P. Gerjets, K. Scheiter, and B. Garsoffky. 2006. Information visualizations for knowledge acquisition: The impact of dimensionality and color coding. Computers in Human Behavior 22 (1):43–65. doi: 10.1016/j.chb.2005.01.006.
- Krathwohl, D. R. 2002. A revision of Bloom’s taxonomy: An overview. Theory into Practice 41 (4):212–8. doi: 10.1207/s15430421tip4104_2.
- Lallemand, C., G. Gronier, and V. Koenig. 2015. User experience: A concept without consensus? Exploring practitioners’ perspectives through an international survey. Computers in Human Behavior 43:35–48. doi: 10.1016/j.chb.2014.10.048.
- Lawrence, A. K., L. Selter, and U. Frey. 2020. SPHN-The Swiss personalized health network initiative. Studies in Health Technology and Informatics 270:1156–1160.
- Lenth, R. V. 2022. Package “emmeans”. CRAN Package. https://cran.r-project.org/web/packages/emmeans/emmeans.pdf.
- Li, Q. 2018. Data visualization as creative art practice. Visual Communication 17 (3):299–312. doi: 10.1177/1470357218768202.
- Liu, L. C., and D. Hedeker. 2006. A mixed-effects regression model for longitudinal multivariate ordinal data. Biometrics 62 (1):261–8. https://onlinelibrary.wiley.com/doi/abs/10.1111/j.1541-0420.2005.00408.x. doi: 10.1111/j.1541-0420.2005.00408.x.
- Lowry, M. M. 2022. Proof of concept: Excel-managed dynamic knowledge browser. Lowry’s Hub (blog). https://myhub.ai/items/proof-of-concept-excel-managed-dynamic-knowledge-browser.
- Lynch, P. J. 2010. Aesthetics and trust: Visual decisions about web pages. In Proceedings of the. International Conference on Advanced Visual Interfaces, 11–15. Roma, Italy: ACM. doi: 10.1145/1842993.1842996.
- Lyreskog, D. M., G. Pavarini, E. Jacobs, V. Bennett, G. Mawdsley, and I. Singh. 2023. Testing design bioethics methods: Comparing a digital game with a vignette survey for neuroethics research with young people. AJOB Empirical Bioethics 14 (1):55–64. doi: 10.1080/23294515.2022.2110964.
- Macakoğlu, Ş. S., and S. Peker. 2022, June. Web accessibility performance analysis using web content accessibility guidelines and automated tools: A systematic literature review. In 2022 International Congress on Human-Computer Interaction, Optimization and Robotic Applications (HORA), 9–11. Ankara, Turkey: IEEE.
- Mackenzie, C. 2009. Sinnott-Armstrong, Walter, ed., moral psychology, volume 3. The neuroscience of morality: emotion, brain disorders, and development, Cambridge, MA: MIT Press, 2008, pp. xix + 569, US $30 (paperback). Australasian Journal of Philosophy 87 (3):528–32. doi: 10.1080/00048400902941463.
- Marti, P., and I. Iacono. 2016. Anticipated, momentary, episodic, remembered: The many facets of User eXperience. Paper presented at 2016 Federated Conference on Computer Science and Information Systems (FedCSIS), Gdansk, Poland, September 11–15.
- Martinov-Bennie, N., and R. Mladenovic. 2015. Investigation of the impact of an ethical framework and an integrated ethics education on accounting students’ ethical sensitivity and judgment. Journal of Business Ethics 127 (1):189–203. doi: 10.1007/s10551-013-2007-5.
- Mayer, R. E. 2005. Cognitive theory of multimedia learning. In The Cambridge handbook of multimedia learning, Cambridge handbooks in psychology, ed. R. Mayer, 31–48. Cambridge: Cambridge University Press. doi: 10.1017/CBO9780511816819.004.
- McLachlan, S., and L. C. Webley. 2021. Visualisation of law and legal process: An opportunity missed. Information Visualization 20 (2–3):192–204. doi: 10.1177/14738716211012608.
- McNulty, K. 2022. Handbook of regression modeling in people analytics: With examples in R and Python. Boca Raton, FL: Chapman & Hall/CRC. https://peopleanalytics-regression-book.org/ord-reg.html.
- Michl, S., J. Katsarov, H. Krug, A. Rogge, and T. Eichinger. 2021. Ethics in times of physical distancing: Virtual training of ethical competences. GMS Journal for Medical Education 38 (1):Doc28.
- Moula, P., and P. Sandin. 2015. Evaluating ethical tools. Metaphilosophy 46 (2):263–79. doi: 10.1111/meta.12130.
- Passera, S. 2015. Beyond the wall of text: How information design can make contracts user-friendly. In Design, user experience, and usability: Users and interactions. DUXU 2015. Lecture notes in computer science, ed. A. Marcus, vol. 9187, 341–352. Cham: Springer.
- Passera, S., and H. Haapio. 2013. Transforming contracts from legal rules to user-centered communication tools: A human-information interaction challenge. Communication Design Quarterly 1 (3):38–45. doi: 10.1145/2466489.2466498.
- Pavarini, G., R. McMillan, A. Robinson, and I. Singh. 2021. Design bioethics: A theoretical framework and argument for innovation in bioethics research. The American Journal of Bioethics: AJOB 21 (6):37–50. doi: 10.1080/15265161.2020.1863508.
- Prinz, J. 2016. Sentimentalism and the moral brain. In Moral brains: The neuroscience of morality, ed. S. M. Liao, 45–73. New York: Oxford University Press.
- Qualtrics. 2020. Qualtrics. https://www.qualtrics.com/uk/.
- R Core Team. 2018. R: A language and environment for statistical computing 3.0.0. Vienna, Austria: R Foundation for Statistical Computing. https://www.R-project.org/.
- Rojas-Padilla, E., T. Metze, and K. Termeer. 2022. Seeing the visual: A literature review on why and how policy scholars would do well to study influential visualizations. Policy Studies Yearbook 12 (1):103. doi: 10.18278/psy.12.1.5.
- Sader, J., M.-C. Audétat, M. Nendaz, S. Hurst, and C. Clavien. 2021. Design bioethics, not only as a research tool but also a pedagogical tool. The American Journal of Bioethics: AJOB 21 (6):69–71. doi: 10.1080/15265161.2021.1915416.
- Salloch, S., and F. Ursin. 2023. The birth of the “digital turn” in bioethics? Bioethics 37 (3):285–91. doi: 10.1111/bioe.13099.
- Schneider, M. 2021. Digital bioethics: Contextualizing digital technologies and introducing digital methods for empirical research. PhD diss., ETH Zurich.
- Schneider, M., E. Vayena, and A. Blasimme. 2021. Digital bioethics: Introducing new methods for the study of bioethical issues. Journal of Medical Ethics 1–8. doi: 10.1136/medethics-2021-107387.
- Schrier, K., and D. Gibson. 2010. Ethics and game design: Teaching values through play. New York: IGI Global.
- Senghor, A. S., and E. Racine. 2022. How to evaluate the quality of an ethical deliberation? A pragmatist proposal for evaluation criteria and collaborative research. Medicine, Health Care, and Philosophy 25 (3):309–26. doi: 10.1007/s11019-022-10091-2.
- Skupin, A., J. R. Biberstine, and K. Börner. 2013. Visualizing the topical structure of the medical sciences: A self-organizing map approach. PloS One 8 (3):e58779. doi: 10.1371/journal.pone.0058779.
- Spangenberg, E. R., K. E. Voss, and A. E. Crowley. 1997. Measuring the hedonic and utilitarian dimensions of attitude: A generally applicable scale. In NA - Advances in Consumer Research Volume 24, eds. M. Brucks and D. J. MacInnis, 235–241. Provo, UT: Association for Consumer Research.
- Sweller, J. 2010. Cognitive load theory: Recent theoretical advances. In Cognitive load theory, 29–47. Cambridge: Cambridge University Press.
- Taddio, A., V. Shah, E. Leung, J. Wang, C. Parikh, S. Smart, R. Hetherington, M. Ipp, R. P. Riddell, M. Sgro, et al. 2013. Knowledge translation of the HELPinKIDS clinical practice guideline for managing childhood vaccination pain: Usability and knowledge uptake of educational materials directed to new parents. BMC Pediatrics 13 (1):1–9. doi: 10.1186/1471-2431-13-23.
- Tan, D., and A. Nijholt. 2010. Brain-computer interfaces and human-computer interaction. In Brain-computer interfaces, 3–19. New York: Springer.
- Tsiga, E., E. Panagopoulou, N. Sevdalis, A. Montgomery, and A. Benos. 2013. The influence of time pressure on adherence to guidelines in primary care: An experimental study. BMJ Open 3 (4):e002700. doi: 10.1136/bmjopen-2013-002700.
- Voss, K. E., E. R. Spangenberg, and B. Grohmann. 2003. Measuring the hedonic and utilitarian dimensions of consumer attitude. Journal of Marketing Research 40 (3):310–20. doi: 10.1509/jmkr.40.3.310.19238.
- Wu, A., M. A. Scult, E. D. Barnes, J. A. Betancourt, A. Falk, and F. M. Gunning. 2021. Smartphone apps for depression and anxiety: A systematic review and meta-analysis of techniques to increase engagement. NPJ Digital Medicine 4 (1):20. doi: 10.1038/s41746-021-00386-8.
- Wu, C. M., E. Schulz, T. J. Pleskac, and M. Speekenbrink. 2022. Time pressure changes how people explore and respond to uncertainty. Scientific Reports 12 (1):1–14. doi: 10.1038/s41598-022-07901-1.
- Zhou, Y., B. J. Calder, E. C. Malthouse, and Y. K. Hessary. 2022. Not all clicks are equal: Detecting engagement with digital content. Journal of Media Business Studies 19 (2):90–107. doi: 10.1080/16522354.2021.1924558.
- Zudilova-Seinstra, E., T. Adriaansen, and R. van Liere. 2009. Overview of interactive visualisation. In Trends in interactive visualization, eds. E. Zudilova-Seinstra, T. Adriaansen, and R. van Liere, 3–15. New York: Springer.