
Abstract
Seasonality is a natural feature of wild caught fisheries that introduces variation in food supply, and which often is amplified by fisheries management systems. Seasonal timing of landings patterns and linkages to consumption patterns can have a potentially strong impact on income for coastal communities as well as import patterns. This study characterizes the relationship between seasonality in seafood production and consumption in the United States by analyzing monthly domestic fisheries landings and imports and retail sales of farmed and wild seafood from 2017 to 2019. Analyses were conducted for total seafood sales, by product form, by species group, and by region of the United States. The data reveal strong seasonal increases in consumption around December and March. Seasonal increases in consumption in Spring and Summer occurred in parallel with domestic fishing production. Domestic landings vary by region, but most regions have peak fishing seasons between May and October. Alaska has the largest commercial fishery in the United States and seasonal peaks in Alaska (July/August, February/March) strongly influence seasonality in national landings. Misalignment between domestic production and consumption in some seasons and species groups creates opportunities for imports to supplement demand and lost opportunities for domestic producers.
Introduction
Fisheries provide an important source of nutritious and culturally important food in coastal communities (Lowitt Citation2014; Asche et al. Citation2018). Consumers typically prefer local over non-local seafood, and consumption patterns shift with fishing seasons which brings pulses of fresh products to market (Lowitt Citation2013; Richard and Pivarnik Citation2020). Fishing seasons are often connected to local foodways. While important locally, these seasonal products compete in an increasingly global marketplace where the average consumer is often disconnected from the food they eat (Gephart and Pace Citation2015; Crona et al. Citation2016). Local seafood is also nested within a food system where broader socio-cultural and economic factors influence seafood availability and demand (Love et al. Citation2021; Love et al. Citation2022a, Love et al. Citation2022b). Understanding consumption patterns is therefore critical to identifying influences on fisheries production, markets, price, and fishing revenue.
Revenue from fisheries is a function of landing volumes and market prices. Landings fluctuate throughout the year, partly due to natural behavioral patterns of the fish, weather, location of available species, availability of crew/processing staff, and the regulatory constraints (Birkenbach et al. Citation2017). While catch volume is related to environmental and regulatory factors, market prices are generally driven by availability, competition with substitute goods and consumer preferences in formal market settings.
Imported seafood products often represent a significant pool of substitute goods, as a larger share of seafood is traded than for most other food products (Anderson et al. Citation2018). Local products must then compete with foreign products, with an estimated 78% of seafood products exposed to trade competition (Tveterås et al. Citation2012). Imported products, however, also complement domestic supply during periods of high seasonal demand and supplement supply when domestic fish landings are low. Consequently, imports can benefit consumers by reducing prices and smoothing supply.
If domestic production and consumption are well aligned (i.e., peaks in production match peaks in demand) this will create higher demand and prices when the local fish is available, which benefits local fishers. Potential misalignments between supply and demand can have significant economic and social impacts on fisheries dependent coastal communities. If fisheries landings and consumption are not well aligned there may be an oversupply of fresh fish in periods with low demand. During periods with excess demand, conserved products (i.e., frozen or preserved products) or imports could play a role in keeping prices down. In general, fresh products generate the highest prices, and it is therefore the product form of choice for producers that have more control over the production process (Asche and Smith Citation2018). The fact that local species tend to be sold in fresh product forms (Love et al. Citation2022b) and that some outlets have a significant preference for stable supply (Asche and Smith Citation2018), can further amplify the market impact and community impact of misalignments between production and consumption. In some fisheries the production is frozen or preserved because of a short fishing season due to biological migration patterns (Pettersen and Asche Citation2020) or the regulatory system (Homans and Wilen, Citation2005), thereby reducing prices and income. Extending a harvest season is an approach to improve the market potential for fishers or aquaculture producers, but how effective it will be in generating more revenue depends on the demand patterns (Birkenbach et al. Citation2020; Kumar et al., Citation2021). This depends to a large extent on how well harvesting patterns can be aligned with consumption patterns and how this is impacted by imports.
Policies aimed at supporting coastal communities should consider seasonal patterns in supply and demand. For instance, the Maine urchin fishery is timed with the peak export market to Asia (Miller Citation2021). Seasonal closures to fishing create volatility in species availability and price (Dahl and Oglend Citation2014) and may prevent more valuable market segments from being served (Homans and Wilen Citation2005; Pincinato et al. Citation2022). The magnitude of these impacts will also be influenced by potential substitutes and other demand characteristics (Garlock et al., Citation2020; Birkenbach et al. Citation2020; Asche et al. Citation2022a).
The United States provides a valuable case with respect to seasonal landings patterns in that it is the fifth largest fishing nation in the world (FAO Citation2020) and includes diverse regional fisheries, yet the majority of seafood consumed is imported (Gephart et al. Citation2019). In addition to seasonal harvesting patterns, there are also specific consumption patterns around holidays. For example, the Christian season of Lent (ranging from mid-February through mid-April) may be the best known period for fish intake when an estimated 14% of U.S. consumers replace meat with seafood or other foods (Thorn Citation2021).
The overall aim of this review was to better understand the U.S. seafood system by looking at monthly variation in domestic fisheries production, and imports and consumption of all seafood (farmed and wild caught). A series of questions were asked: What seasonal trends exist in seafood consumption? Are seasonal consumption patterns more strongly influenced by domestic production or imports? What domestic species are associated with local markets?
Monthly sales were analyzed for three stages of the U.S. seafood supply chain: imports, domestic landings, and retail sales for three consecutive years. and provide the data sources, product types, geographic coverage, and units available for analysis. A new variable (species group) was added to each dataset and a name harmonization step was performed before linking the datasets together. Product forms differed among the datasets (i.e., landed weight vs retail weight). Standardized values were created by dividing the average monthly value for each product form and stage by the average maximum value for the year. These standardized values provide relative average monthly sales for products and were the main unit of analysis. Each dataset is described in detail below.
Figure 1. Map of state and regional domestic fisheries landings data (closed circles), retail sale data (open circles), or both (half-filled circles). Regions defined by NOAA Fisheries. See for more information on data sources.
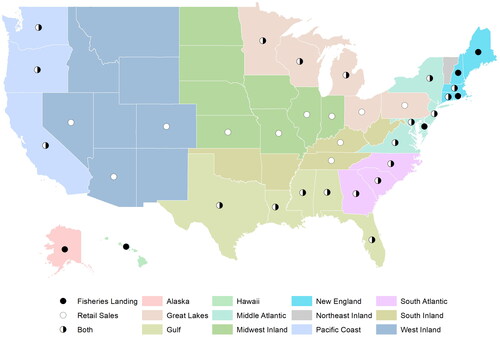
Table 1. Description of study datasets.
Retail seafood sales
Monthly state and national-level sales projections for the seafood category were based on data reported by NielsenIQ through its Scantrack Service during the period starting January 2017 and ending December 2019. Nielsen data used the national and state markets and xAOC channel (eXtended All Outlet Combined, xAOC, product, New York, NY), according to the NielsenIQ standard product hierarchy. Methods for analysis have been previously described (Love et al Citation2022a). Sales were reported at the universal product code (UPC) level, which provides a unique number for each product. Seafood was categorized by Nielsen based on the retail department where products were sold (fresh, frozen, shelf-stable) and includes both farmed and wild-caught species combined. The majority (>90%) of products sold at the fresh seafood counter were sold as random weight (i.e., by the pound), which suggests they were truly fresh. Retail sales volumes were converted to kilograms from ounces and sales revenue was adjusted for inflation using regional consumer price indices to December 2019. Nielsen reports retail sales in four-week periods, which were converted to monthly values to match domestic landings and imports. Items with missing weights were imputed using the average unit price of a similar item. State-level sales projections were available for 31 states where Nielsen collects data including many states with commercial fishing sectors, with some notable exceptions (Alaska, Hawaii, Maine, Rhode Island). State data were grouped into regions based on those used by NOAA Fisheries. Species sold primarily as bait were removed before analysis. Plots were created for monthly average sales volume, value and unit price for each seafood category (fresh, frozen, shelf-stable) using national and regional data.
Domestic fisheries landings
Monthly U.S. commercial fisheries landings were collected via public data requests to states (Wisconsin and Michigan Depts of Natural Resources, Alabama Div. of Natural Resources; Florida Fish and Wildlife Conservation Commission; Louisiana Dept. of Wildlife and Fisheries; Mississippi Div. of Marine Resources; Texas Parks and Wildlife Dept., Alaska Dept of Fish and Game), tribes (Bad River Band and Red Cliff Band of Lake Superior Chippewa Natural Resources Divisions), regional data centers (Pacific Fisheries Information Network, Atlantic Coastal Cooperative Statistics Program) and federal agencies (NOAA Greater Atlantic and Pacific Island Regional Offices) for the period of January 2017 to December 2019. Data were summarized by species group and fishing region. There were confidentiality constraints on reporting monthly landings such that data from fewer than three vessels or dealers in a given month were not available. To minimize confidentiality constraints, data were aggregated to the species group-level (clams, groupers, shrimps, etc.) and by region. Florida was included in the Gulf region in this analysis. For the lower 48 states and Hawaii, 3% of landings in the dataset were deemed confidential, and in Alaska, 62% of landings (mostly from groundfish species) were deemed confidential (). The form (meat vs round weight) was not provided by most sources and therefore not adjusted for within this dataset. Molluskan shellfish reported as wild capture may be from aquaculture in some states (Froehlich et al. Citation2022). Landings by value were not consistently available and not included in the analysis.
Table 2. Commercial landings by month versus year, average 2017–2019 (1,000 metric tonnes).
Seafood imports
Monthly import data was accessed from the U.S. Census Bureau for 2017–2019 (US Census Citation2022). Trade data is reported using 10-digit harmonized system codes. We included all codes from Chapter 03. Each trade code description was used to match trade codes to species groups, and to identify the product form (fresh, frozen, cured, etc.). Trade data includes wild caught and farmed species combined together. Non-human food (i.e., fish meal) was removed. These categories were aligned to create a linking term for other datasets. The trade volume represents the general imports/exports in product weight.
National level
The review was first conducted using the data at the national level for the three stages in the supply chain.
Monthly retail sales
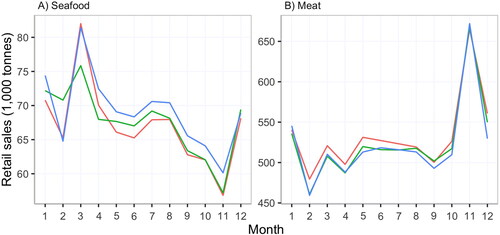
There was significant seasonal variation in aggregate retail sales of seafood, with patterns varying by product form (). For all product forms, the most important month in terms of volume is March (), which may be explained by increased fish consumption during Lent. Sales increases during Lent were clearly visible when comparing across years, as the Lent period varies from February to April depending upon the Lunar calendar (). The unit prices of fresh and frozen seafood were at their lowest level during March (). For fresh and frozen seafood there is also a peak in sales in December (). The December peak is stronger for revenues than for quantity and therefore shows up in the form of a higher average unit price, suggesting a shift toward higher-valued species during the holiday season. November had the lowest sales revenue and volume for all categories (fresh, frozen, and shelf-stable) and the highest monthly sales volume for fresh meat () suggesting that seafood is replaced by meat, likely driven by Thanksgiving and other fall eating traditions.
Figure 2. Monthly United States retail seafood sales A) volume, B) revenue, and C) unit price for three product categories (fresh, frozen, shelf-stable), average 2017-2019. The y-axis is normalized by dividing the monthly values by the maximum monthly value.
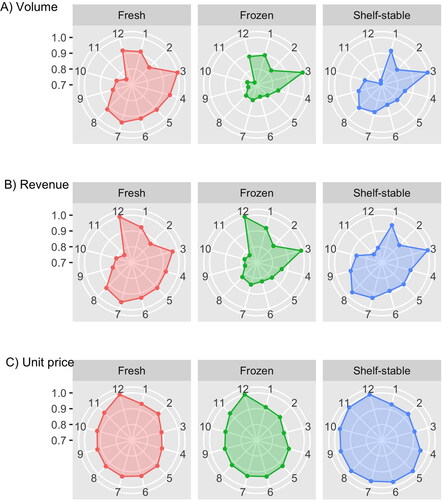
Figure 3. Monthly U.S. retail sales of A) seafood and B) fresh meat (2017-2019). Red = 2017, green = 2018, blue = 2019. Lent is observed during the 40-day period before Easter and varies based on a Lunar calendar. The Lent period was March 1 to April 13 in 2017, February 14 to March 29 in 2018, and March 6 to April 18 in 2019.
By category, fresh and frozen seafood were similar in terms of volume, revenue, and unit price in most months except April through August when fresh retail sales were higher (). This is likely related to fishing seasons and summer food traditions such as vacationing in coastal areas. Shelf-stable seafood has a peak in volume and revenue in August that extends through October and no sales spike in December (), which differentiates it from fresh and frozen retail seafood.
Monthly imports and domestic landings
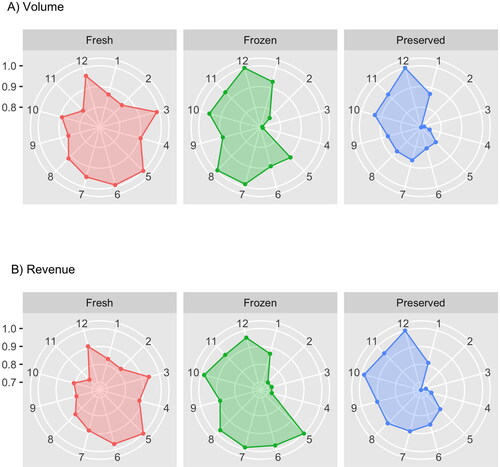
Monthly import volume and revenue for fresh seafood were highest in March, May, June, and December (). Frozen import volume and revenue was highest May through August, October and December. Prepared and preserved volume and revenue was highest in December. Unit prices for all three categories were highest in May and June (fresh and frozen) or June through October (prepared and preserved). Fresh import volumes appear to correspond to seasonal fresh retail demand to a large extent, and particularly in December, March, and May through August, while there is limited correlation between consumption and imports for the other two product categories. This may suggest that domestic species are more important here, but also that storage plays an important role. Wessells and Wilen present an example of this in the wholesale Japanese salmon market and their use of storage to respond to demand (Wessells and Wilen Citation1993).
Figure 4. Monthly seafood imports to the United States by A) volume and B) revenue for three product categories (fresh, frozen, preserved), average 2017-2019. The y-axis is normalized by dividing the monthly values by the maximum monthly value. Unit price not plotted. Preserved includes prepared and preserved products.
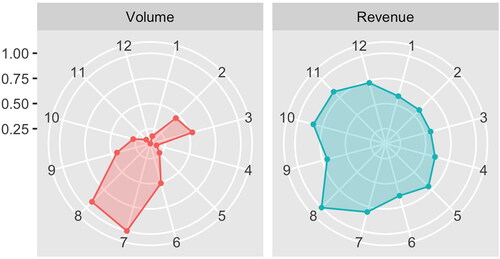
Monthly U.S. commercial fisheries landings by volume were highest in July and August, driven by salmon landings in Alaska, with a secondary peak in February and March from Alaska pollock landings (). Revenue was highest in August. There are times of the year when domestic landings are well aligned to domestic demand and also times when they are not. It is important to disaggregate this information by specific regions and species.
Figure 5. Monthly United States commercial fisheries landings by volume and revenue, average 2017–2019. The y-axis is normalized by dividing the monthly values by the maximum monthly value.
Regional level
To shed more light on the landings and consumption patterns, the review was continued at a regional level.
Monthly retail sales
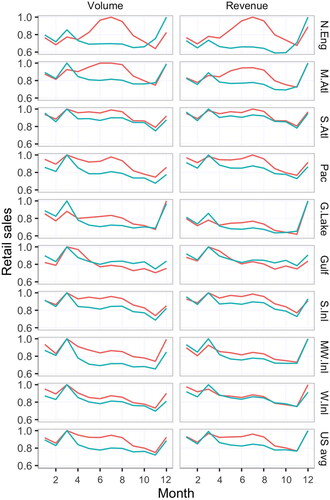
While national retail sales peak in months with holidays or religious events such as December (Christmas) and March (Lent), many regional markets respond differently to these periods which shows diversity in the U.S. market (). In New England and the Middle Atlantic, fresh seafood sales are higher in June, July and August than December or March. The South Atlantic, South Inland, and Pacific regions have extended high levels of fresh seafood sales from March to August which overshadow December sales. In the Gulf region, March and April are the most important months for fresh seafood sales. Inland regions without close proximity to fisheries, such as the Midwest Inland and West Inland regions, have similar sales patterns for fresh and frozen seafood, suggesting weak seasonal demand for fresh seafood.
Figure 6. Monthly regional fresh (red line) and frozen (teal line) retail seafood sales by volume and revenue, average 2017–2019. The y-axis is normalized by dividing the monthly values by the maximum monthly value. Acronyms: N.Eng = New England; M. Atl = Middle Atlantic; S. Atl = South Atlantic; Pac = Pacific; G. Lake = Great Lakes; Gulf = Gulf; S. Inl = South Inland; MW. Inl = Midwest Inland; W. Inl = West Inland, US avg = total US average (Regions mapped in ).
Monthly regional landings
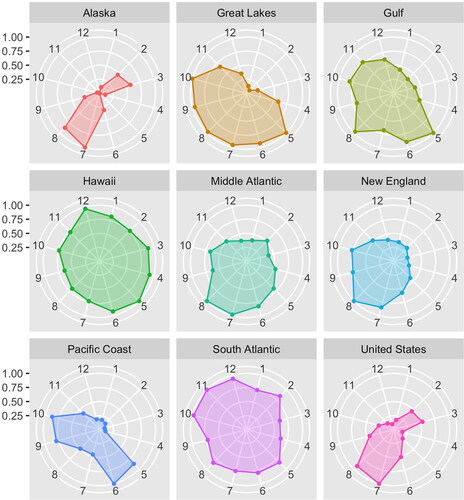
Landings vary by region, but most regions have peak fishing seasons sometime between May and October (). Alaska has the largest commercial fishery in the U.S. and seasonal peaks in Alaska (July/August, February/March) strongly influence seasonality in national landings. Alaska is also a region with significant exports. In New England, landings are largest from July through October. In the Middle Atlantic landings peak in June through October. In the Great Lakes and Gulf regions, landings are largest from May through October. Pacific Coast landings are largest in May/June and September/October. In many coastal regions, seasonal landings align well with fresh retail sales, suggesting that local supply is important for consumption patterns in the fresh segment. One exception is the Gulf region where retail demand is highest in March and April when regional landings are at their lowest.
Figure 7. Monthly regional commercial fisheries landings by volume, average 2017–2019. The y-axis is normalized by dividing the monthly values by the maximum monthly value.
Regional markets
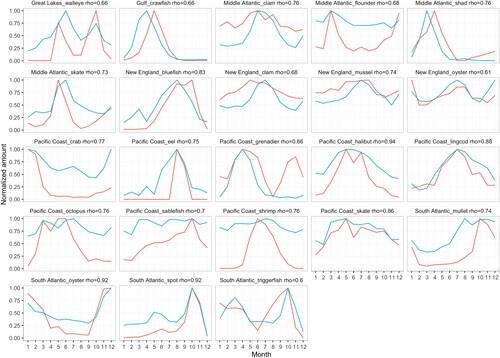
In regions with domestic landings and fresh retail sales, we calculated correlation coefficients (rho) comparing the two, and mapped species with rho ≥0.60 which we considered significantly correlated (). We found 19% of regionally landed species groups (23 of 121 regional species groups) were significantly correlated with regional retail seafood sales. These species correspond to 12% (27,000 of 231,000 tonnes) of fresh seafood sold in coastal states with available data. Analyses were restricted to the fresh category of retail seafood. Domestic fisheries products were assumed to be majority fresh, although category was not reported. Correlation coefficients range from 0 to 1 with higher values indicating stronger correlation. Plots of species with rho values ≥0.60, identified as a “practically significant” value, are reported in .
Figure 8. Regional markets for domestic fisheries products showing species groups that are well aligned between regional landings and fresh retail sales. Significant cross correlation coefficients (rho) cutoff ≥0.6. Rho values presented by species group in . Regions provided in .
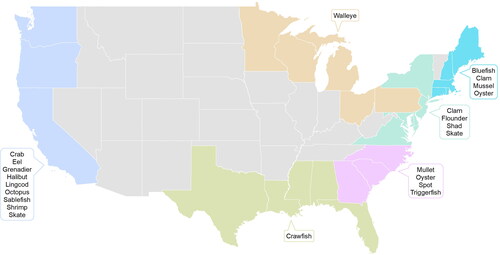
Figure 9. Regional fresh retail seafood sales (teal) versus regional domestic fisheries landings (red). Species groups with correlation coefficients (rho) ≥60 are plotted. Rho values reported in the subtitle. The y-axis is normalized by dividing the monthly values by the maximum monthly value.
Typology of retail sales
We identified five typologies describing seasonal patterns in the origin (domestic, regional, international) and production methods (wild caught, aquaculture) of retail seafood sales. The five typologies include domestic seasonal supply, imported seasonal supply, mixed domestic and imported seasonal supply, domestic year-round supply, and import year-round supply, which are illustrated using examples in .
Figure 10. Monthly retail sales, domestic landings, and imports for four example species A) bluefish, B) swordfish, C) halibut, and D) salmon, average 2017–2019. The y-axis is normalized by dividing the monthly values by the maximum monthly value. No imports of bluefish.
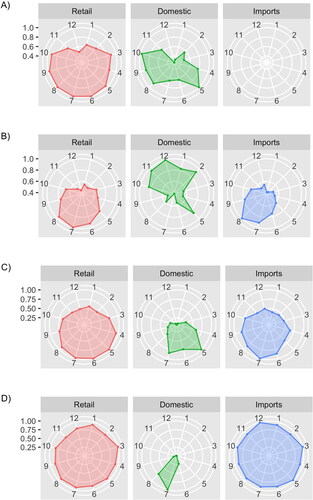
Domestic seasonal supply
This typology represents domestically landed species sold fresh and in season, mainly to regional markets. A good example of a domestic fishery with seasonal supply is bluefish (). The fishery is relatively small, producing 4,800 tonnes/yr from commercial landings, with peak landings in the Middle Atlantic in the spring and in New England in the summer and early fall. Fresh bluefish retail sales were significantly correlated with landings in New England (rho = 0.83). Commercial landings are augmented by slightly larger recreational catch (6,200 tonnes/yr) that peaks in July and August (NOAA Fisheries Citation2022a). There were no identified bluefish imports. Other examples of domestic fisheries with regional markets for fresh products include Gulf crawfish, Hawaii parrotfish, Middle and South Atlantic shad, and South Atlantic spot and triggerfish. Domestically caught species with regional markets make up a small amount (12%) of fresh retail seafood sales.
Imported seasonal supply
The analog to the “domestic seasonal supply” typology is imported seasonal supply, which represents imported products sold fresh that serve periods with high retail demand. The example we chose is swordfish. Most swordfish is imported (84,000 tonnes/yr imported vs 2,600 tonnes/yr domestic) and sold in the summer, which aligns better with summer peaks in retail demand (rho = 0.90) than domestic swordfish landings (rho = 0.6) () (NOAA Fisheries Citation2022b). The domestic swordfishing season peaks in the winter, which is misaligned with periods of peak retail demand. There are many examples of imports with seasonal supply; a few notable species include dolphinfish, haddock, and fresh tuna.
Mixed (domestic and imported) seasonal supply
This typology represents cases where domestic production and imports are additive in terms of their contribution to retail sales. For example, both domestic landings (rho = 0.94) and imports (rho = 0.84) of halibut correlate with fresh retail sales (). While domestic halibut may be recognizable to consumers, particularly in the Pacific region, imports likely drive sales volume as halibut imports are significantly larger than domestic landings (137,000 tonnes/yr imported vs 13,600 tonnes/yr domestic) (NOAA Fisheries Citation2022b). As such, this is a case where a traditional consumption pattern based on domestic landings is augmented by imports to increase consumption and lower the price. Similar cases exist for mussels, clams, grouper, and snapper where consumers purchase both domestic and imported analogs in the same season, and on a volume-basis imports outweigh domestic production.
Domestic year-round supply
Domestic products with year-round supply include some forms of domestic aquaculture as well as fisheries that use freezing or canning to provide year-round supply. A good example of a domestic species with year-round retail sales is U.S. farmed catfish. The major peak in catfish retail sales is March but besides that there is little variation. Monthly farmed catfish production was not available, but retail sales suggest that there is little variation in supply, in part because catfish are primarily sold frozen. Domestic catfish compete with imported pangasius (Engle et al. Citation2022).
Imported year-round supply
The last typology includes imports that have year-round supply often with a diversity of sources, production methods, and segments (fresh, frozen, and canned). We selected salmon as an example (), which comes primarily from imports (400,000 tonnes/ry) and largely from aquaculture. The domestic salmon fishery in Alaska is one of the largest and most valuable in the United States, however imports overshadow domestic production, and domestic landings only appear to influence fresh retail salmon sales in the summer. Other examples of imports with year-round supply and large market shares include shrimp, tilapia, and canned tuna.
Conclusions
This study reviewed monthly fisheries landings and retail sales data from around the United States and identified times of the year when peaks in domestic seafood production matched demand for those products (i.e., aligned) and where they were not (i.e., misaligned). Misalignment can produce outcomes that are suboptimal for the U.S. harvesters. Misalignment between domestic production and consumption in December, for example, represented a missed opportunity for domestic producers where imports were required in order to meet seafood demand, while Spring and Summer domestic fisheries landings appeared aligned, meaning that landings supported fresh seafood peak consumption, particularly in coastal regions. National annual statistics mask important patterns in seasonal and sub-national consumption, and particularly where and when seafood is consumed and by whom (Love et al., Citation2022a). We identified local fisheries with strong regional markets and found that selling fresh and in season is a preferred strategy by producers. Based on seasonal alignments, we also proposed five typologies of retail seafood sales in the United States.
In most parts of the world fisheries are primarily managed as natural resources for biological conservation (Tlusty et al. Citation2019; Bennett et al. Citation2021; Garlock et al. Citation2022). The bias toward conservation objectives is pervasive despite the acknowledgement that fisheries are important to achieving broader societal goals of food provisioning and economic development (Kittinger et al. Citation2017), and the results highlight another margin where focus beyond the fishing activity may enhance social and economic objectives with potentially no detrimental effect on fish stocks. As such, this work can help fisheries managers and others optimize sustainable production of the U.S. wild capture seafood.
The U.S. consumers expect a year-round supply of seafood at supermarkets and demand is strongest during Winter and Lent, periods when domestic seasonal supply is low. Top-selling seafood products in the United States such as salmon and shrimp maintain a consistent year-round supply (Love, et al. Citation2022b) because they are largely farmed, imported, and include preserved forms (frozen, canned, etc.) (Wessells and Wilen Citation1993; Belton and Thilsted Citation2014; Asche et al. Citation2022b). Local fisheries producers are less likely to be able to span seasons and instead have seasonal ebbs and flows in retail sales, however, seafood dealers are able to regulate when products enter the marketplace, which can partially buffer this mismatch. Seasonal variation in fish supply and accessibility is quite common in many parts of the world, which has cascading effects on livelihoods, local economies, and nutrition (Gelli et al. Citation2020; Hasselberg et al. Citation2020; Thorne-Lyman et al. Citation2020). Variability in fishing is also influenced by regulatory closures to fisheries and culture (weekends and holidays) (Kroodsma et al. Citation2018). Educating consumers about seasonality in local wild caught seafood is recommended as well as increasing the connections between consumers and harvesters through direct marketing efforts (Stoll et al. Citation2015; Witter and Stoll Citation2017). Consumer perceptions, attitudes and beliefs of local food are also important (Palmer et al. Citation2017; Skallerud and Wien Citation2019), as well as supply chain infrastructure and a supportive policy environment (Imhoff and Badaracoo Citation2019).
Future studies can build off the findings of this study by disaggregating these data into markets for specific species (Asche et al. Citation2022a) or regions (Oregon Coast Visitors Association Citation2022), which could provide opportunities for improving local fishing communities and regional food systems. Retail seafood makes up the majority of seafood sales by volume and food service by value (Love et al. Citation2020), and future work is needed to characterize domestic fisheries sales to food service.
Seasonality is a natural feature of wild caught fisheries that introduces variation in food supply, and which often is amplified by fisheries management systems. Seasonal timing of landings patterns and linkages to consumption patterns can have a potentially strong impact on income for coastal communities as well as import patterns. This study helps explain seasonal trends in the U.S. seafood landings and consumer demand at a national and sub-national level, showing where alignment and misalignment occur, and opportunities for local fisheries. The results show several typologies for interactions between domestic and local landings and consumption, which to varying degrees interacts with seafood imports. As domestic supply is aligned with periods of high demand for relatively few species, this suggests that domestic fishers miss opportunities to meet consumer demand with associated detrimental impacts for coastal communities. Changes in the U.S. supply also has implications for producers and consumers in the rest of the world.
Author contributions
DCL and FA developed the project concept with input from JAG. DL and JZ conducted the analysis. JAG and DL provided data. DL and FA wrote the original manuscript. All authors were involved in editing and revision.
Acknowledgements
We thank the following individuals and agencies for providing monthly domestic landings data: Allen Blizel, Wisconsin Department of Natural Resources; David Caroffino, Michigan Department of Natural Resources; Jacob Rodmaker, Bad River Band of Lake Superior Chippewa, Mashkiiziibii Natural Resources; Ian Harding, Red Cliff Band of Lake Superior Chippewa, Natural Resources Divisions; Nicole Shaffer, Alabama Division of Natural Resources; Florida Fish and Wildlife Conservation Commission; Michael Harden, Louisiana Department of Wildlife and Fisheries; Jeremy Timbs and Crystal Matta, Mississippi Division of Marine Resources; Darin Topping, Texas Parks and Wildlife Department; Donna Bellais, Gulf States Marine Fisheries Commission; Alison Ferguson, Greater Atlantic Regional Fisheries Office; Sabrina Larsen, Alaska Department of Fish and Game; Brad Stenberg, Pacific Fisheries Information Network; Heather Konell, Atlantic States Marine Fisheries Commission; Ashley Tomita, NOAA Pacific Island Regional Office. We thank Jamie Harding, Johns Hopkins Center for a Livable Future for assistance with and . We thank Patricia Pinto da Silva, Northeast Fisheries Science Center, National Marine Fisheries Service, NOAA for reviewing the manuscript.
Disclosure statement
No potential conflict of interest was reported by the authors.
Data availability
Data are available upon request. Nielsen is a proprietary dataset and cannot be shared.
Additional information
Funding
References
- Anderson JL, Asche F, Garlock T. 2018. Globalization and commoditization: the transformation of the seafood market. J Commodity Market. 12:2–8. doi:10.1016/j.jcomm.2017.12.004
- Asche F, Garlock TM, Anderson JL, Bush SR, Smith MD, Anderson CM, Chu J, Garrett KA, Lem A, Lorenzen K, et al. 2018. Three pillars of sustainability in fisheries. Proc Natl Acad Sci U S A. 115(44):11221–11225. doi:10.1073/pnas.1807677115
- Asche F, Smith MD. 2018. Induced innovation in fisheries and aquaculture. Food Policy. 76:1–7. doi:10.1016/j.foodpol.2018.02.002
- Asche F, Oglend A, Smith MD. 2022a. Global markets and the commons: the role of imports in the US wild-caught shrimp market. Environ Res Lett. 17(4):045023. doi:10.1088/1748-9326/ac5b3e
- Asche F, Yang B, Gephart JA, Smith MD, Anderson JL, Camp EV, Garlock TM, Love DC, Oglend A, Straume H-M. 2022b. China’s seafood imports—not for domestic consumption? Science. 375(6579):386–388. doi:10.1126/science.abl4756
- Belton B, Thilsted SH. 2014. Fisheries in transition: food and nutrition security implications for the global South. Global Food Security. 3(1):59–66. doi:10.1016/j.gfs.2013.10.001
- Bennett A, Basurto X, Virdin J, Lin X, Betances SJ, Smith MD, Allison EH, Best BA, Brownell KD, Campbell LM, et al. 2021. Recognize fish as food in policy discourse and development funding. Ambio. 50(5):981–989. doi:10.1007/s13280-020-01451-4
- Birkenbach AM, Cojocaru AL, Asche F, Guttormsen AG, Smith MD. 2020. Seasonal harvest patterns in multispecies fisheries. Environ Resource Econ. 75(3):631–655. doi:10.1007/s10640-020-00402-7
- Birkenbach AM, Kaczan DJ, Smith MD. 2017. Catch shares slow the race to fish. Nature. 544(7649):223–226. doi:10.1038/nature21728
- Crona BI, Daw TM, Swartz W, Norström AV, Nyström M, Thyresson M, Folke C, Hentati‐Sundberg J, Österblom H, Deutsch L, et al. 2016. Masked, diluted and drowned out: how global seafood trade weakens signals from marine ecosystems. Fish Fish. 17(4):1175–1182. doi:10.1111/faf.12109
- Dahl RE, Oglend A. 2014. Fish price volatility. Mar Resour Econ. 29(4):305–322. doi:10.1086/678925
- Engle CR, Hanson T, Kumar G. 2022. Economic history of US catfish farming: lessons for growth and development of aquaculture. Aquacult Econ Manag. 26(1):1–35. doi:10.1080/13657305.2021.1896606
- FAO. 2020. The State of World Fisheries and Aquaculture 2020. Rome (Italy): FAO. doi:10.4060/ca9229en.
- Froehlich HE, Gentry RR, Lester SE, Rennick M, Lemoine HR, Tapia-Lewin S, Gardner L. 2022. Piecing together the data of the US marine aquaculture puzzle. J Environ Manage. 308:114623. doi:10.1016/j.jenvman.2022.114623
- Garlock TM, Nguyen L, Anderson JL, Musumba M. 2020. Market potential for Gulf of Mexico farm-raised finfish. Aquacult Econ Manag. 24(2):128–142. doi:10.1080/13657305.2019.1691676
- Garlock T, Anderson JL, Asche F, Smith MD, Camp E, Chu J, Lorenzen K, Vannuccini S. 2022. Global insights on managing fishery systems for the three pillars of sustainability. Fish Fish. 23(4):899–909. doi:10.1111/faf.12660
- Gelli A, Donovan J, Margolies A, Aberman N, Santacroce M, Chirwa E, Henson S, Hawkes C. 2020. Value chains to improve diets: diagnostics to support intervention design in Malawi. Global Food Security. 25:100321. doi:10.1016/j.gfs.2019.09.006
- Gephart JA, Froehlich HE, Branch TA. 2019. Opinion: to create sustainable seafood industries, the United States needs a better accounting of imports and exports. Proc Natl Acad Sci U S A. 116(19):9142–9146.
- Gephart JA, Pace ML. 2015. Structure and evolution of the global seafood trade network. Environ Res Lett. 10(12):125014. doi:10.1088/1748-9326/10/12/125014
- Hasselberg AE, Aakre I, Scholtens J, Overå R, Kolding J, Bank MS, Atter A, Kjellevold M. 2020. Fish for food and nutrition security in Ghana: challenges and opportunities. Global Food Security. 26:100380. doi:10.1016/j.gfs.2020.100380
- Homans FR, Wilen JE. 2005. Markets and rent dissipation in regulated open access fisheries. J Environ Econ Manag. 49(2):381–404. doi:10.1016/j.jeem.2003.12.008
- Imhoff D, Badaracoo C. 2019. Local food. In: The Farm Bill. Berlin (Heidelberg): Springer; p. 189–198.
- Kittinger JN, Teh LCL, Allison EH, Bennett NJ, Crowder LB, Finkbeiner EM, Hicks C, Scarton CG, Nakamura K, Ota Y, et al. 2017. Committing to socially responsible seafood. Science. 356(6341):912–913. doi:10.1126/science.aam9969
- Kroodsma DA, Mayorga J, Hochberg T, Miller NA, Boerder K, Ferretti F, Wilson A, Bergman B, White TD, Block BA, et al. 2018. Tracking the global footprint of fisheries. Science. 359(6378):904–908. doi:10.1126/science.aao5646
- Kumar G, Engle C, Avery J, Dorman L, Whitis G, Roy LA, Xie L. 2021. Characteristics of early adoption and non-adoption of alternative catfish production technologies in the U.S. Aquacult Econ Manag. 25(1):70–88. doi:10.1080/13657305.2020.1803446
- Love DC, Asche F, Conrad Z, Young R, Harding J, Nussbaumer EM, Thorne-Lyman AL, Neff R. 2020. Food sources and expenditures for seafood in the United States. Nutrients. 12(6):1810. doi:10.3390/nu12061810
- Love DC, Turvey C, Harding J, Young R, Ramsing R, F Tlusty M, Fry JP, Nguyen L, Asche F, Nussbaumer EM, et al. 2021. Nutrition and origin of US chain restaurant seafood. Am J Clin Nutr. 113(6):1546–1555. doi:10.1093/ajcn/nqaa437
- Love DC, Thorne-Lyman AL, Conrad Z, Gephart JA, Asche F, Godo-Solo D, McDowell A, Nussbaumer EM, Bloem MW. 2022a. Affordability influences nutritional quality of seafood consumption among income and race/ethnicity groups in the United States. Am J Clin Nutr. 116(2):415–425. doi:10.1093/ajcn/nqac099
- Love DC, Asche F, Young R, Nussbaumer EM, Anderson JL, Botta R, Conrad Z, Froehlich HE, Garlock TM, Gephart JA. 2022b. An overview of retail sales of seafood in the USA, 2017–2019. Rev Fish Sci Aquacult. 2022:1–12.
- Lowitt K. 2013. Examining fisheries contributions to community food security: findings from a household seafood consumption survey on the west coast of Newfoundland. J Hunger Environ Nutr. 8(2):221–241. doi:10.1080/19320248.2013.786668
- Lowitt KN. 2014. A coastal foodscape: examining the relationship between changing fisheries and community food security on the west coast of Newfoundland. E&S. 19(3):49. doi:10.5751/ES-06498-190348
- Miller J. 2021. An urchin opportunity awaits in New England. Global Seafood Alliance. [accessed 2022 May 17]. https://www.globalseafood.org/advocate/an-urchin-opportunity-awaits-in-new-england/.
- NOAA Fisheries. 2022a. Bluefish.
- NOAA Fisheries. 2022b. Commercial Fisheries Landings.
- Oregon Coast Visitors Association. 2022. Oregon (Sea)Food Matters. [accessed 2022 May 17]. https://www.oregoncoastfoodvision.org/.
- Palmer A, Santo R, Berlin L, Bonanno A, Clancy K, Giesecke C, Hinrichs CC, Lee R, McNab P, Rocker S. 2017. Between global and local: exploring regional food systems from the perspectives of four communities in the US Northeast. J Agric Food Syst Community Dev. 7(4):187–205. doi:10.5304/jafscd.2017.074.017
- Pettersen IK, Asche F. 2020. Hedonic price analysis of ex-vessel cod markets in Norway. Mar Resour Econ. 35(4):343–359. doi:10.1086/710052
- Pincinato RB, Asche F, Cojocaru AL, Liu Y, Roll KH. 2022. The impact of transferable fishing quotas on cost, price, and season length. Mar Resour Econ. 37(1):53–63. doi:10.1086/716728
- Richard N, Pivarnik L. 2020. Rhode Island branding program for local seafood: consumer perceptions, awareness, and willingness-to-pay. J Agric Food Syst Community Dev. 9(2):1–17. doi:10.5304/jafscd.2020.092.011
- Skallerud K, Wien AH. 2019. Preference for local food as a matter of helping behaviour: insights from Norway. Journal of Rural Studies. 67:79–88. doi:10.1016/j.jrurstud.2019.02.020
- Stoll JS, Dubik BA, Campbell LM. 2015. Local seafood: rethinking the direct marketing paradigm. E&S. 20(2):40. doi:10.5751/ES-07686-200240
- Thorn B. 2021. Seafood is a draw during Lent, even during a pandemic. [accessed 2022 May 17]. https://www.restaurant-hospitality.com/limited-service/seafood-draw-during-lent-even-during-pandemic.
- Thorne-Lyman AL, Shaikh S, Mehra S, Wu LSF, Ali H, Alland K, Schultze KJ, Mitra M, Hur J, Christian P, et al. 2020. Dietary patterns of >30,000 adolescents 9–15 years of age in rural Bangladesh. Ann N Y Acad Sci. 1468(1):3–15. doi:10.1111/nyas.14207
- Tlusty MF, Tyedmers P, Bailey M, Ziegler F, Henriksson PJG, Béné C, Bush S, Newton R, Asche F, Little DC, et al. 2019. Reframing the sustainable seafood narrative. Global Environ Change. 59:101991. doi:10.1016/j.gloenvcha.2019.101991
- Tveterås S, Asche F, Bellemare MF, Smith MD, Guttormsen AG, Lem A, Lien K, Vannuccini S. 2012. Fish is food-the FAO’s fish price index. PLoS One. 7(5):e36731. doi:10.1371/journal.pone.0036731
- US Census. 2022. USA Trade.
- Wessells CR, Wilen JE. 1993. Inventory dissipation in the Japanese wholesale salmon market. Mar Resour Econ. 8(1):1–16. doi:10.1086/mre.8.1.42629043
- Witter A, Stoll J. 2017. Participation and resistance: alternative seafood marketing in a neoliberalera. Marine Policy. 80:130–140. doi:10.1016/j.marpol.2016.09.023