
 ?Mathematical formulae have been encoded as MathML and are displayed in this HTML version using MathJax in order to improve their display. Uncheck the box to turn MathJax off. This feature requires Javascript. Click on a formula to zoom.
Abstract
Chromium (III) is one of the chemicals widely used in various industrial processes. The wastewater containing Chromium (III) can be interconverted to Cr (VI) in the environment, which is one of the most toxic chemicals to biological systems. This paper investigates the removal of chromium (III) from aqueous solutions by adsorption process using abundant vesicular basalt available around Abbay River in Ethiopia. The batch adsorption method has been employed to evaluate the effect of various experimental parameters (pH, ionic strength, initial concentration and contact time) on Cr (III) adsorption. The adsorption process was highly dependent on pH. The maximum adsorption capacity was 0.976 mg g−1 at pH 6, initial concentration of 100 mg L−1 and adsorbent dosage of 50 g L−1. Kinetic experiments indicated that the pseudo-second-order model displayed the best correlation with adsorption kinetic data. The adsorption mechanism of Cr (III) onto the surface of the vesicular basalt involved film diffusion and/or intraparticle diffusion during the reaction. Equilibrium studies indicated that the Langmuir Isotherm model was found to be in better correlation with experimental data. This study indicated that vesicular basalt rock owned good potential for the treatment of Cr (III) containing polluted water.
PUBLIC INTEREST STATEMENT
Chromium is widely applicable in elemental or compound forms in various industrial processes, such as tanning, electroplating, treatment of wood, making of alloys, dyes, paints, etc. In developing countries, large quantities of chromium (III) containing wastewater are discharged to the nearby water bodies and open damp sites without treatment, due to the absence of strong binding laws. Chromium (III) can be interconverted into chromium (VI), which is toxic and carcinogenic to humans. The wastewater treatment methods require a high investment that the firms do not want to expend to it. This article investigated vesicular basalt rock, which is locally available and low cost has the potential to be used as an alternative method for the removal of chromium (III) from polluted water.
1. Introduction
Chromium is a trace metallic element widely applicable in various industrial processes such as chromium plating, chrome tanning, chromium chemical production, wood preserving, textile dyeing, pigmenting, pulp and paper production and ferrochromium or chromium metal production. Such activities have increased the levels of chromium pollution in the water, soil and air cause harmful effects on human health and the environment (Cheng, Zhou, Li, Lu, & Lin, Citation2014).
Chromium occurs in the environment most commonly as Cr (III) and Cr (VI) oxidation states that are quite different in chemical, biological and environmental properties. Cr (III) and Cr (VI) are interconvertible depending on pH, presence of oxidizing and reducing compounds, the total chromium concentration in soil, water and atmospheric systems (Deng & Stone, Citation1996; Riemsdijk, Koopal, & Hiemstra, Citation2006; Wittbrodt & Palmer, Citation1995). Cr (III) is important for living organisms, mainly for proper functioning, control of glucose and lipid metabolism (Anderson, Citation1989). But in higher concentrations, it mainly affects respiratory and immunological systems and likely to produce genotoxic DNA effects in the cell nucleus (Agency for Toxic Substances and Disease Registry [ATSDR], Citation2012). Cr (VI) is toxic and its effects are carcinogenic, cause allergies, damages kidney, liver and gastritis in humans (ATSDR, Citation2012; Gad, Citation1989). There are various methods for the removal of chromium and other toxic metals from aqueous solution, such as chemical precipitation, adsorption, ion exchange and reverse osmosis (Kurniawan, Chan, Lo, & Babel, Citation2006). However, existing methods have several challenges, which make them not applicable for developing countries around the world. Recently, more attention has been given for development of low cost adsorbents for the removal of heavy metals from water such as rocks (Kyziol-Komosińska, Rosik-Dulewska, Dzieniszewska, Pajak, & Krzyzewska, Citation2014), industrial by-products (Mohan & Singh, Citation2002), and agricultural wastes (Elmola, Hamdy, Kassem, & Hady, Citation2016).
Volcanic rocks are formed by solidification and cooling of magma. Vesicular basalt (VB) is a volcanic rock formed when extrusive rocks from magma reaching the surface either as lava or fragmental ejecta (Carlson, Plummer, & Hammersley, Citation2008). This type of rocks is typically composed of plagioclase, pyroxene, olivine, quartz, hematite and magnetite (Alemu, Lemma, Gabbiye, Alula, & Desta, Citation2018; Kwon, Yun, Kim, Mayer, & Hutcheon, Citation2005). It is abundantly found in many parts of the world such as Central America, Western Europe, Western South America (Soubrand-Colin, Bril, Neel, Courtin-Nomade, & Martin, Citation2005), Central Africa (Benedetti et al., Citation2003) and East Africa (Tadesse, Milesi, & Deschamps, Citation2003).
Vesicular basalt rocks are among natural materials having better features to be used as low-cost adsorbents of heavy metals mainly due to their important properties such as high surface area and local availability in large quantities (Alemayehu & Lennartz, Citation2009).VB is the most abundant rock type with many vesicles (cavities) both inside and at its surface (Carlson et al., Citation2008). The potential of volcanic rocks to remove heavy metals such as Zn (II), Cd (II), Cu (II), Pb (II), Ni (II) and Cr (VI) has been reported (Alemayehu et al., Citation2011; Alemayehu & Lennartz, Citation2010; Alemu et al., Citation2018; Kwon et al., Citation2005; Sekomo, Rousseau, & Lens, Citation2012). But lacks information about the adsorptive interactions between Cr (III) and the VB volcanic rocks in the aqueous system.
The main objectives of the present work were to assess the effects of pH, ion strength, initial concentration of Cr (III) and contact time on the adsorption of Cr (III) in aqueous solutions. The adsorption process was analyzed using common kinetic and isotherm models. This study therefore attempts to the management of Cr (III) from anthropogenic sources like tanneries, with locally abundant VB rock to lessen the environmental pollution commonly happening in developing countries like Ethiopia due to inactive regulations.
2. Materials and methods
2.1. Materials
Chromium chloride hexahydrate (CrCl3.6H2O) (≥99% purity), hydrochloric acid (36.5–38%) and potassium nitrate (99.0–100% assay) were purchased from BDH laboratory supplies. Sodium hydroxide pellets (extra pure 98%) was purchased from Research Lab Fine Chemical Industries and Ultrapure water (conductivity = 0.05 μs/cm), was obtained from Evoqua Water Technologies. All the reagents were of an analytical grade. The grey VB volcanic rocks used for this research were collected around Bahir Dar City (North West of Ethiopia) close to Lake Tana and Abbay (Blue Nile) River. The rocks were crushed using Geocrusher and sieved in between 90 and 500 μm particle size. It was washed with ultra-pure water and dried in an oven at 105°C overnight. The dried VB rock was used for further adsorption lab studies.
2.2. FT-IR and SEM/EDS analysis of VB
The FT-IR spectra were recorded using Perkin Elmer Spectrum 65 Spectrometer (USA) in the mid-infrared region (4000–400 cm−1) with a spectral resolution of 2 cm−1 using a pressed KBr pellet technique. The morphological study and elemental analysis of the ground VB was done using scanning electron microscope equipped with energy dispersive spectrometer (SEM-EDS), JEOL, JSM-6500F (Japan) at an accelerating voltage of 15 kV and a beam current of 1–3 nA.
2.3. Determination of pH point zero charge (pHpzc)
The pHpzc of the VB samples was determined by batch equilibration technique (Lazarevic et al., Citation2007). 5 g of VB was added to each five series of flasks that contain 100 mL 0.01 mol L−1 KNO3 solution and adjusted in pH range of 1–9 using 0.1 mol L−1 of HCl or NaOH. Equilibration was carried out by shaking for 12 h at room temperature using Benchtop shaker (ZHWY-334) at a speed of 250 rpm. The dispersions were then filtered and the final pH of the solutions (pHf) was determined. The point of zero charge was found from a plot pHf versus pHi.
2.4. Adsorption studies
A stock solution of 1000 mg L−1 Cr (III) was prepared from chromium chloride hexahydrate (CrCl3.6H2O). Standard solutions of varying concentrations for adsorption experiments were prepared by a series of dilution of the stock solutions using ultrapure water. The ionic strength of the solution was attuned to 0.01, 0.05 and 0.1 mol L−1 using KNO3 as background electrolyte. The pH of the solution was adjusted in the range of 2–7 using 0.1 mol L−1 NaOH and HCl. 5 g of VB was mixed with 100 mL solution containing a concentration of 100 mg L−1 of Cr (III) in a 250 mL polypropylene Erlenmeyer flask to the point of equilibrium (8 h) without further control of pH. Control (only the test substance without adsorbent) and blank (only the adsorbent without the test substance) experiments had been carried out for each set of experiments. The flasks were tightly wrapped with polyethylene parafilm to avoid pH changes during experiments due to CO2 escape. The reactions were taking place at 25 ± 0.5°C with continuous stirring at 300 rpm.
After the end of each adsorption process, it was allowed to settle for 5 min. Subsequently, the final pH was measured. The pH changes in the experiments were observed up to a maximum of 0.35 pH. 10 mL of the supernatant sample was centrifuged and filtered through Whatman filter (pore size 2.5 μm) and the concentration of Cr (III) was determined using Inductively Coupled Plasma-Optical Emission Spectroscopy (Zewdu & Amare, Citation2018). Each experiment was conducted twice and data represent the mean value, moreover each measurement was done after calibrating with standard solutions. The amount of chromium adsorbed at time t, qt, and the absorbed percentage were calculated using the Equations (1) and (2), respectively.
where is the amount of chromium (III) adsorbed per unit mass of the adsorbent (mg g−1), Co is initial concentration of chromium (III) in contact with adsorbents (mg L−1), Ct is concentration of chromium (III) in aqueous solution at time t (mg L−1), V is volume of the aqueous solution in contact with the adsorbents (L), m is mass of the VB (g) and A (%) is adsorbed amount given as percentage at time t.
2.5. Adsorption kinetics
The adsorption kinetic experiments for adsorption of Cr (III) were carried in 500 mL flask containing 5 g of VB and 350 mL solutions with initial concentrations of 20, 60 and 100 mg L−1 Cr (III) at an optimum pH and contact time between 0 and 540 min. The reactors agitation speed and temperature during the reaction were identical to section 2.4.
2.6. Adsorption isotherm
The adsorption isotherm studies were performed in a series of 250 mL Erlenmeyer flasks filled with 100 mL Cr (III) containing solutions of varying concentrations (20, 60 and 100 mg L−1) maintained at 25 ± 0.5°C, reaction time of 540 min and optimum pH of 6. Then, 5 g VB was added into each flask. After adsorption equilibrium time, the concentrations of Cr (III) were determined using the same procedure mentioned above.
3. Results and discussion
3.1. FT-IR analysis
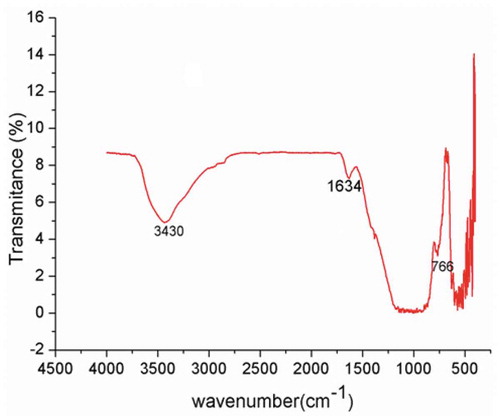
The functional groups on the surface of the VB were analyzusing FT-IR spectroscopy. The FT-IR spectrum of the VB is shown in Figure . Adsorption bands observed at 3430 cm−1 and 1634 cm−1 correspond to -OH symmetric stretching and H-OH bending vibrations, respectively (Kyziol-Komosińska et al., Citation2014; Ohlin, Bazin, Thibault-Starzyk, Hedlund, & Grahn, Citation2013). The reststrahlen band region in the range of 1200–800 cm−1 showed more overlap analogous to mineral features silica polymerization such as plagioclase, pyroxene and olivine. Such mineral compositions are typical for basaltic rocks (Alemu et al., Citation2018; Morgan-Sagastume & Noyola, Citation2008). Adsorption bands at 535 cm−1, 584 cm−1 and 766 cm−1 indicated Fe-O bending of magnetite, bending of hematite and O-Si-O bending of silicates (Seetha & Velraj, Citation2016). When the spectra in the range of 500–400 cm−1 zoom in, adsorption bands at 424 cm−1, 456 cm−1 and 480 cm−1 indicated the characteristic deformation of vibration of Si-O (Maia et al., Citation2014; Saikia et al., Citation2003).
Figure 1. Infrared spectrum of powdered VB sample between wavenumber ranges 4000–400 cm−1.
3.2. SEM/EDS analysis of VB before and after adsorption of Cr (III)
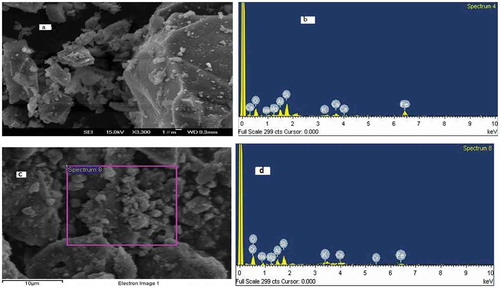
The SEM image and EDS analysis of the VB before and after adsorption of Cr (III) are indicated in Figure ) and b below. The SEM image consists of uniform and ridged morphology of grey, light grey and white platelets of different sizes. The uniform grey part indicates feldspars (plagioclase), light grey part silica and white platelets Fe-bearing aluminosilicates. The SEM image of the VB was identified based on micrographs studies of rocks (Gonzalez, Edwards, Lorbiecke, Winburn, & Webster, Citation2003; Michalski, Kraft, Sharp, & Christensen, Citation2006). The EDS analysis indicated that oxygen (48.46%) and silicon (17.37%) by weight were the major compositions of the VB rock. Moreover, Al (9.55%), Fe (8.83%) and ca (8.8%), Na (4.87%), Mg (0.87%) and K (1.25%) were identified as shown in Table ).
Table 1a. Elemental analysis of the VB before adsorption and after adsorption.
Table 1b. Elemental analysis of the VB before adsorption using EDS spectroscopy.
The SEM/EDS analysis was used to confirm the adsorption of Cr (III) onto the surface of the VB after the reaction was over (Figure ). Even though difficult to identify Cr adsorbed on the SEM image, the EDS analysis showed 2.97% by weight Cr in the exhausted VB (Table ). This confirms the adsorption of Cr (III) onto the surface of the VB during the reaction.
Figure 2. SEM images of VB before (a) and after adsorption (c) of Cr (III); EDS spectra before (b) and after adsorption (d) of Cr (III).
3.3. Effect of pH and ion strength
In adsorption studies, pH of the solution affects the surface charge of the adsorbent (Dada, Adekola, & Odebunmi, Citation2017). The influence of pH for the adsorption of Cr (III) on the VB surface was investigated as shown in Figure ). It is seen from Figure ) that adsorption of Cr (III) increased with increasing pH. At pH 2 the removal efficiency of Cr (III) was very low (0.036–2.03%). The adsorption was increased sharply to 40.93–46.43% at pH 4. Meanwhile, the maximum adsorption observed was 54.67% at pH 6. To explain the effect of pH for adsorption of Cr (III) on the VB surface, it is essential to understand the speciation of Cr (III) in aqueous solution. According to Rai, Sass, and Moore (Citation1987), Cr (III) exists in aqueous solutions as hexa-aquachromium (3+) and its hydrolysis products.
Cr (H2O)63+ + H2O ⇌ Cr (OH)(H2O)52+ + H3O+ pka = 3.85 (1)
Cr (OH) (H2O)52+ + H2O ⇌ Cr (OH)2(H2O)4+ + H3O+ pka = 10.06 (2)
Cr (OH)2(H2O)4+ + H2O ⇌ Cr (OH)3 + H3O+ pka = 18.70 (3)
The occurrences of these species of chromium (III) complex are pH dependent. According to the Cr (III) speciation diagram, the predominant Cr (III) species in a water solution were hexa-aquachromium at pH 2; Cr(OH)2+ at pH 4(60%); Cr(OH)2+ at pH 5 (70%); and Cr(OH)2+, Cr(OH)2+; and Cr3(OH)45+ approximately 40%, 35%, 25%, respectively, at pH 6 (Kotas & Stasicka, Citation2000; Leyva-Ramos, Fuentes-Rubio, Guerrero-Coronado, & Mendoza-Barron, Citation1995). This means that the Cr (III) was adsorbed on the VB as Cr (OH)2+, Cr (OH)2+; or Cr3(OH)45+ species.
The pHpzc value for the VB was 7.6 (Figure )). At the pHpzc, the surface of the VB has all its charges balanced. The surface of VB is negatively charged above the value of pHpzc, while the surface of the VB is positively charged below the value of the pHpzc (Sheng et al., Citation2012). The smallest adsorption capacity occurred at pH 2 because of the strong electrostatic repulsion of highly protonated ions of the solution with positively charged surface of the VB. An increase in the adsorption of Cr (III) in the pH range of 2–6 might be due to reduction of repulsion of cations of Cr (III) complexes in the solution with positively charged VB surface. Above pH value of 6.4, Cr (III) precipitates as Cr (OH)3 (Liu et al., Citation2016). All other adsorption experiments were conducted at pH 6, for maximum adsorption of Cr (III) onto the VB.
Figure 3. Effect of pH and ionic strength for Cr (III) adsorption onto the VB (dose 50 g L−1; Cr (III) conc. 100 mg L−1; temperature 25 ± 0.5°C) (a); Determination of pHpzc of Crushed VB in 0.01 mol L−1 KNO3 solution (b).
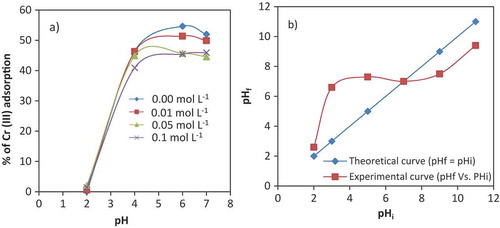
Ionic strength, like pH, also affects the adsorption of a system. Figure ) shows the removal of Cr (III) at different ionic strength (0, 0.01, 0.05 and 0.1 mol L−1) as a function of pH (2–7) onto VB. The percentage of removal of Cr (III) decreased with increasing of ionic strength of aqueous solutions. The removal of Cr (III) decreased in between 1.99% and 9.195% in the stated ionic strength and pH ranges. This might be due to the competition of K+ with Cr3+, Cr (OH)2+, Cr (OH)2+, or Cr3(OH)45+ with the surface of VB. Effect of increased ionic strength on the activity coefficient of Cr (III) limits transformation of Cr (III) from aqueous solutions to the adsorbent surfaces and with increasing ionic strengths, the electrostatic repulsions would be reduced with increasing ionic strength lowering the available active sites on VB surface (Strawn & Sparks, Citation1999).
3.4. Effect of contact time
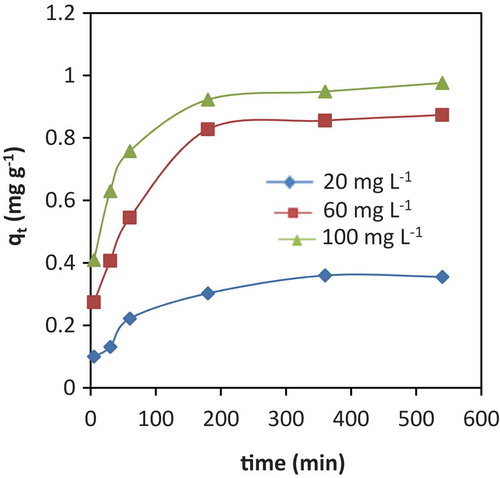
The adsorption of Cr (III) onto the VB is examined at different contact time intervals using 20, 60 and 100 mg L−1 initial concentrations as shown in Figure . It is observed that a rapid uptake was experienced in the first 60 min but slowed down noticeably as reaction approached to equilibrium after 480 min. The fast removal in the first 60 min might be due to the availability of vacant sites at the VB surface (Pathania, Sharma, & Singh, Citation2017). For lower 20 mg L−1 and higher 100 mg L−1 initial concentrations, the maximum adsorption capacity onto the VB surface reached up to 0.360 and 0.976 mg g−1 respectively. The considerable uptake at higher initial concentration is a consequence of larger concentration gradient between the bulk solution and sorbent phase. This is in agreement with other adsorption studies of Cr from aqueous solution onto a solid surface (Mthombeni, Onyango, & Aoyi, Citation2015; Rodrigues, Maschio, Silva, & Silva, Citation2010).
Figure 4. Effect of contact time on adsorption of different concentrations of Cr (III) ions (20, 60 and 100 mg L−1) on VB. (Adsorbent dose 50 g L−1, solution pH 6 and reaction temperature 25 ± 0.5°C).
3.5. Adsorption kinetics
The adsorption kinetics of Cr (III) onto the VB, experimental data was modelled by fitting pseudo-first order (Equation (3)) (Lagergren, Citation1898), pseudo-second order (equation 4) (Ho & McKay, Citation1999) and Elovich (Equation (5)) (Allen & Scaife, Citation1966):
where (mg g−1) is the amounts of Cr (III) adsorbed at equilibrium;
(mg g−1) is the amount of Cr (III) adsorbed at time t (min), and
(min−1) and
(g mg−1min−1) are the rate constants of the pseudo-first-order and pseudo-second-order adsorption kinetic equations, respectively. α is a constant related to chemisorption rate and β is a constant which depicts the extent of surface coverage.
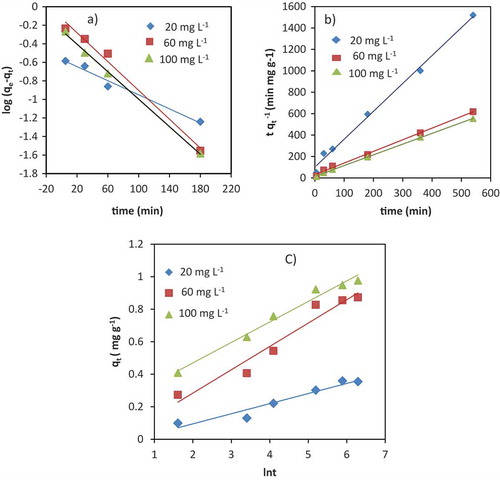
Kinetic studies of Cr (III) adsorption to the surface of the VB using the pseudo-first order, pseudo-second order and Elovich models are shown in Figure –c) below. A comparison of the results with the correlation coefficients is shown in Table . The R2 for the pseudo-first-order kinetic model for initial concentrations (20, 60 and 100 mg L−1) are high. But, large differences are observed between the theoretical and experimental equilibrium adsorption capacities (qe). This indicates that pseudo-first order model is not appropriate for the adsorption of Cr (III) by VB. The R2 value of Elovich kinetic model is relatively lower than pseudo-first order model, but the qe calculated is nearly identical to the experimental value. Considering the assumption of this model, the surface of the VB showed heterogeneity and occurrence of chemisorptive type of interactions (Jang, Yoo, Choi, Park, & Kan, Citation2018).
Table 2. Kinetic parameters for Cr (III) adsorption onto VB
In comparison to the two models, pseudo-second order kinetic linear plot (Figure )) gives very good straight lines for different initial Cr (III) concentrations. The correlation coefficients (R2) were ≥0.99 for all concentrations (Table ). The calculated values also agreed well with the experimental data. These indicate that the pseudo-second order kinetic model is suitable for describing the adsorption kinetics of Cr (III) onto the VB surface.
Figure 5. Adsorption kinetics: pseudo-first order kinetic linear plot (a); pseudo-second order kinetic linear plot (b) and Elovich kinetic linear plots for adsorption of Cr (III) onto VB {initial concentration (20, 60 and 100 mg L−1), solution pH 6,adsorbent dosage 50 g L−1, temperature 25 ± 0.5°C)}.
3.6. Adsorption mechanism
The adsorption mechanisms used to determine the rate-controlling steps of adsorption of Cr (III) onto the VB were intraparticle diffusion, Bangham and Boyd models. The kinetic data were analyzed using the Equations (6) to (11) below.
Intraparticle diffusion (Weber and Morris model):
The intraparticle diffusion equation (Weber & Morris, Citation1963) is given as:
where kid is the intraparticle diffusion rate constant (mg g−1min−0.5), C is the intercept (mg g−1).
Bangham model:
where ko and α are constants and t is time (min).
Boyd model:
The Boyd model equations (Boyd, Adamson, & Myers, Citation1947) are given in Equations (8) and (9) below as:
where F is the function of the solute sorbed at different time t. Bt is the mathematical function of F.
Bt is calculated by transforming and then integrating Equation (8) and (9) as follows (Reichenberg, Citation1953):
For F value < 0.85,
F value > 0.85, (11)
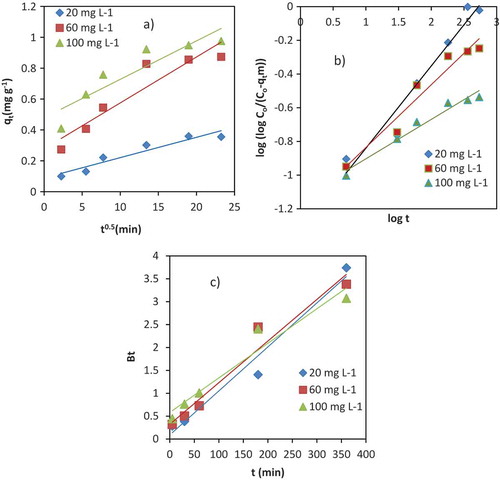
The linear plots of intraparticle diffusion, Bangham and Boyd models are shown in Figure (a–c) respectively. The intraparticle diffusion rate constant (Kid), C and R2 values were estimated from the plot of qt versus t1/2 (Table ). The linear plot for different concentrations of Cr (III) in a wide range of contact time did not pass through the origin (Figure (a)). This indicated that intraparticle diffusion was not the only rate-determining step during the adsorption process. The intraparticle diffusion rate constant (kid) increased with increasing initial concentration of Cr (III) in the solution. This might be due to the formation of higher concentration gradient from increased initial concentrations that will ultimately cause faster diffusion and adsorption (Nethaji, Sivasamy, & Mandal, Citation2013).
Table 3. Adsorption mechanism models for the adsorption of Cr (III) onto the VB
The pore diffusion processes were analyzed using the Bangham model to confirm intraparticle diffusion based on the linear plot log (log Co/(Co-qtm)) versus log t (Aharoni, Sideman, & Hoffer, Citation1979). The constants α and Ko were obtained from the intercept and slope, respectively. R2 values were between 0.95 and 0.97 for different initial concentrations of Cr (III) at 25°C (Figure (b), Table ), which confirmed that pore-diffusion was one of the main mechanisms during the adsorption processes.
The Boyd’s model was also used to further investigate the adsorption of Cr (III) onto the VB was controlled either by particle diffusion or film diffusion. The Boyd linear plot (Bt versus t) of the experimental data did not pass through the origin, but close to it (Figure (c)). R2 values were between 0.928 and 0.971 (Table ). This showed film diffusion or other external mass transport adsorption mechanism as one of the major adsorption mechanisms in the adsorption process. This might be due to the electrostatic interaction between Cr (III) and the VB surface. All these adsorption models indicated that the adsorption process of Cr (III) onto VB involved film diffusion and/or intraparticle diffusion. This is in agreement with the study of Alemayehu et al. (Citation2011).
Figure 6. Linear plots of Intraparticle Diffusion (a), Bangham (b), and Boyd models (c) for adsorption mechanism of Cr (III) onto the VB rock.
3.7. Adsorption isotherms
Adsorption of Cr (III) onto VB at equilibrium, most commonly used isotherm adsorption models: the Langmuir, Freundlich and Temkin were used to describe the obtained equilibrium data. The non-linear and linear equations of Langmuir (12), Freundlich (13) and Temkin (14) adsorption models are shown in Table .
Table 4. Adsorption isotherm models
where Ce is the equilibrium concentration (mg L−1); qe is the adsorption capacity at equilibrium time (mg g−1); qmax is the maximum adsorption capacity (mg g−1); b is the Langmuir constant (L mg−1); Kf is the Freundlich constant (indicating adsorption capacity) (L g −1); 1/n is the heterogeneity of the sorption sites and adsorption intensity. B is a constant related to heat of adsorption (J mol−1) and expressed as B = RT/b. R is the gas constant (8.314 J mol−1K−1) and T is the absolute temperature (K), b is the Temkin constant (J mol−1) and A is the Temkin isotherm constant (L g−1).
The linear and non-linear plots of Langmuir equation (a, d), Freundlich equation (b, e) and Temkin equation (C, f) are indicated in Figure , respectively. The adsorption isotherms and equilibrium data fittings are shown in Table . According to the linear and non-linear isotherm, correlation coefficients (R2), the equilibrium data are better described by the Langmuir isotherm. The maximum adsorption capacity of Cr (III) on the surface of the VB was 0.91 mg g−1 in the non-linear and 0.872 mg g−1 for the linear Langmuir adsorption isotherm. The non-linear plots of Freundlich and Temkin isotherm correlation coefficients (R2) were higher than the linear plots. The calculated value of 1/n from Freundlich isotherm was 0.207, which indicated that the surface was favourable for adsorption and chemosorptive type of adsorption. This is in agreement with Alemayehu et al. (Citation2011).
Figure 7. The fitting of Langmuir (a), Freundlich (b) and Temkin (C) isotherms of Cr (III) adsorption onto VB volcanic rock, pH 6, dose 50 g L−1.
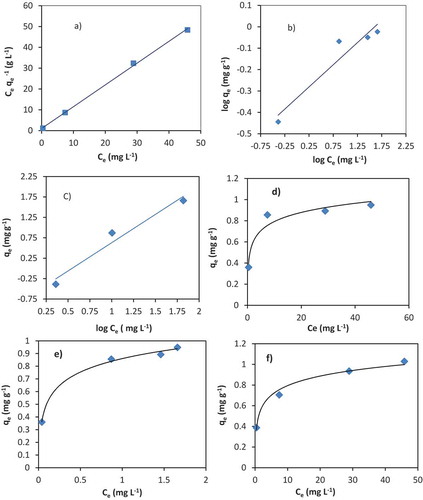
Table 5. Langmuir, Freundlich and Temkin isotherm parameters for adsorption of Cr (III) onto VB
The essential features of the Langmuir adsorption isotherm parameter can be used to predict the interaction or affinity of adsorbent and adsorbate based on a dimensionless constant known as equilibrium parameter or separation factor (RL) (Hall, Eagleton, Crivos, & Ermeulen, Citation1996):
where Co is initial concentration (mg L−1) & b is Langmuir constant (L mg−1). The RL value shows the shape of the isotherm: 0< RL<1, favourable; RL>1, unfavourable; RL = 1, linear; and RL = 0, irreversible adsorption. The calculated value of the separation factor (RL) for Cr (III) ion adsorption onto VB was 0.01. This value shows that the adsorption process is favourable.
The potential of adsorption of Cr (III) by VB was compared with other adsorbents reported in literature. The values of adsorption capacities are presented in Table with their experimental settings. Experimental studies containing Cr (III) aqueous solutions showed good adsorption potential of Cr (III) onto the surface of VB. Based on its abundant availability, ease of preparation, environmental friendly use and general cost, it might be preferred compared with other adsorbents and could be ideal to reduce Cr (III) contaminated water and wastewater from industries or other sources.
Table 6. Comparison of adsorption capacity Cr (III) onto VB with other adsorbents
4. Conclusion
In this study, the VB was characterized using FT-IR, SEM and EDS. It was composed of minerals such as plagioclase, pyroxene, olivine, hematite and magnetite. The major elemental compositions by weight were 48.46% Oxygen, 17.37% Silicon and 9.55% aluminium. The adsorption potential of Cr (III) onto the VB was studied using batch technique under different experimental parameters including pH, ionic strength, contact time and initial concentrations. The pH of the medium was found to be the controlling factor in adsorption process. The percentage of adsorption of Cr (III) increased with increasing pH. At pH 6 the maximum Cr (III) adsorbed onto the VB was 54.67%. The influence of ionic strength was investigated and showed reduction in the adsorption of Cr (III) onto the surface of the VB. kinetic studies showed that equilibrium adsorption time was dependent on the initial concentration of Cr (III) in the solution. The adsorption of Cr (III) onto VB followed the Pseudo-second order kinetics. The adsorption process indicated film diffusion and/or intraparticle diffusion mechanisms during the reaction. The experimental data fit well with Langmuir isotherm model. Therefore, adsorption of Cr (III) from polluted water onto the vesicular basalt surface as alternative low-cost adsorbent appears to be viable. Further studies have to be done with real samples containing Cr (III) to evaluate its adsorption potential with other computing ions onto the surface of the vesicular basalt.
Competing interests
The authors declare no competing interests.
Acknowledgements
The authors are grateful to United States Agency for International Development (USAID), Ethiopian Institute of Water Resources (Addis Ababa University) and Biotechnology Research Institute (Bahir Dar University) for financial support of the project. We are also thankful to Connecticut University (USA) for providing access to its digital online electronic library.
Additional information
Notes on contributors
Agegnehu Alemu
Agegnehu Alemu works as a lecturer in the Department of Chemistry, College of Science, Bahir Dar University, Ethiopia. He obtained his BSc and MSc Degrees in chemistry and environmental chemistry from Addis Ababa University. Agegnehu is a PhD candidate in Ethiopian Institute of Water Resources in water and wastewater treatment stream in collaboration with Connecticut University from the US.
Agegnehu has more than 13 years of teaching and research experience. He is assistant professor in the department of chemistry. His research interests are in analysis of toxic water pollutants from anthropogenic and geogenic sources and development of treatment methods for the welfare of the environment and human health. Other interests are synthesis and characterization of materials for the treatment of polluted water, instrumental analysis of other environmental components such as soil, air and biological materials.
References
- Agency for Toxic Substances and Disease Registry. (2012). A toxicological profile for chromium. Atlanta, GA: U.S. Department of Health and Human Services, Public Health Services. Retrieved from www.atsdr.cdc.gov
- Aharoni, C., Sideman, S., & Hoffer, E. (1979). Adsorption of phosphate ions by collodion‐coated alumina. Journal of Chemical Technology and Biotechnology, 29(7), 404–18. doi:10.1002/jctb.503290703
- Alemayehu, E., Bruhnb, S. T., & Lennartza, B. (2011). Adsorption behaviour of Cr (VI) onto macro and micro-vesicular volcanic rocks from water. Separation and Purification Technology, 78, 55–61. doi:10.1016/j.seppur.2011.01.020
- Alemayehu, E., & Lennartz, B. (2009). Virgin volcanic rocks: Kinetics & equilibrium studies for the adsorption of cadmium from water. Journal of Hazardous Materials, 169, 395–401. doi:10.1016/j.jhazmat.2009.03.109
- Alemayehu, E., & Lennartz, B. (2010). Adsorptive removal of nickel from water using volcanic rocks. Applied Geochemistry, 25(2010), 1596–1602. doi:10.1016/j.apgeochem.2010.08.009
- Alemu, A., Lemma, B., Gabbiye, N., Alula, M. T., & Desta, M. T. (2018). Removal of chromium (VI) from aqueous solution using vesicular basalt: A potential low cost wastewater treatment system. Heliyon, 4(7), e00682. doi:10.1016/j.heliyon.2018
- Allen, J. A., & Scaife, P. H. (1966). The Elovich equation and chemisorption kinetics. Australian Journal of Chemistry, 19(11), 2015–2023. doi:10.1071/CH9662015c
- Anderson, R. A. (1989). Essentiality of chromium in humans. Science of the Total Environment, 86, 75–81. doi:10.1016/0048-9697(89)90196-4
- Benedetti, M. F., Dia, A., Riotte, J., Chabaux, F., Gerard, M., Boulegue, J., … Ildefonse, P. (2003). Chemical weathering of basaltic lava flows undergoing extreme climatic conditions: The water geochemistry record. Chemical Geology, 201, 1–17. doi:10.1016/S0009-2541(03)00231-6
- Bosco, S. M. D., Jimenez, R. S., & Carvalho, W. A. (2005). .Removal of toxic metals from wastewater by Brazilian natural scolecite. Journal of Colloid Interface Science, 281, 424–431. doi:10.1016/j.jcis.2004.08.060
- Boyd, G. E., Adamson, A. W., & Myers, J. L. (1947). The exchange adsorption of ions from aqueous solutions by organic zeolites. II. Kinetics1. Journal of the American Chemical Society, 69(11), 2836–2848. doi:10.1021/ja01203a066
- Carlson, D. H., Plummer, C. C., & Hammersley, L. (2008). Physical Geology: Earth Revealed (9th ed.). New York, NY: McGraw-Hill.
- Chen, Y. G., He, Y., Ye, W. M., Lin, C. H., Zhang, X. F., & Ye, B. (2012). Removal of chromium (III) from aqueous solutions by adsorption on bentonite from Gaomiaozi, China. Environmental Earth Sciences, 67, 1261–1268. doi:10.1007/s12665/-012-1569-3
- Cheng, H., Zhou, T., Li, Q., Lu, L. A., & Lin, C. (2014). Anthropogenic Chromium Emissions in China from 1990 to 2009. PloS One, 9, 1–9. doi:10.1371/journal.pone.0087753
- Dada, A. O., Adekola, F. A., & Odebunmi, E. O. (2017). Kinetics, mechanism, isotherm and thermodynamic studies of liquid phase adsorption of Pb2+ onto wood activated carbon supported zerovalent iron (WAC-ZVI) nanocomposite. Cogent Chemistry, 3(1), 1351653. doi:10.1080/23312009.2017.1351653
- Deng, B., & Stone, A. T. (1996). Surface-Catalyzed Chromium (VI) Reduction: The TiO2−Cr (VI) - Mandelic Acid System. Environmental Science and Technology, 30, 463–472. doi:10.1021/es950156c
- Elmola, E. S., Hamdy, W., Kassem, A., & Hady, A. A. (2016). Comparison of different rice straw based adsorbents for chromium removal from aqueous solutions. Desalination and Water Treatment, 57, 6991–6999. doi:10.1080/1944994.2015.1015175
- Freundlich, H. M. F. (1906). Over the adsorption in solution. The Journal of Physical Chemistry, 57, 385–470.
- Gad, C. S. (1989). Acute and chronic systemic chromium toxicity. Science of the Total Environment, 86, 149–157. doi:10.1016/0048-9697(89)90201-5
- Gonzalez, R. M., Edwards, T. E., Lorbiecke, T. D., Winburn, R. S., & Webster, J. R. (2003). Analysis of geologic Materials using rietveld quantitative X-ray diffraction. Advanced X-ray Analysis, 46, 204e209.
- Hall, K. R., Eagleton, L. C., Crivos, A. A., & Ermeulen, T. V. (1996). Pore and solid diffusion kinetics in a fixed bed adsorption under constant pattern conditions. Industrial & Engineering Chemistry Fundamentals, 5, 212–223. doi:10.1021/i160018a011
- Ho, Y. S., & McKay, G. (1999). Pseudo-second order model for sorption processes. Process Biochemistry, 34(5), 451–465. doi:10.1016/S0032-9592(98)00112-5
- Jang, H. M., Yoo, S., Choi, Y. K., Park, S., & Kan, E. (2018). Adsorption isotherm, kinetic modeling and mechanism of tetracycline on Pinus taeda-derived activated biochar. Bioresource Technology, 259, 24–31. doi:10.1016/j.biortech.2018.03.013
- Khan, S. A., Rehman, R., & Khan, M. A. (1995). Adsorption of chromium (III), chromium (VI) and silver (I) on bentonite. Waste Management, 15, 271–282. doi:10.1016/0956-053X(95)00025-U
- Koppelman, M. H., Emerson, A. B., & Dillard, J. G. (1980). Adsorbed Cr (III) on chlorite, illite, and kaolinite: An X- ray photoelectron spectroscopic study. Clays and Clay Minerals, 28, 119–124. doi:10.1346/CCMN.1980.0280207
- Kotas, J., & Stasicka, Z. (2000). Chromium occurrence in the environment and methods of its speciation. Environmental Pollution, 107, 263–283. doi:10.1016/S0269-7491(99)00168-2
- Kurniawan, T. A., Chan, G. Y. S., Lo, W. H. A., & Babel, S. (2006). Physicochemical treatment techniques for wastewater laden with heavy metals. Chemical Engineering Journal, 118, 83–98. doi:10.1016/j.cej.2006.01.015
- Kwon, J. S., Yun, S. T., Kim, S. O., Mayer, B., & Hutcheon, I. (2005). Sorption of Zn (II) in aqueous solution by scoria. Chemosphere, 60, 1416–1426. doi:10.1016/j.chemosphere.2005.01.078
- Kyziol-Komosińska, J., Rosik-Dulewska, C., Dzieniszewska, A., Pajak, M., & Krzyzewska, I. (2014). Removal of Cr (III) ions from water and wastewater by sorption onto peats and clays occurring in an overburden of lignite beds in Central Poland. Environmental Protection Engineering, 40, 5–22. doi:10.5277/epe140101
- Lagergren, S. K. (1898). About the theory of so-called adsorption of soluble substances. Kungliga Svenska Vetenskapsakademiens. Handingarl, 24(4), 1–39.
- Langmuir, I. (1918). The adsorption of gases on plane surfaces of glass, mica and platinum. Journal of American Chemical. Society, 40, 1361–1403. doi:10.1021/ja02242a004
- Lazarevic, S., Jankovic-Castvan, I., Jovanovic, D., Milonjic, S., Janackovic, D., & Petrovic, R. (2007). Adsorption of Pb2+, Cd2+ and Sr2+ ions onto natural and acid-activated sepiolites. Applied Clay Science, 37, 47–57. doi:10.1010.1016/j.clay.2006.11.008
- Leyva-Ramos, R., Fuentes-Rubio, L., Guerrero-Coronado, R. M., & Mendoza-Barron, J. (1995). Adsorption of trivalent chromium from aqueous solutions onto activated carbon. Journal of Chemical Technology & Biotechnology, 62, 64–67. doi:10.1002/jctb.280620110
- Liu, J., Wu, X., Hu, Y., Dai, C., Peng, Q., & Liang, D. (2016). Effects of Cu (II) on the adsorption behaviours of Cr (III) and Cr (VI) onto kaolin. Journal of Chemistry. doi:10.1155/2016/3069754
- Maia, A. Á. B., Angélica, R. S., de Freitas Neves, R., Pöllmann, H., Straub, C., & Saalwaechter, K. (2014). Use of 29Si and 27Al MAS NMR to study thermal activation of kaolinites from Brazilian Amazon kaolin wastes. Applied Clay Science, 87, 189–196. doi:10.1016/j.clay.2013.10.028
- Michalski, J. R., Kraft, M. D., Sharp, T. G., & Christensen, P. R. (2006). Effects of chemical weathering on infrared spectra of Columbia River basalt and spectral interpretations of Martian alteration. Earth planet. Science Letter, 248(3–4), 822e829.
- Mohan, D., & Singh, K. P. (2002). Single and multi-component adsorption of cadmium and zinc using activated carbon derived from bagasse-an agricultural waste. Water Research, 36, 2304–2318. doi:10.1016/S0043-1354(01)00447-X
- Morgan-Sagastume, J. M., & Noyola, A. (2008). Evaluation of an aerobic submerged filter packed with volcanic scoria. Bioresource Technology, 99(7), 2528–2536. doi:10.1016/j.biortech.2007.04.068
- Mthombeni, N. H., Onyango, M. S., & Aoyi, O. (2015). Adsorption of hexavalent chromium onto magnetic natural zeolite-polymer composite. Journal of Taiwan Institute of Chemical Engineering, 50, 242–251. doi:10.1016/j.jtice.2014.12.037
- Nethaji, S., Sivasamy, A., & Mandal, A. B. (2013). Adsorption isotherms, kinetics and mechanism for the adsorption of cationic and anionic dyes onto carbonaceous particles prepared from Juglans regia shell biomass. International Journal of Environmental Science and Technology, 10(2), 231–242. doi:10.1007/s13762-012-0112-0
- Ohlin, L., Bazin, P., Thibault-Starzyk, F., Hedlund, J., & Grahn, M. (2013). Adsorption of CO2, CH4, and H2O in zeolite ZSM-5 studied using in situ ATR-FTIR spectroscopy. The Journal of Physical Chemistry C, 117(33), 16972–16982. doi:10.1021/jp4037183
- Pathania, D., Sharma, S., & Singh, P. (2017). Removal of methylene blue by adsorption onto activated carbon developed from Ficus carica bast. Arabian Journal of Chemistry, 10, S1445–S1451. doi:10.1016/j.arabjc.2013.04.021
- Rai, D., Sass, B. M., & Moore, D. A. (1987). Chromium (III) hydrolysis constants and solubility of chromium (III) hydroxide. Inorganic Chemistry, 26, 345–349. doi:10.1021/ic00250a002
- Reichenberg, D. (1953). Properties of ion-exchange resins in relation to their structure. III. Kinetics of Exchange. Journal of the American Chemical Society, 75(3), 589–597.
- Riemsdijk, W. H. V., Koopal, L. K., & Hiemstra, T. (2006). Adsorption of humic substances on goethite: Comparison between humic acids and fulvic acids. Environmental Science and Technology, 40, 7494–7500. doi:10.1021/es060777d
- Rodrigues, L. A., Maschio, L. J., Silva, R. E., & Silva, M. L. (2010). Adsorption of Cr (VI) from aqueous solution by hydrous zirconium oxide. Journal of Hazardous Materials, 173, 630–636. doi:10.1016/j.jhazmat.2009.08.131
- Saikia, N. J., Bharali, D. J., Sengupta, P., Bordoloi, D., Goswamee, R. L., Saikia, P. C., & Borthakur, P. C. (2003). Characterization, beneficiation and utilization of kaolinite clay from Assam, India. Applied Clay Science, 24(1–2), 93–103. doi:10.1016/S0169-1317(03)00151-0
- Seetha, D., & Velraj, G. (2016). Characterization and chemometric analysis of ancient pot shards trenched from Arpakkam, Tamil Nadu, India. Journal of Applied Research and Technology, 14(5), 345–353. doi:10.1016/j.jart.2016.08.002
- Sekomo, C. B., Rousseau, D. P. L., & Lens, P. N. L. (2012). .Use of Gisenyi volcanic rock for adsorptive removal of Cd (II), Cu (II), Pb (II), and Zn (II) from wastewater. Water Air Soil Pollution, 223, 533–547. doi:10.1007/s11270-011-0880-z
- Sheng, G., Li, Y., Yang, X., Ren, X., Yang, S., Hu, J., & Wang, X. (2012). Efficient removal of arsenate by versatile magnetic graphene oxide composites. RSC Advances, 2, 12400–12407. doi:10.1039/C2RA21623J
- Soubrand-Colin, M., Bril, H., Neel, C., Courtin-Nomade, A., & Martin, F. (2005). Weathering of basaltic rocks from the French Massif Central: Origin and fate of Ni, Cr, Zn and Cu. The Canadian Mineralogist, 43, 1077–109114. doi:10.2113/gscanmin.43.3.1077
- Strawn, D. G., & Sparks, D. L. (1999). The use of XAFS to distinguish between-inner and outer-sphere lead adsorption complexes on montmorillonite. Journal of Colloid and Interface Science, 216(2), 257–269. https://doi.org/10.1006/jcis.1999.6330
- Tadesse, S., Milesi, J. P., & Deschamps, Y. (2003). Geology and mineral potential of Ethiopia: A note on geology and mineral map of Ethiopia. Journal of African Earth Sciences, 36, 273–313. doi:10.1016/S0899-5362(03)00048-4
- Temkin, M. J., & Pyzhev, V. (1940). Recent modifications to Langmuir Isotherms. Acta Physiochim, 12, 217–222.
- Weber, W. J., & Morris, J. C. (1963). Kinetics of adsorption on carbon from solution. Journal of the Sanitary Engineering Division, 89(2), 31–60.
- Wittbrodt, P. R., & Palmer, C. D. (1995). Reduction of Cr (VI) in the presence of excess soil fulvic acid. Environmental Science and Technology, 29, 255–263. doi:10.1021/es00001a033
- Zewdu, F., & Amare, M. (2018). Determination of the level of hexavalent, trivalent, and total chromium in the discharged effluent of Bahir Dar tannery using ICP-OES and UV–Visible spectrometry. Cogent Chemistry, 4(1), 1534566. doi:10.1080/23312009.2018.1534566