Abstract
This study aimed at comparing two types of IELTS writing task 1 namely, bar charts and tables of Iranian test takers in terms of four IELTS writing assessment criteria including task achievement, coherence and cohesion, lexical resource, and grammar range and accuracy. The study also sought to identify test takers’ strengths and weaknesses in the writing task 1 with respect to all four areas. To this end, forty-five Iranian IELTS test takers aged 19 to 42 were involved in the study. In the beginning, the participants were assigned to perform a bar chart IELTS writing task 1. Within 10 days, the same test takers were presented with a table description task. Their writing performances were then rated based on the IELTS writing rubric. The results indicated that the candidates’ writing performance was significantly higher in bar chart description tasks than table-based writing tasks. To provide a detailed picture of the contribution of each criterion to the total score variance, we performed a multi-linear regression analysis, the results of which manifested that the candidates were more adept at accomplishing task achievement, and grammar range and accuracy in table and bar chart writing tasks, respectively. The findings also indicated that they did not do well in terms of coherence and cohesion performing table writing. Nor did they perform effectively on the lexical resource in bar chart writing. The results of the study carry crucial pedagogical implications for teachers, IELTS trainers, researchers, and syllabus designers.
PUBLIC INTEREST STATEMENT
IELTS academic writing skill is of pivotal importance for educational success in academic institutions. The academic writing task 1 comes in two task types, namely bar charts and tables. This study aimed at comparing these two types of tasks and identifying test takers’ strengths and weaknesses in terms of four IELTS writing assessment criteria including task achievement, coherence and cohesion, lexical resource, and grammar range and accuracy. The results indicated that the candidates’ writing performance was significantly higher in bar chart tasks than table-based tasks. The results also manifested that the candidates were more adept at accomplishing task achievement, and grammar range and accuracy in table and bar chart tasks, respectively. The findings also indicated that they did not do well regarding coherence and cohesion performing table writing. Nor did they perform effectively on the lexical resource in bar chart writing.
1. Introduction
Researchers in the field of second/foreign language teaching assume writing as the most exacting language learning skill (e.g. Deane et al., Citation2008; Nueva, Citation2016; Richards & Renandya, Citation2002). The complexity of the writing skill arises from the fact that writing demands a high command of language while at the same time employing specific macro-skills, namely inventing an idea, mapping out sentences, and translating sentences into the target language (Al-Haq & Al-Sobh, Citation2010). To Jahin and Idrees (Citation2012), the trade-off effect between various writing dimensions of content, lexis, purpose, mechanics, and organization has made writing in academic contexts a difficult task leading to the learner frustration. Given the complex construct of writing skill, language learners are likely to encounter problems improving their writing ability. Several language teaching researchers (e.g. Ong, Citation2011; Rivers, Citation1981) claim that students’ written compositions globally are, with few exceptions, unsatisfactory. Condon and Kelly-Riley (Citation2004) pointed out that writing skill is the key to achievement in all educational and non-educational settings. Even so, it is the most complicated skill to learn for both native and non-native learners (Umar & Ratharkrishnan, Citation2012).
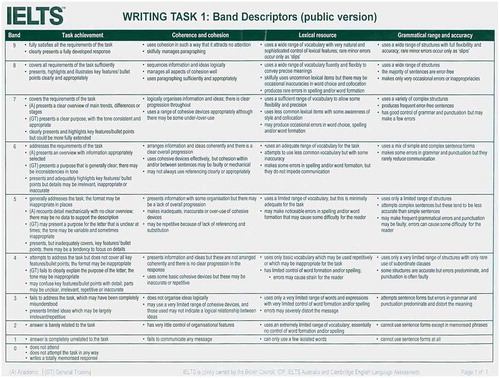
As indicated by Golder, Reeder, and Fleming (Citation2011), IELTS has recently become a high-stakes proficiency test across the globe. It is a task-based test assessing the four language skills of listening, reading, writing, and speaking. As evidence of English language proficiency, IELTS academic writing skill is of pivotal importance for educational success in academic institutions. The academic writing task 1 comes in two task types, namely a graphic set of data e.g. bar charts and a statistical set of data including tables requiring test takers to write an account on bar charts and tabulated numbers depending on task type. Test takers’ writing performance is assessed on a four-criterion descriptor on a scale of 1 to 9.The four writing scoring criteria include Task Achievement (TA), Cohesion and Coherence (CC), Lexical Resource (LR), and Grammar Range and Accuracy (GRA) (See Appendix A3). The current study examines all four criteria, laid down in the form of an official band descriptor (See Appendix A3).
The reason behind embarking upon this research was actually based on the researcher’s prolonged experience in teaching IELTS preparatory courses in Iran. Iranian IELTS candidates find the writing task 1 with table prompts daunting. Along the same lines, the IELTS writing tasks in particular, the writing task 1, has largely been unresearched. To fill the lacuna in the literature, we made an attempt to address Iranian IELTS academic test takers’ writing task 1 getting tables or bar charts. The findings of this study are significant in that they can provide insights into the effective instruction of the writing task 1. It is hoped that this study heightens IELTS trainers’ awareness regarding teaching writing module in task1.For the purposes of this research, the following five research questions guided our study:
Is there a significant difference between the performances of Iranian IELTS candidates’ writing task 1 given a bar chart and a table in terms of the total score of all four IELTS writing assessment criteria?
What is the relative weight for the variance of task achievement that contributes to the total scores of Iranian IELTS candidates in writing task1 either in a bar chart or a table?
What is the relative weight for the variance of coherence and cohesion that contributes to the total scores of Iranian IELTS candidates in writing task1 either in a bar chart or a table?
What is the relative weight for the variance of lexical resource that contributes to the total scores of Iranian IELTS candidates in writing task1 either in a bar chart or a table?
What is the relative weight for the variance of grammar range and accuracy that contributes to the total scores of Iranian IELTS candidates in writing task1 either in a bar chart or a table?
2. Literature review
2.1. IELTS academic writing task 1
As an integrated skill, the IELTS writing task 1 requires test takers to summarize or describe information presented in the form of graphic set of data e.g. bar charts and a statistical set of data e.g. tables using at least 150 words within 20 minutes per task. Tahassoni (Citation2018) states that the academic writing task 1 is characterized by specific input and predominantly predictable output. It is basically concerned with transferring data or facts within bar charts, tables or diagrams. However, speculations and explanations beyond the scope of the data provided are by no means intended. The IELTS examiner evaluates the writing task 1 on the basis of the following criteria:
1. Has the candidate summarized the information appropriately by selecting and properly reporting the main features?
2. Has the candidate made comparisons properly and sufficiently?
3. Has the candidate provided an overview of main trends/comparisons/stages?
4. Has the candidate written a clear overview or summary of the report?
(Tahassoni, Citation2018)
2.2. Scoring procedures in IELTS writing
Schoonen (Citation2005) is of the opinion that writing assessment is a challenging and arduous task. One reason is that the task result might be influenced by different aspects of writing evaluation. Factors including writing proficiency, task topic, language use, and content may influence task results. IELTS examiners assess candidates’ writing performance in terms of various criteria such as task achievement, coherence and cohesion, grammatical range and accuracy, and lexical resource. As pointed out by Ostovar-Namaghi and Safaee (Citation2017), IELTS candidates should be kept abreast of scoring criteria. Moreover, they emphasize that band descriptors should be clarified to the candidates so that they know what band scores 6, 7, and 8 entail. Based on Ostovar-Namaghi and Safaee (Citation2017), teachers’ outlooks on teaching writing in IELTS preparatory courses unveiled a series of strategies that assist teachers in preparing IELTS candidates for writing tasks. For instance, in keeping with the previous studies (e.g. Ambe, Citation2008; Bagheri & Zare, Citation2009), the participants of this study maintained that exposing IELTS candidates to sample answers significantly improves their performance in both task 1 and task 2. Teaching pre-fabricated patterns was another point of convergence with past studies. However, previous studies touched on the usefulness of these patterns in general classes rather than in IELTS preparatory courses (e.g. Ghonsooly-Hazare, Khaghaninezhad, & Shahriari-Ahmadi, Citation2010; Heidarnezhadian, Aliakbari, & Mashhadi, Citation2015; Li, Citation2014). Furthermore, participants acknowledged the significance of teaching discourse markers as an effective intervention which was consistent with the previous findings (e.g. Ahmadi-Fatalaki & Nazari, Citation2015; Patriana, Rachmajanti, & Mukminatien, Citation2016; Serajfard & Allami, Citation2012). Finally, in accord with the previous findings, the participants of this study were in favor of teaching grammar and vocabulary as a prerequisite to writing (e.g. Decarrico, Citation2001; Frodesen, Citation2001; Fu, Citation2009; Rajabi & Dezhkam, Citation2014).
According to Pell (Citation2017), the 7 essential facts concerning the writing task 1 are as follows:
1. Test takers doing the academic test will write a report on a data set, map, or process.
2. They must write 150 words or more.
3. They should spend around 20 minutes on this part of the test.
4. Task 2 is worth 1/3 of their total mark on the writing test.
5. They will be assessed based on 4 writing assessment criteria (each criterion values 25 %).
6. The most important thing is that they can demonstrate that they can clearly communicate in English.
7. The key to doing well is to know exactly what IELTS examiners expect test takers to do.
Many students feel worried about these small details rather than focusing on what really matters in improving their performance. These facts will help learners have a deep understanding of what the test is and how it is scored. Accordingly, they could go about improving their performance.
Concerning the scoring procedure, some studies investigated the influence of corrective feedback on IELTS test takers’ writing performance (e.g. Ganji, Citation2009; Ketabi & Torabi, Citation2013; Paulus, Citation1999; Vahdani-Sanavi & Nemati, Citation2014). As a leading instance, Ganji (Citation2009) found that IELTS test takers receiving peer-correction and self-correction treatment outperformed those presented with the instructor correction as a treatment. Furthermore, they discovered that peer-correction was the most efficient vehicle for providing students with corrective feedback.
2.3. Empirical studies on the effects of task types on writing skill
O’Loughlin and Wigglesworth (Citation2003) studied how the data description of graphs such as bar charts, bar graphs, and tables could influence the writing performance. Having meticulously analyzed writing papers, they realized that test takers wrote more linguistically complicated reports for tasks containing fewer data represented in graphs than for tasks presenting more data in graphs. The final results demonstrated that the way of data presentation did not make a significant difference with respect to the difficulty level of graphs.
The effect of task type on IELTS candidates’ writing performance has been investigated in some studies (e.g. Ahmadi & Mansoordehghan, Citation2014; Lan, Citation2015; O’Loughlin & Wigglesworth, Citation2003). A study was conducted by Ahmadi and Mansoordehghan (Citation2014) to show the effect of task 1 and task 2 on test takers’ writing performance. The results of their study indicated that there was no statistically significant difference between test takers’ performance in the two tasks. Nonetheless, Lan (Citation2015) found that test takers’ performed significantly better in terms of accuracy in easy tasks like task 1, i.e. graphic description. Closely associated with this study, O’Loughlin and Wigglesworth (Citation2003) revealed that easier tasks yielded more complex structures because they require less information for processing.
Visual arts are believed to be of paramount importance in promoting meaning in students’ writings (Olshansky, Citation1994; Trainin, Andrzejczak, & Poldberg, Citation2006). To uncover the relationship between visual arts and writing, Trainin et al. (Citation2006) employed Vygotskian cognitive hypothesis wherein visual arts helped students nurture cognitive functions in their writing performance and enhance the skills essential for writing while looking at pictures. Furthermore, the findings revealed that visual arts played a crucial role in aiding students to develop more proficient and coherent writing tasks. In a similar study, Olshansky (Citation2008) found that students developed their vocabulary immensely because of integrating visuals into their writing task and sharing ideas and thoughts with their classmates. In a similar vein, Randle (Citation2010) investigated the effect of visual arts on writing process enhancement among fourth-grade students. The results unveiled the fact that using art images proved fruitful in motivating students to write more creatively and coherently. Likewise, visual arts helped them write imaginative stories and foster some skills necessary for their daily life. Moreover, a study carried out by Tajzadeh, Jahandar, and Khodabandelou (Citation2013) explored the influence of visual task implementation on Iranian intermediate EFL writing skill. The underlying objective of this study was to determine whether visual presentation might strengthen the writing ability of these students. The results indicated that the quality of writing in the experimental group significantly improved after receiving visual presentation as a treatment. Furthermore, Lok (Citation2014) conducted a qualitative study to examine the impact of visual arts on improving writing performance. The results demonstrated that integrating visual arts into writing curriculum significantly enhanced students’ writing skill and boosted their motivation for writing.
3. Methodology
3.1. Participants
The participants of this study were 45 IELTS candidates who had already taken a preparatory IELTS course at Safirelian IELTS House in Bushehr, Iran. They were both 19 male and 26 female IELTS candidates with the age range of 19 to 42 speaking Persian as their first language. Their aim was to prepare for the real test of IELTS. Having finished the preparatory course, they took complete MOCK IELTS test prior to the actual IELTS test. This type of test is usually held at the end of IELTS preparatory courses in this institute. Participating in the low-cost MOCK IELTS test helps them weigh up their preparation for the real IELTS test. This study adopted the convenience sampling method because the IELTS candidates were conveniently accessible to the researcher.
3.2. Instruments
The two instruments utilized in this study were two types of the IELTS academic writing task 1 tests namely, bar charts (See Appendix A1) and tables (See Appendix A2). These tests were parts of a complete MOCK IELTS test adapted from IELTS Cambridge book written by IELTS examiners. Considering the allocated time in the IELTS exam, the candidates were awarded 20 minutes to write a report of a minimum of 150 words per task.
In this study, previous IELTS tests prepared by IELTS examiners were employed in order to help IELTS candidates get familiar with sample tests. The reason behind adopting these pre-designed tests was twofold: They are deemed reliable, i.e. test takers without practice effect are likely to obtain the same score. The test takers were asked to write a report based on the information presented in the task. In fact, they should yield a writing report which gives a picture of their writing ability. Secondly, since these tests have previously been administered as real IELTS tests, they were supposed to be valid as well. It is worth noting that for the sake of not jeopardizing the validity and reliability of these tests, the candidates were asked at the beginning of the test administration whether they have already seen the MOCK IELTS test. To assess their English proficiency, test takers pay for taking this test. The policy of this institute is to replace the tests in case the candidates declare that they have already seen them. All candidates claimed that they had not seen the tests previously.
3.3. Procedure
To gather the necessary data to answer the research questions of the study, the following procedures were established. At first, in order to have a natural administration of the IELTS test and data collection, 45 IELTS candidates who had taken a preparatory IELTS course were selected based on the convenience sampling technique at Safirelian IELTS House. As the study purported to investigate the candidates’ performance, gender was not controlled and no placement test was administered. In fact, this study collected a natural sample identical to that of a real IELTS test. Next, a complete MOCK IELTS test was administered precisely similar to the real IELTS test. They were then asked to take part in another IELTS test within 10 days. It is noteworthy to mention that the candidates were informed of the purpose of the study at the end of the test to avoid the Hawthorn effect. They consented that the data of these tests would be utilized for a research project while their names would be kept confidential. Although the candidates were acquainted with the IELTS test, we assured that they understood how to answer the tests, that is, writing instructions were precisely elaborated on prior to the administration of the tests.
The writing section of the test consisted of a bar chart and a table which did not entail many items of numerical data. The test takers were required to describe the bar chart and table. They were not asked to analyze the data or to explain why the figure was high or low. In a similar vein, no specialized knowledge was required to perform the task.
The first bar chart-based writing task required test takers to write a report of at least 150 words within 20 minutes precisely similar to the IELTS test. According to the bar chart, test takers were prompted to summarize the information and make comparisons where relevant (See Appendix A1). Then, all papers were collected and after 10 days, the second test was administered to the same test takers. This time, test takers got a table-based writing task, requiring them to write a report within 20 minutes typical of the real IELTS test. They were supposed to describe information presented in the form of a table (See Appendix A2). Finally, their papers were photocopied at the end of both tests for statistical analyses. Since the researcher was not allowed to have access to the original papers, he removed candidates’ names from the photocopied papers and applied codes instead.
3.4. Data analysis
Both types of tests were marked by two scorers using the IELTS writing task 1 band descriptor. Lougheed (Citation2016) maintains that scores for IELTS writing tasks are measured as band scores on a scale from 1 to 9. Each band displays a level of learner’s ability. This band descriptor was used by two scorers (one of them was the researcher) who are IELTS trainers at Safirelian IELTS Institute. Both scorers have about 15 years of experience teaching preparatory IELTS courses and were well-informed about the descriptor. The data collected from writing scores were analyzed using IBM SPSS Statistics 24. The four criteria of IELTS academic writing task 1 were equally weighted on the scale of 1 to 9. The final scores for the writing task 1 were an average of marks awarded on the four areas:
Task achievement: all parts of the question should be answered by candidates, pertinent answers and supporting ideas should be given as well.
Coherence and cohesion: test takers’ ideas must be organized into paragraphs in a way that they can be read and understood easily. Their ideas can be linked using words like hence, although, therefore, etc.
Lexical resource: a wide variety of vocabulary items must be used. Moreover, communication must not be affected by errors.
Grammatical range and accuracy: a wide range of grammatical structures must be applied, too. As with lexical resource, understanding should not be hindered by grammatical errors.
The first scorer (i.e. the researcher) assessed the test takers’ reports. Within one week, the same rater remarked the writings. That was how the intra-rater reliability was controlled. Following this, a second rater marked the reports once more. Then, the inter-rater reliability was calculated based on the results obtained. Then the sets of scores were compared using paired samples t-test. Moreover, a multiple linear regression analysis was run in order to measure the relative weight for the variance of each criterion that contributed to the total writing score of the candidates in the writing task 1.
4. Results
4.1. Intra-rater reliability
The two types of tests were scored using IELTS writing task 1 band descriptor. First, the reports were scored by the first rater. Within one week, the same rater remarked the reports. The intra-rater reliability of the obtained ratings was calculated using the Pearson product-moment correlation coefficient. The results are summarized in Tables and .
Table 1. Intra-rater reliability (Table task)
Table 2. Intra-rater reliability (Bar chart task)
As portrayed in Tables and , there was a high and significant consistency between the two rating attempts performed by the first rater on the table (r = .90, sig. = .00) and bar chart tasks (r = .92, sig. = .00). According to Cohen (Citation1988), correlation scores between the scales of 0.50 up to 1 are large indicating high inter-relations.
4.2. Inter-rater reliability
Following the two rating attempts performed by the first rater, a second rater scored the reports once more. By averaging the first rater’s scores, one set of scores was obtained which was correlated with the ratings of the second rater to estimate their inter-rater reliability. The results are summarized in Table .
Table 3. Inter-rater reliability (Table task)
Based on the results concerning the table writing task as depicted in Table , the correlation between the two ratings done by two raters was .85 (sig. = .00). The results presented in Table also demonstrated that correlation between the two ratings for the bar chart writing task turned out to be .89 (sig. = .00). Therefore, there was a high consistency between the two ratings.
Table 4. Inter-rater reliability (Bar chart task)
4.3. Addressing research question 1
The first objective of this study was to investigate if there was a significant difference between performances of Iranian IELTS candidates’ writing task 1 given a table and a bar chart in terms of the total score of all four IELTS writing assessment criteria. To find out the answer to this research question, the paired samples t-test was run. Table displays the results of the descriptive statistics.
Table 5. Descriptive statistics of candidates’ IELTS academic writing scores
According to Table , the participants’ total writing scores in table and chart task 1 equal 4.93 and 5.36., respectively. Table shows the results of the paired samples t-test.
Table 6. Paired samples t-test of total scores in task 1(Bar chart and table task)
As demonstrated in Table , there was a significant difference between the participants’ total writing scores in the bar chart and table task 1 (sig. = .00). Based on the results of the descriptive statistics in Table , the participants gained higher total scores in bar chart task 1 (mean = 5.36) than table task 1 (mean = 4.93).
4.4. Addressing research questions 2,3,4, and 5
In response to research questions 2, 3, 4, and 5, a multiple linear regression analysis was run. Therefore, the amount of variance accounting for by each writing assessment criterion to the total scores was measured. The underlying aim was to determine how effective each criterion was and how much variance was accounted for by each criterion. In doing so, the strongest and weakest areas of candidates’ writing performance were detected.
The data of the dependent variable against each independent variable were plotted to explore the linear relationship between the dependable and independable variables (Norušis, Citation1988). The findings demonstrated that the relationships between the independent variables (criteria) and the dependent variables (total scores) were realistically linear. After running the multiple regression analysis, the results were obtained as follows:
According to the results in Table , the independent variables explain 78.8% of the variability of the overall writing proficiency score. The F-ratio in the ANOVA tests (Table ) shows whether the overall regression model is a good fit for the data.
Table 7. Variability analysis of bar chart’s overall writing scores
Table 8. Analysis of overall regression model in bar chart task (ANOVAa)
Table portrays that the independent variables statistically and significantly predicted the dependent variable (writing proficiency score), F (4, 40) = 37.444, p < .05 (i.e. the regression model is a good fit for the data).
Based on the results in Table , the two variables LR (β = .23, Sig = .027) and GRA (β = .40, Sig = .000) significantly predicted the writing proficiency scores.
Table 9. Multi-linear regression analysis of relative weight for the variance of each criterion in bar chart task (coefficients a)
By referring to the model summary box (Table ) and checking the r value, it can be observed that this model can significantly account for 89% of the dependent variable.
Table 10. Variability analysis of table’s overall writing scores
The results presented in Table indicated that this model was satisfactory (sig. = .000).
Table 11. Analysis of Overall Regression Model in Table Task (ANOVAa)
To determine which of the independent variables in the model accounted for the prediction of the dependent variable, the beta value in the coefficient table was checked. According to the results, all four variables namely, TA (β = .27, Sig = .001), CC (β = .25; Sig = .001), LR (β = .22, Sig = .004), GRA (β = .25, Sig = .000) contributed to the prediction of the writing proficiency scores.
Regarding the second research question (What is the relative weight for the variance of task achievement that contributes to the total scores of Iranian IELTS candidates in writing task1 either in a bar chart or a table?), as it can be seen in Tables and 1, the results show that TA (β = 0.303) is the strongest predictor of the total score in the IELTS writing table; meaning that Iranian IELTS candidates’ strongest criteria in their IELTS writing performance was task achievement in table-based writing task 1. On the other hand, candidates’ TA (β = 0.197) in bar chart-based writing was weaker.
Table 12. Multi-linear regression analysis of relative weight for the variance of each criterion in table task (Coefficients a)
Concerning the third research question (What is the relative weight for the variance of coherence and cohesion that contributes to the total scores of Iranian IELTS candidates in writing task1 either in a bar chart or a table?), the results in Tables and 1 indicate that candidates performed better in CC (β = 0.292) when dealing with tables, but their performance in bar charts was poorer in terms of CC (β = 0.116).
With respect to the fourth research question (What is the relative weight for the variance of lexical resource that contributes to the total scores of Iranian IELTS candidates in writing task1 either in a bar chart or a table?), the findings in Tables and 1 demonstrate that candidates’ LR was better in bar charts (β = 0.271) than tables (β = 0.232). Thus, this criterion had more impact on their total scores in bar charts.
Finally, as it pertains to the fifth research question (What is the relative weight for the variance of grammar range and accuracy that contributes to the total scores of Iranian IELTS candidates in writing task1 either in a bar chart or a table?), the results in Tables and 1 indicate that GRA (β = 0.434) was the strongest predictor of the total score in bar charts; implying that GRA was the strongest point of Iranian IELTS candidates’ writing performance. On the other hand, candidates’ GRA (β = 0.279) turned out to be weaker in table-based writing.
5. Discussion
The results of the current study demonstrated that Iranian IELTS candidates were more skillful in accomplishing TA and GRA in tables and bar charts, respectively. In fact, these two criteria were deemed as decisive factors in determining test takers’ total score in the IELTS writing task 1. Unlike what was anticipated by the researchers in this study, Iranian IELTS candidates appeared to be more competent in covering the requirements of the task and presenting developed responses to the task in tables (i.e. TA). However, the candidates’ weaknesses found were CC and LR in relation to bar charts and tables, respectively. Evidently, Iranian IELTS candidates may not be able to create a report in which the ideas are connected coherently and cohesively in bar charts and they struggled to write a report which displays a rich development throughout (i.e. CC). In the bar charts, LR and TA are the criteria affecting the overall scores, respectively. Employing rich LR in bar charts is indicative of the importance of bar charts on candidates’ minds; they utilized more difficult lexical items in bar charts than tables. However, CC and GRA were the next criteria affecting the overall score in tables.
Concerning the results of the first research question, the candidates’ writing performance in two versions of tasks were significantly different; the candidates did better in bar charts than tables. When they viewed the bar charts, more complex lexical words were triggered in their mind but regarding tables, they had difficulty doing so. To be precise, visualization (bar charts) efficiently affected their writing performance and scores in the IELTS test. The results of the present study are in accord with Mickan and Slater’ study (Citation2003) in that task type had a noticeable effect on examinees’ performance. They showed that a specific type of task determined test takers’ choice of linguistic components for their compositions.
The findings of this study are also in line with those of Randle (Citation2010) in which he strongly advocated the application of visual arts in educational settings to foster creative writing and advance academic accomplishment. Moreover, the findings of the present study are in agreement with Trainin, Andrzejczak & Poldberg’ study (Citation2006). Based on the findings of their study, there was overwhelming support for the incorporation of visual arts into writing programs to nurture their imagination, self-expression skills, and problem-solving prowess.
Our findings agree with those of Carger (Citation2004) and Bussert-Webb (Citation2001) who reported that students benefited from visual arts integration in the classroom by inspiring imagination in their writings. They also found that the students were more fascinated in incorporating visual arts because they were able to manipulate the writing process more effectively. Furthermore, the findings of this study were also congruent with those of Olshansky (Citation2006) who concluded that visual arts integration in teaching writing skill made students feel interested and helped them find the writing class easier and more enjoyable. He also ascertained that visual arts helped students do the planning and thinking inherent in writing. Indeed, visual arts application as a guide in writing impacted students’ involvement as well as their achievement.
6. Conclusion, implications, and limitations
A significant finding of the current study is the way the test takers envision the writing task influences their writing performance. That is, if the writing task such as a table portraying numbers does not aid test takers to visualize the topic, they will not be able to produce a good writing report (Tajzadeh et al., Citation2013). Consequently, visualization affects their scores in the IELTS test. Based on the results obtained from this study, Iranian IELTS candidates performed better in bar charts than tables in the academic writing task1. This lies at the heart of the fact that bar charts are more comprehensible for their minds as the test takers can better visualize the topic. Where tables and numbers are given to the test takers, practically writing weakness may be a visual impairment, not, in fact, a writing weakness. Therefore, the low score in the test does not necessarily reflect the weakness of the candidates in the writing; the learner’s inability to visualize might account for their weakness. The findings of this study lend weight to the application of visual arts in educational settings as an efficient vehicle to expedite the development of learners’ imaginative writing skills (Lok, Citation2014). Building on this, writing instructors need to take on a wider palette of the visual arts for writing skill development.
The findings of the current study hold some significant pedagogical implications for teachers, researchers, learners, IELTS examiners/trainers, and syllabus designers. First of all, as part of instruction, teachers should inform test takers of writing assessment criteria. Using the band descriptors, they need to elaborate on what band scores encompass (Ostovar-Namaghi & Safaee, Citation2017). Teachers should also clarify what scoring criteria such as task achievement, coherence and cohesion, grammatical range and accuracy, and lexical resource are supposed to imply. Furthermore, they must provide IELTS test takers with writing samples of different band scores. As an effective technique, teachers can compare different samples of writing to encourage learners to analyze the sample answers to uncover the reasons for the scores obtained. Another implication of this study is pertinent to syllabus designers. IELTS books on the writing tasks should provide test takers with the necessary information concerning IELTS writing band descriptors. Such books should incorporate writing samples along with various band scores to help learners improve their writing scores. Also, samples should be analyzed in terms of the four writing assessment criteria (Ambe, Citation2008; Bagheri & Zare, Citation2009). This would foster test takers’ awareness of the writing process. The results of this study contribute to the IELTS stakeholders particularly, raters while at the same time providing useful information for test-takers preparing to sit an IELTS test. Moreover, the study may conduce to IELTS trainers to explore new directions to teach the IELTS academic writing task 1.
However, with respect to the limitations of the present study, the generalizability of its findings should be dealt with caution. Considering this, it is highly recommended that future studies collect additional data by replicating this study in other contexts especially in other countries to help researchers and curriculum directors decide on a down- to- earth approach or program that would be best applied for teaching the IELTS academic writing task 1. Programs for the development of IELTS courses catering to Iranian test takers might include instruction and practice on the interpretation of chart/table-based writing.
Correction
This article has been republished with minor changes. These changes do not impact the academic content of the article.
Additional information
Funding
Notes on contributors
Saeed Ahmadi
Saeed Ahmadi is a PhD candidate of TEFL at Shiraz Azad University, Iran. His main areas of interests are research and teaching language skills. He has more than 15 years’ experience in teaching English to Iranian students. Department of English language, Shiraz branch, Islamic Azad University, Shiraz, Iran.
E-mail: [email protected]
Mohammad Javad Riasati
Mohammad Javad Riasati holds a PhD degree in TESL and is currently a faculty member of Shiraz Azad University, Iran. He has published extensively in national and international journals. Department of English language, Shiraz branch, Islamic Azad University, Shiraz, Iran.
E-mail: [email protected]
Mohammad Bavali
Dr Mohammad Bavali is a faculty member of Shiraz Azad University, Iran, where he has taught courses in TEFL in postgraduate studies at the department of English language teaching and translation. His areas of interest include psycholinguistics, critical pedagogy, and issues in testing. Department of English language, Shiraz branch, Islamic Azad University, Shiraz, Iran. E-mail: [email protected]
Related Research Data
References
- Ahmadi, A., & Mansoordehghan, S. (2014). Task type and prompt effect on test performance: A focus on IELTS academic writing tasks. The Journal of Teaching Language Skills, 6(3), 1–19.
- Ahmadi-Fatalaki, J., & Nazari, M. (2015). The study of metadiscourse markers in academic IELTS preparation courses. Imperial Journal of Interdisciplinary Research, 1(5), 11–16.
- Al-Haq, F., & Al-Sobh, M. A. (2010). The effect of a web-based writing instructional EFL program on enhancing the performance of Jordanian secondary students. The Jalt Call Journal, 6(3), 189–218.
- Ambe, M. (2008). Exploring the role of model essays in the IELTS writing test: A feedback tool (Unpublished MA thesis). The University of Queensland, Brisbane, Queensland.
- Bagheri, M., & Zare, M. (2009). The role of using IELTS model essays in improving learners’ writing and their awareness of writing features. JELS, 1(1), 115–130.
- Bussert-Webb, K. (2001). I won’t tell you about myself, but I will draw my story. Language Arts, 78(6), 511–519.
- Carger, C. L. (2004). Art and literacy with bilingual children. Language Arts, 81, 283–292.
- Cohen, J. (1988). Statistical power analysis for the behavioral sciences (2nd ed.). Hillsdale, NJ: Lawrence Erlbaum Associates.
- Condon, W., & Kelly-Riley, D. (2004). Assessing and teaching what we value: The relationship between college-level writing and critical thinking abilities. Assessing Writing, (9), 56–75. doi:10.1016/j.asw
- Deane, P., Odendahl, N., Quilan, T., Fowles, M., Welsh, C., & Bivens-Tatum, J. (2008). Cognitive models of writing: Writing proficiency as a complex integrated skill. Princeton, NJ: Educational Testing Service.
- Decarrico, J. S. (2001). Vocabulary learning and teaching. In M. Celce-Murcia (Ed.), Teaching English as a second or foreign language (pp. 207–217). Boston, MA: Heinle and Heinle.
- Frodesen, J. (2001). Grammar in writing. In M. Celce-Murcia (Ed.), Teaching English as a second or foreign language (pp. 233–248). Boston, MA: Heinle and Heinle.
- Fu, D. (2009). Writing between languages: How English language learners make the transition to fluency grades 4-12. Portsmouth, NH: Heinemann.
- Ganji, M. (2009). Teacher-correction, peer-correction, and self-correction: Their impacts on Iranian students’ IELTS essay writing performance. The Journal of Asia TEFL, 6(1), 117–139.
- Ghonsooly-Hazare, B., Khaghaninezhad, M., & Shahriari-Ahmadi, H. (2010). Formulaic writing: A novel approach to writing. Pazhuhesh-e Zabanha-ye Khareji, 56, 127–148.
- Golder, K., Reeder, K., & Fleming, S. (2011). Determination of appropriate IELTS writing and speaking band scores for admission into two programs at a canadian post-secondary polytechnic institution. The Canadian Journal of Applied Linguistics, 14(1), 222–250.
- Heidarnezhadian, Q., Aliakbari, M., & Mashhadi, J. (2015). The potential impact of using prefabricated patterns (collocation expressions) on improving writing proficiency among Iranian intermediate EFL learners. International Research Journal of Applied and Basic Sciences, 9(3), 328–334.
- Jahin, J. H., & Idrees, M. W. (2012). EFL major student teachers’ writing proficiency and attitudes towards learning English. Umm Al-Qura university. Journal of Educational & Psychological Sciences, 4(1), 10–72.
- Ketabi, S., & Torabi, R. (2013). Teaching academic writing in Iranian EFL classrooms: Teacher-initiated comments or peer-provided feedback? Iranian Journal of Research in English Language Teaching, 1(2), 99–109.
- Lan, N. T. (2015). The effect of task type on accuracy and complexity in IELTS academic writing. VNU Journal of Foreign Studies, 31, 1.
- Li, Q. (2014). An empirical study on the application of lexical chunk to college English writing. Journal of Language Teaching and Research, 5(3), 682–688. doi:10.4304/jltr.5.3.682-688
- Lok, M. (2014, April 2). Integrating the Visual Arts into Writing: Effects on Student Learning and Engagement. Retrieved from http://tspace.library.utoronto.ca
- Lougheed, L. (2016). Writing for the IELTS. New York: Barron’s.
- Mickan, P., & Slater, S. (2003). Text analysis and the assessment of academic writing. Australia: IELTS.
- Norušis, M. J. (1988). SPSS/PC+ advanced statistics V2.0 for the IBM PC/XT/AT and PS/2. Chicago, Ill: SPSS Inc.
- Nueva, J. C. (2016). Genre-based and process-based approaches to teaching news articles. Pertanika Journals, 24(1), 385–400.
- O’Loughlin, K., & Wigglesworth, G. (2003). Task design in IELTS academic writing Task 1: The effect of quantity and manner of presentation of information on candidate writing (IELTS Research Reports, Vol. 4, Paper 3). Canberra: IDP IELTS Australia.
- Olshansky, B. (1994). Making writing a work of art: Image-making within the writing process. Language Arts, 7(5), 350–356.
- Olshansky, B. (2006). Artists/writers workshop: Focusing in on the ART of writing. Language Arts, 83(6), 530–533.
- Olshansky, B. (2008). The power of pictures: Creating pathways to literacy through art. San Fransico, CA: Jossey- Bass.
- Ong, J. (2011). Investigating the use of cohesive devices by Chinese EFL learners. The Asian EFL Journal Quarterly, 11(3), 42–65.
- Ostovar-Namaghi, S., & Safaee, S. (2017). Exploring techniques of developing writing skill in IELTS preparatory courses: A data-driven study. English Language Teaching, 10(3), 74–81. doi:10.5539/elt.v10n3p74
- Patriana, A., Rachmajanti, S., & Mukminatien, N. (2016). Students’ ability in using discourse markers to build coherence in compositions. TEFLIN Journal, 27(2), 203–216.
- Paulus, T. M. (1999). The effect of peer and teacher’s feedback on student’ writing. Journal of Second Language Writing, 8(3), 265–289. doi:10.1016/S1060-3743(99)80117-9
- Pell, C. (2017). IELTS Writing Task 1 Essential Information. Retrieved from https://www.ieltsadvantage.com/writing-task-1.
- Rajabi, P., & Dezhkam, E. (2014). The effect of explicit grammar instruction on improving writing accuracy of Iranian EFL learners. Journal of ELT and Applied Linguistics, 2(1), 61–76.
- Randle, K. (2010). Visual arts, effective means to enhance creative writing quality. Arts and Learning Research Journal, 22(1), 152–176.
- Richards, J., & Renandya, W. (2002). Methodology in language teaching: An anthology of current practice. Cambridge: Cambridge University Press.
- Rivers, W. M. (1981). Teaching foreign language skills (2nd ed.). Chicago: University of Chicago Press.
- Schoonen, R. (2005). Generalizability of writing scores: An application of structural equation modeling. Language Testing, 22(1), 1–30. doi:10.1191/0265532205lt295oa
- Serajfard, H., & Allami, H. (2012). Engagement markers: A technique for improving writing skills. Journal of Language, Culture, and Translation (LCT), 1(1), 71–83.
- Tahassoni, E. (2018). Master IELTS Visuals: Academic Writing Task 1. Retrieved from www.tahassoni.com.
- Tajzadeh, P., Jahandar, S., & Khodabandelou, M. (2013). The impact of visual presentation on Iranian intermediate EFL learner’s writing ability. Indian Journal of Fundamental and Applied Life Sciences, 3(3), 235–240.
- Trainin, G., Andrzejczak, N., & Poldberg, M. (2006). Visual arts and writing a mutually beneficial relationship. Arts and Learning Research, 2(1), 139–155.
- Umar, I., & Ratharkrishnam, M. (2012). The effects of online teachers’ social role and learning style on students’ essay writing performance and critical thinking in a wiki environment. Procedia Social and Behavioral Sciences, 46, 5730–5735. doi:10.1016/j.sbspro.2012,06,506
- Vahdani-Sanavi, R., & Nemati, M. (2014). The effect of six different corrective feedback strategies on Iranian English language learners’ IELTS writing TASK 2. Sage Open, 4(2), 1–9.
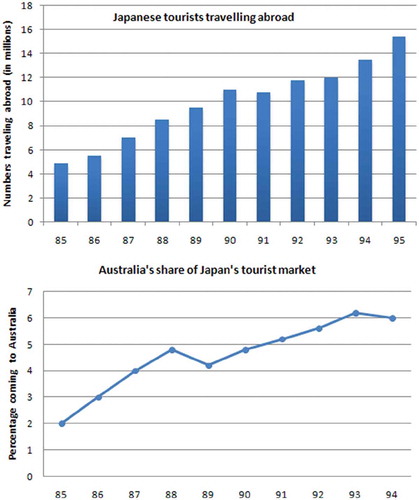
Appendix A1
IELTS Academic Writing Task 1(Bar Chart)
» You should spend about 20 minutes on this task.
The charts below show the number of Japanese tourists traveling abroad between 1985 and 1995 and Australia’s share of the Japanese tourist market.
Write a report for a university lecturer describing the information shown below.
» You should write at least 150 words.
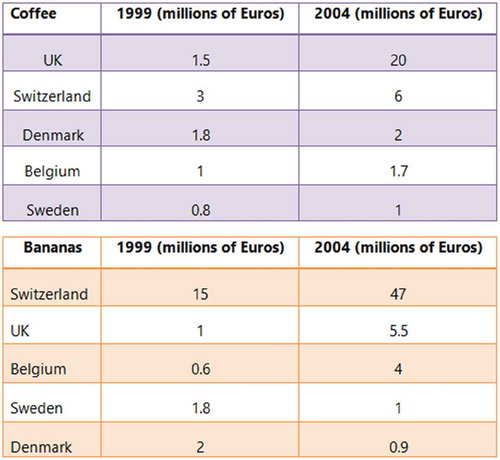
Appendix A2
IELTS Academic Writing Task 1 (Table)
» You are advised to spend about 20 minutes on this task.
The tables below give information about sales of Fair-trade*-labeled coffee and bananas in 1999 and 2004 in five European countries.
» You should write at least 150 words.
Appendix A3 (Band descriptor)