
Abstract
This study aimed to examine the construct validity of the Arabic version of the Chedoke-McMaster Attitudes towards Children with Handicaps (CATCH) scale in elementary school students. Data were collected from 672 elementary school students (357 boys and 315 girls). The included students ranged in age from 8 to 14 years. A statistical analysis was conducted using the following methods: confirmatory factor analysis, exploratory factor analysis, Rasch modeling, and internal consistency analysis. A good reliability coefficient was obtained for the scale. Confirmatory factor analysis indicated that the observed data failed to fit the hypothesized three-factor structure of the scale. However, the indices had a good fit after the negatively phrased items were excluded from the model. Confirmatory factor analysis did not support the construct validity of the 36-item Arabic version of the CATCH scale in elementary school students. The proposed 18-item Arabic version of the scale should be retested with different samples to confirm this study’s findings.
PUBLIC INTEREST STATEMENT
The Chedoke-Mcmaster Attitudes Towards Children with Handicaps Scale (CATCH) scale was originally developed in English language. This study aims to make sure that the translated version of the scale is suitable to be used. The information from this study will help to reach a valid Arabic version of the scale that can be used to measure children attitudes towards peers with disability in the Arab world.
1. Introduction
In education-related fields, advocating for the inclusion, when possible, of students with disabilities among their peers is the prevailing practice. One of the main goals of inclusion is to increase the opportunities for children with disabilities to participate with their peers in school activities. The success of the inclusion process is not smooth or guaranteed (Bossaert & Petry, Citation2013). One issue that may represent a challenge to the success of the inclusion process is students’ attitudes towards their peers with disabilities (McDougall et al., Citation2004).
Attitude is defined as “the affect for or against a psychological object” (Thurstone, Citation1931). Ensuring positive interactions between children with disabilities and their peers is important for instilling positive attitudes towards people with disabilities. Physical integration alone is not the goal of inclusion (Scior et al., Citation2013). Many studies have shown that attitudes towards people with disabilities can significantly predict behavior (Ajzen & Fishbein, Citation1980; Kraus, Citation1995).
Therefore, examining students’ attitudes is important, and a reliable scale is needed to assess children’s attitudes towards their peers with disabilities. An Arabic scale does not exist for this purpose; therefore, a scale in the Arabic language is needed to measure students’ attitudes towards their peers with disabilities.
Several scales were considered for adaptation in this study, including the Chedoke–McMaster Attitudes towards Children with Handicaps (CATCH) scale. The CATCH scale was recommended as one of the best scales for measuring children’s attitudes towards their peers with disabilities (Vignes et al., Citation2008). It is one of the few scales that measures three components of attitudes. The CATCH scale was developed by Rosenbaum et al. (Citation1986) and it was administered to 304 children from grades 5 to 8 in four schools in Canada. In addition, the measure has been used in many countries with different languages and has shown acceptable psychometric properties (Rosenbaum et al., Citation1988; Vignes et al., Citation2008).
Theoretically, the CATCH scale is based on the three-component attitudes model proposed by Triandis in 1971 (Rosenbaum et al., Citation1986). These three components are: (A) affective attitudes (“I would like a handicapped child to live next-door to me”); (B) behavioral intention (“I would try to stay away from a handicapped child”); and (C) cognitive attitudes (“Handicapped children can make new friends”). The CATCH scale is consisting of 36 items divided into 3 subscales (3x12 = 36 items). These three dimensions include (a) an affective component that is related to feelings, (b) a behavioral component that is related to behavioral intention, and (c) a cognitive component that is related to beliefs. This scale has been used in studies for children as from 9 to 16 years (Bossaert & Petry, Citation2013; Rosenbaum et al., Citation1986).
Validation studies for CATCH have been performed in many countries (for example, Canada, United Kingdom, and Netherland). However, none of these studies have been conducted using an Arabic sample with an Arabic version of the scale. Rosenbaum et al. (Citation1986) examined the properties of the scale with data collected from 304 students in elementary schools in Canada. The hypothesized model with three factors failed to fit the observed data. They concluded that by two subscales (factors), the affective and behavioral components being grouped into one subscale and the cognitive subscale, the model fit did improved.
A study conducted in the Netherlands reported different results (De Boer et al., Citation2012). They concluded that the items in the cognitive subscale did not fit within the scale and that the data fit a single-dimension scale with only 14 items. Six items were from affective subscale, 8 items were from the behavioral intent subscale, and no items were from the cognitive subscale. In England, a recent study used the Rasch model; data were collected from 416 students aged 7 to 16 to examine both the fit of the entire CATCH scale and the fit at the item level (Armstrong et al., Citation2016). The findings from that study did not support all three components of the scale. The authors found that the internal consistency of the cognitive component subscale was lower than that of the other two subscales. In addition, they were cautious regarding the cognitive subscale, as they found that children responded more negatively on this subscale. They suggested that the subscales would be more effective when used separately.
The present study aims to extend the available research on the factor structure of the CATCH by using a Saudi sample. The following research question will be addressed in this study: (1) Is the proposed three-factor structure of the CATCH preserved in the Arabic version of the scale?
2. Materials and methods
To test the data, a confirmatory factor analysis (CFA) was performed using Amos 20, and an exploratory factor analysis (EFA) was conducted using SPSS 21.0 (Statistical Package for Social Sciences, Chicago, IL, USA). EFA used “to examine the underlying dimensionality of the item set. Thus, they can group a large item set into meaningful subsets that measure different factors. The primary reason for using EFA is that it allows items to be related to any of the factors underlying examinee responses. As a result, [this study] can easily identify items that do not measure an intended factor” (Worthington & Whittaker, Citation2006. p. 807). “A fundamental feature of CFA is its hypothesis-driven nature” (Brown, Citation2015, p. 1). “EFA is a data-driven approach” (Brown, Citation2015, p. 14), therefore, it is useful to start from data when items do not measure the indented factor (Worthington & Whittaker, Citation2006). In addition to using the classic test theory approach to test the model fit, R software (eRm Package) was used to examine the fit of items from the item response theory perspective (Rasch modeling), and item fit statistics were checked and items with significant chi-square were considered to be potentially misfit items.
2.1. Participants
The study sample consisted of 672 students from nine elementary schools in Riyadh, Saudi Arabia (357 boys and 315 girls). The included students ranged in age from 8 to 14 years. The school system in Saudi Arabia is separated by gender. Therefore, the boys and girls in this study attend different schools. The study instrument was distributed to students in class during the school day, and an explanation of the instrument and necessary clarifications were provided to the students by the mediator and the teacher. A convenience sampling was implemented in this study, and the schools that were included were those where the mediators (teachers) worked and those nearby; however, the included schools were in different areas in the city of Riyadh. In addition, the sample size in this study fulfilled the recommendation of having 7 times number of items to examine the Structural validity, which means 36 *7 = 252 (see the recently developed COSMIN study design checklist for patient reported outcome measurement instruments; Mokkink et al., Citation2019). Institutional review approval (IRB) to conduct this study was obtained from the Deanship of Scientific Research at the university. Parents’ written consent were obtained through school administration before we conduct this study.
2.2. Instruments
The CATCH is a 36-item measurement scale with three components. Twelve items each are included in the affective component (A), the behavioral component (B), and the cognitive component (C). The back-translation technique (Brislin, Citation1970) was used to ensure the accuracy of the translation of the scale into Arabic. First, the English version was translated into Arabic. Second, the Arabic version was given to a bilingual faculty member, who translated it back into English. Third, the new English version was compared to the original instrument to ensure that each item retained the same meaning. Scores were given from 4, strongly agree; 3, agree; 2, disagree; and 1, strongly disagree. The scores were reversed for all 18 negatively phrased items to 1, strongly agree; 2, agree; 3, disagree; and 4, strongly disagree (see Appendix for the full scale). High total scores on the scale imply high positive attitudes towards peers with disabilities.
2.3. Analysis procedures
This study included four different types of analysis and eight total steps. First, the internal consistency (Cronbach’s alpha) was calculated for the three factors and for the scale as a whole. It was also calculated for the last two models after separating the negatively phrased items from the positively phrased items, as the EFA results suggested. Second, a CFA was conducted to examine the fit indices of the original three-factor model. Third, a CFA was conducted to examine the two-factor model created when the first and the second components were merged together into one component (A/B, C), which was deemed appropriate based on the results of Rosenbaum et al’s factor analysis (Rosenbaum et al., Citation1986). Therefore, the third model has only two factors, the first factor (24 items) consist 12 item from the affective subscale and 12 items from the behavioral intent subscale. The second factor is the cognitive subscale with 12 items. Fourth, a CFA was conducted to examine the one-factor model, which was one of the solutions discussed by Bossaert and Petry (Citation2013) after they conducted a factor structure analysis of the scale.
Fifth, in addition to the classic test theory, Rasch model statistics were computed to find the misfitting items. Sixth, a CFA was conducted to examine the fit indices after removing 6 items that did not fit according to the Rasch analysis. Seventh, an EFA was conducted to examine the item loadings and determine why the items did not load as expected in CFA based on the original structure of the scale. The results indicated that the negatively phrased items loaded differently. Eighth, a CFA was conducted to examine the three-factor model with the 18 positively phrased items, and another CFA was conducted to examine the three-factor model with the 18 negatively phrased items.
3. Results
3.1. Internal consistency
Table shows that the internal consistency (Cronbach’s alpha) was 0.636 for the affective factor item scores, 0.651 for the behavioral factor items, and the lowest for the cognitive factor items, 0.542. The total scale had an internal consistency of 0.843 (see Table ), which indicates a good level of internal consistency (George & Mallery, Citation2003). In addition, better internal consistency was found for the scale with only positively phrased items (.861) compared with the scale with only negatively phrased items (.772).
Table 1. Internal consistency statistics
3.2. EFA loadings/parallel analysis
“Very often, those who conduct EFA follow up the analysis with CFA” (Brown, Citation2015, p. ix). One dimension (with 4 components) was suggested based on the results of Horn’s parallel analysis for component retention, which adjusts for finite sample bias in the retention of components and retains factors with eigenvalues larger than the 95th percentile estimated from the random data. Horn’s parallel analysis was recommended for determining the number of components to retain, for which it uses a Monte-Carlo simulation method (Verdugo et al., Citation2014).
As with the English version, the scree plot recommended the three-component solution. Three factors explained 31% of the variance. With reference to the factor structure, twenty of the 36 items had loadings >.30 for the individual factors. It was found that the items loaded on factor 2 (14, 18, 20, 22, 28, 30, 34, and 36) and factor 3 (10, 12, 16, 24, and 26) were all negatively phrased regardless of the proposed factor. Six items had loadings <.30 on all three factors (2, 3, 5, 7, 11, and 17). It was noted that that participants perceived the negatively phrased items differently. Therefore, the author conducted another CFA to test whether the model fit improved after the negatively phrased items were excluded (Model 5). In addition, a CFA was conducted for the 18 negatively phrased items (Model 6).
3.3. Rasch analysis
In addition to using the classic test theory approach to test the model fit, this study examined the fit of the items from the modern test theory perspective (Rasch modeling). The computation of the Rasch model statistics revealed 6 misfitting items. The p values were <.05 for these items, which means that these items are statistically unfit indices (see Table ): item 2 (I wouldn’t introduce a handicapped child to my friend), item 3 (Handicapped children can do lots of things for themselves), item 10 (I would be afraid of a handicapped child), item 11 (I would talk to a handicapped child I didn’t know), item 12 (Handicapped children don’t like to make friends), and item 35 (I would miss recess to keep a handicapped child company). These items were excluded from Model 4 during the CFA. Five of these items (2, 3, 10, 11, and 12) loaded on different proposed factors during the EFA. In this analysis, only items fit statistics were considered the 36 items and used to find misfit items with significant chi-square were considered to be potentially misfit.
Table 2. Item fit statistics in the rasch modeling
3.4. Confirmatory factor analysis
The construct validity of the three-factor structure of the scale was examined via CFA. The three-component model with 36 items was examined by CFA and failed to fit the data. Therefore, further rounds of CFA analysis were conducted to compare the different models (see Table ).
Table 3. Confirmatory factor analysis statistics
CFA was utilized to examine the construct validity of the scale. In this analysis, the root-mean-square error of approximation (RMSEA) was reported, as recommended by Hu and Bentler (Citation1998). Other indices were also reported, including the comparative fit index (CFI) and the Chi-square to degree of freedom ratio as recommended by Schermelleh-Engel et al. (Citation2003). The originally proposed model with three factors had a poor fit with the data in most of the indices, as indicated by the goodness-of-fit indices: SBS-χ2 = (591, N = 672) = 2644.397 and p < .001; RMSEA = 0. 070; CFI = 0.502; and chi-square/degrees of freedom ratio = 4.47 (see Figure ).
Figure 1. Standardized estimates for the CATCH model. (a) Affective domain; (b) Behavioral domain; (c) Cognitive domain
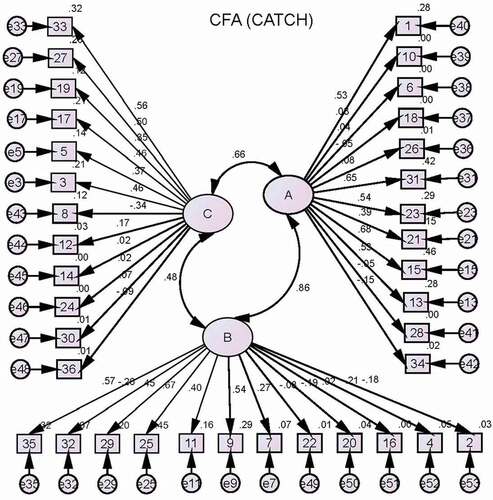
The model fit did not improve in the next three models: Model 2 with only two factors, based on Rosenbaum et al. (Citation1986) findings; Model 3 with one factor based on de Boer et al. (Citation2012) findings; and Model 4 with three factors excluding 6 items based on the Rasch analysis. The CFI ranged from .493 to .736 for these three models, which indicates no improvement in fit in these three models.
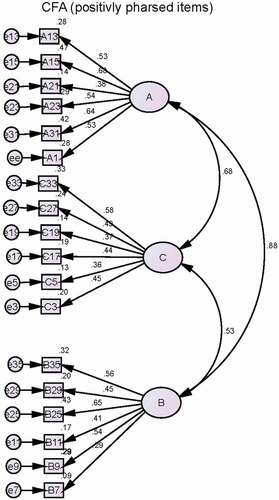
Next, the items were separated by the type of phrasing (positive or negative), and CFA was conducted separately for both based on the EFA findings, in which negatively phrased items loaded differently than expected. Model 5, which excluded the negative items from the model, had a good fit with the data, as shown by the fit indices: SBS-χ2 = (132, N = 672) = 320.828 and p < .001; RMSEA = 0. 045; CFI = 0.911; SRMR = 0.0493; and chi-square/degrees of freedom ratio = 2.43. Notably, there were improvements in all indices compared with the values from the first model. Model 6, which included only the negative items, had a poor fit with the data, as shown by the fit indices: SBS-χ2 = (132, N = 672) = 395.163 and p < .001; RMSEA = 0; 053; CFI = 0.832; and chi-square/degrees of freedom ratio = 2.99. The values for all indices dropped compared to those in the fifth model but were better than the value for the first one with 36 items.
With respect to the fit indices, Model 5 was the best model with acceptable fit indices, such as chi-square/degrees of freedom ratio < 3 (Schermelleh-Engel et al., Citation2003), CFI > .9, and RMSEA < .06 (Hu & Bentler, Citation1998; Schermelleh-Engel et al., Citation2003). To conclude, Model 5 with 18 positively phrased items (see Figure ) was the best model that adequately explained the observed data with the hypothesized three-factor model.
Figure 2. Standardized estimates for the CATCH model with 18 items (Model 5). (a) Affective domain; (b) Behavioral domain; (c) Cognitive domain
4. Discussion
The main goal of the current study was to investigate the construct validity of the Arabic version of the Chedoke–McMaster Attitudes towards Children with Handicaps (CATCH; Rosenbaum et al., Citation1986) scale by examining its psychometric properties using a sample of Saudi students from nine elementary schools in Riyadh. The findings indicate the potential utility of the Arabic version when only the positively phrased items are included, since the proposed structure of the original version is preserved.
This study used the modern test theory approach to examine the fit of the scale as a whole and at the item level; items 2, 3, and 11 did not have good fit according to the Rasch analysis and did not load (>.30) on any of the three factors, according to the EFA. Furthermore, items 10, 12, and 35 were reported as misfit items according to the Rasch modeling analysis.
Many of the negatively phrased items (such as items 24, 26, 28, and 30) were perceived differently by students, which may have caused the weak loading for these items or caused them to load on different components. Therefore, in the future, the negatively phrased items should be phrased differently, for example, an item like “I wouldn’t like a handicapped friend as much as my other friends” can be changed to be “I would like a handicapped friend as much as my other friends” . It is easier for participants to respond to positively worded items. If all items were phrased positively, the participants would not have to switch between positively phrased items and negatively phrased items, which would prevent situations in which the positive and negative items are perceived differently by students (Roszkowski & Soven, Citation2010).
The participants in this study responded in way that fit the main structure of the 18-item scale. The scale with these 18 items showed much better fit indices with our students. Therefore, it is recommended that the model’s psychometric properties be examined with these 18 items and confirmed by different samples from different regions in Saudi Arabia or another Arabic country. The original scale has an adequate number of items (36), which allows the sample responses to be verified. Negatively phrased items may be necessary, to control for acquiescence bias (see Furr, Citation2017 for more details), if there are only a few items in the scale and there is a need to ensure that participants have read and understood the items.
5. Conclusions
This study is the first to examine the validity of the Arabic version of the CATCH scale in a sample of children and youths in Saudi Arabia. The findings supported the construct validity of the 36-item Arabic CATCH scale among elementary school students. However, evidence of the construct validity and adequate internal consistency of the 3-factor structure was obtained after removing negatively phrased items. This study is one step in the validation of the Arabic version CATCH scale, which is a useful tool for inclusive education. Therefore, the findings indicate the potential utility of the 18-item Arabic version of the scale.
In sum, this study found that the Arabic version of the CATCH scale with 18 items (out of 36 items) has acceptable psychometric properties for assessing children’s attitudes towards other children and youths with disabilities in Saudi Arabia and other Arab countries. However, further studies based on this proposed change to the scale with a larger sample are warranted to validate this study’s findings.
6. Implications
Some implications can be drawn from this study. First, the CATCH scale is a reliable instrument that could be useful to examine attitudes toward children and youth with disabilities in the Arabic region. However, the continued testing of this measure and its psychometric properties with different samples in Saudi Arabia and the Arabic region is important at the current stage. Second, this study was the first to examine the psychometric properties of the CATCH with a sample from Saudi Arabia; therefore, replications of this study with similar and different populations would be informative. Third, the scale with 18 items might have the potential to be a valid measure to examine the attitudes of children and youth towards peers with disabilities. However, further confirmation with different samples is essential. Fourth, future research would be recommended to use the Rasch analysis to examine whether the suggested 18 items scale is a unidimensional measure. As in this study the main focus was from the classical test theory approach, and misfit items analysis used to help to find the best fitting items for the CFA.
7. Limitations
There are a couple of limitations as regard this study findings. First, a convenience sampling was implemented in this study, and the schools that were included were those where the mediators (teachers) worked and those nearby; however, the included schools were in different areas in the city of Riyadh. Second, the participants were from Saudi Arabia only, a sample from other Arabic countries will help to be more confident with the generalizability of this study finding.
Additional information
Funding
Notes on contributors
Ghaleb Hamad Alnahdi
Ghaleb H Alnahdi is an associate professor in special education at Prince Sattam University. He earned his Ph.D. in Special Education from Ohio University. He also holds a master’s degree in research and evaluation from Ohio University (2012) and another, in special education, from King Saud University (2007). His research focuses on intellectual disability, inclusive education, cross-cultural validation of scales, and teacher preparation. He is involved in several research projects with different research groups at the national and international levels.
References
- Ajzen, I., & Fishbein, M. (1980). Understanding attitudes and predicting social behaviour. Prentice hall.
- Arbuckle, J. (2010). IBM SPSS amos 19 user’s guide. Amos Development Corporation.
- Armstrong, M., Morris, C., Tarrant, M., Abraham, C., & Horton, M. C. (2016). Rasch analysis of the Chedoke–McMaster attitudes towards children with handicaps scale. Disability and Rehabilitation, 39(3), 281–12. https://doi.org/10.3109/09638288.2016.1140833
- Bossaert, G., & Petry, K. (2013). Factorial validity of the Chedoke-McMaster attitudes towards children with handicaps scale (CATCH). Research in Developmental Disabilities, 34(4), 1336–1345. https://doi.org/10.1016/j.ridd.2013.01.007
- Brislin, R. W. (1970). Back-translation for cross-cultural research. Journal of Cross-Cultural Psychology, 1(3), 185–216. https://doi.org/10.1177/135910457000100301
- Brown, T. A. (2015). Confirmatory factor analysis for applied research. Guilford publications.
- De Boer, A., Timmerman, M., Pijl, S. J., & Minnaert, A. (2012). The psychometric evaluation of a questionnaire to measure attitudes towards inclusive education. European Journal of Psychology of Education, 27(4), 573–589. https://doi.org/10.1007/s10212-011-0096-z
- Furr, R. M. (2017). Psychometrics: An introduction. Sage Publications.
- George, D., & Mallery, P. (2003). SPSS for windows step by step: A simple guide and reference, 11.0 update (4th ed.). Boston.
- Hu, L.-T., & Bentler, P. M. (1998). Fit indices in covariance structure modeling: Sensitivity to underparameterized model misspecification. Psychological Methods, 3(4), 424–453. https://doi.org/10.1037//1082-989x.3.4.424
- Kraus, S. J. (1995). Attitudes and the prediction of behavior: A meta-analysis of the empirical literature. Personality and Social Psychology Bulletin, 21(1), 58–75. https://doi.org/10.1177/0146167295211007
- McDougall, J., DeWit, D. J., King, G., Miller, L. T., & Killip, S. (2004). High school‐aged youths’ attitudes toward their peers with disabilities: The role of school and student interpersonal factors. International Journal of Disability, Development and Education, 51(3), 287–313. https://doi.org/10.1080/1034912042000259242
- Mokkink, L. B., Prinsen, C. A., Patrick, D. L., Alonso, J., Bouter, L. M., De Vet, H. C., & Terwee, C. B. (2019). COSMIN study design checklist for Patient-reported outcome measurement instruments.
- Rosenbaum, P. L., Armstrong, R. W., & King, S. M. (1986). Children’s attitudes toward disabled peers: A self-report measure. Journal of Pediatric Psychology, 11(4), 517–530. https://doi.org/10.1093/jpepsy/11.4.517
- Rosenbaum, P. L., Armstrong, R. W., & King, S. M. (1988). Determinants of children’s attitudes toward disability: A review of evidence. Children’s Health Care, 17(1), 32–39. https://doi.org/10.1207/s15326888chc1701_5
- Roszkowski, M. J., & Soven, M. (2010). Shifting gears: Consequences of including two negatively worded items in the middle of a positively worded questionnaire. Assessment & Evaluation in Higher Education, 35(1), 113–130. https://doi.org/10.1080/02602930802618344
- Schermelleh-Engel, K., Moosbrugger, H., & Müller, H. (2003). Evaluating the fit of structural equation models: Tests of significance and descriptive goodness-of-fit measures. Methods of Psychological Research, 8(2), 23–74.
- Scior, K., Addai-Davis, J., Kenyon, M., & Sheridan, J. C. (2013). Stigma, public awareness about intellectual disability and attitudes to inclusion among different ethnic groups. Journal of Intellectual Disability Research, 57(11), 1014–1026. https://doi.org/10.1111/j.1365-2788.2012.01597.x
- Thurstone, L. L. (1931). The measurement of social attitudes. The Journal of Abnormal and Social Psychology, 26(3), 249–269. https://doi.org/10.1037/h0070363
- Verdugo, M. A., Gómez, L. E., Arias, B., Navas, P., & Schalock, R. L. (2014). Measuring quality of life in people with intellectual and multiple disabilities: Validation of the San Martín scale. Research in Developmental Disabilities, 35(1), 75–86. https://doi.org/10.1016/j.ridd.2013.10.025
- Vignes, C., Coley, N., Grandjean, H., Godeau, E., & Arnaud, C. (2008). Measuring children’s attitudes towards peers with disabilities: A review of instruments. Developmental Medicine & Child Neurology, 50(3), 182–189. https://doi.org/10.1111/j.1469-8749.2008.02032.x
- Worthington, R. L., & Whittaker, T. A. (2006). Scale development research: A content analysis and recommendations for best practices. The Counseling Psychologist, 34(6), 806–838. https://doi.org/10.1177/0011000006288127