
 ?Mathematical formulae have been encoded as MathML and are displayed in this HTML version using MathJax in order to improve their display. Uncheck the box to turn MathJax off. This feature requires Javascript. Click on a formula to zoom.
Abstract
The purpose of the paper was to identify quality dimensions through which the service quality performance concerning TQM implementation in a Higher Education context could be measured from external customers’ perspectives. The paper opted for a research survey with an instrument developed on a 5-point Likert-scale of five quality dimensions identified with 26 items. A total of 434 questionnaires were administered and 364 questionnaires were returned, of which 361 were usable given a response rate of 83.9%. Students and Alumni respondents expected more on the human and non-human elements of service delivery, while employers’ expectations were mostly on Core Services. However, all the respondents’ levels of satisfaction were found to be generally below their expectations. The dimensions that influenced the customers’ views and the existing service gaps were determined. The study was limited to three selected subgroups of the Institution’s customers. The findings may inform management to improve service performance.
PUBLIC INTEREST STATEMENT
Many organisations are making good efforts to achieve quality products and services that will meet or exceed their customers’ expectations. Higher Education Institutions among the service institutions have also been compelled to demonstrate that their services are customer-focused through continuous improvement. The external customers are the final consumers of the education services and they form expectations before their encounter with the institutions. They develop perceptions during the process of service delivery and compare their perceptions to their expectations in evaluating the quality of the services delivered. To measure service performance, and to improve on service quality, is to have quality dimensions that apply to the education context. The quality dimensions identified include Core service; the human element of service delivery; tangibles of service; systemization of service delivery and social responsibility. The feedback and existing service gaps portrayed by the external customers will inform management decision-making on continuous improvement of service.
1. Introductions
Total Quality Management (TQM) principles and practices have been embraced by many quality managers and practitioners from different sectors and have earned the attention of many researchers from diverse areas (Kumar et al., Citation2009; Yang, Citation2006). TQM has become a generally accepted management technique for organisations to improve upon the quality of products and services to increase customer satisfaction to stay in business competitiveness (Tuan & Rajagopal, Citation2018; Yousuf & Wahab, Citation2017). The manufacturing industries mostly started the implementation in the 1980s, while the service institutions devoted considerable attention to the implementation of TQM in the early 1990s (Eriksson & Hansson, Citation2003; Gómez et al., Citation2017). Many organisations are now making good efforts to achieve quality products and services that will meet or exceed customers’ expectations.
A growing number of Higher Education Institutions (HEIs) have embraced the TQM philosophy for the same reasons that led manufacturing and other service industries to embrace it. HEIs in general, adopted the TQM approach to be more responsive to the changing needs of those who engage their graduates and also to be more students (primary customer) orientated. Management of HEIs has also been compelled to demonstrate that their services are customer-focused through continuous improvement. The outcome of previous empirical studies has ascertained the existence of a strong and positive relationship between TQM implementation and organisational performance (Andrade et al., Citation2017; Kaynak, Citation2003; Mohammed et al., Citation2016). Many studies have also reported on the high success and failure rate in the implementation of TQM (Hasham, Citation2018). The findings of some studies have shown that the TQM implementation in institutions failed to achieve any result, while other studies find mixed results of TQM practices (Nair, Citation2006; Prajogo & Sohal, Citation2006).
Institutions that implement TQM are consistent with the quality experts’ principles in developing means for assessing their customers’ wants and obtaining data about the numerous customers they have. TQM institutions used their customers’ expectations and perceptions mean to obtain customer data (Bhat, Citation2017; Chua, Citation2004). External customers are the final consumers of the education services since the universities have established or made deals with them. These customers, on one hand, form expectations before their encounter with the Institutions, the service providers. On the other hand, customers develop perceptions during the process of service delivery. The customers’ perceptions are then compared to their expectations in evaluating the quality of the services they encountered (Bhat, Citation2017; Zeithaml et al., Citation2002).
A total evaluation of TQM implementation in any institution includes three distinct but interrelated types of assessment (Hajjem, Citation2016). They include the TQM implementation itself, assessment of process criteria, and the outcome criteria. Many researchers have conducted many investigations to solicit information concerning the successes and failures of TQM practices. The differences and similarities in the various outcomes were attributed to the respondent groups selected and participated in the investigations conducted. It appears the previous researchers failed to have the three assessments concurrently or sequentially to speak of the total evaluation of TQM institutions. After the total evaluation of the TQM institution has been conducted, this paper of the study reports on the assessment of the outcome criteria, the degree to which improvements in the institutional effectiveness are found to have an impact on the diverse institution’s external customers.
The question is, are the external customers’ expectations and perceptions on quality dimensions homogeneous? Are the external customer subgroups place the same importance on the quality dimensions? Which of the quality dimensions are mostly influence their expectations and perceptions? Is there any existence of service gaps from the external customers’ viewpoint? It appears that the TQM institutions have lacked measurement instruments to investigate the quality of services rendering from the external customers’ perspective. This is remiss since education institutions more especially in developing countries are facing the demand for high accountability from their external customers who constitute the final consumers of their services. The feedback from external customers has to be addressed so that shortcomings (if any) could be identified and continuously improve upon them to meet or exceed their customers’ satisfaction.
The purpose of the paper was to identify quality dimensions through which the service quality performance concerning TQM implementation in a Higher Education context could be measured from external customers’ perspectives. To achieve the research purpose, the study was guided by the following research objectives: To
identify quality dimensions and develop a reliable instrument for measuring the service performances of a TQM institution.
explore the significance of the quality dimensions to the customers’ expectations and perceptions
determine the existence of service gaps (if any) and the magnitude of the gap effects on service quality performance.
The following statistical hypotheses were tested:
Ho1: There are no statistically significant differences in the views of the external customer subgroups on the five service quality dimensions
Ho2: There are no statistically significant differences in the expectations and perceptions of external customers on the five service quality dimensions
2. Literature review
2.1. Total quality management philosophy
Total Quality Management (TQM) is a quality approach, which is referred to as the process of integrating all activities, functions, and processes within an organisation to achieve continuous improvement in the delivery of goods and services for customer satisfaction (Sallis, Citation2014). TQM is also defined as the application of quality principles, tools, and techniques to the overall process and all the management functions to ensure total customer satisfaction (Irani et al., Citation2004). Feigenbaum (Citation1983), who is credited with being the originator of the term TQM, defines TQM as a management model that has an institution-wide quality system to meet or exceed customer satisfaction (Sahney, Citation2016). Parumasur and Govender (Citation2013) iterated that, TQM is a set of management practices aimed at introducing an awareness of quality principles throughout the organisation and ensuring that the customer requirements are consistently met or exceeded.
Nevertheless, Rosa et al. (Citation2012) argued that it is difficult to find a single definition for TQM, however, it is better to put forward the principles that underline TQM operations. Although there are countless definitions of TQM, what matters is for top management applying the fundamental concepts of TQM that are appropriate for particular institutional conditions. The history of quality came out with the four levels of evolution of quality approaches and a large body of literature has been developed concerning these approaches to ensure service quality in organisations as illustrated by Dale et al. (Citation2016) and shown in . TQM is the final level of the institution-wide continuous quality improvement and it aims at working towards the satisfaction of customers.
Figure 1. The hierarchy of quality approach (source: Dale et al., Citation2016)
2.2. Studies on TQM implementation in organisations
Many researchers have examined how TQM principles and core concepts can be measured to provide a means of assessing the quality of products and services from organisations on various aspects of their internal processes. It is worth noting that, how management implements these TQM principles affect the organisation’s service delivery and there is a correlation between the measurements of organisational service performance and TQM implementation (Gallear et al., Citation2012; Talib et al., Citation2013). These previous studies have produced mixed results and the failure to obtain consistent results could be attributed to the significant differences among studies in terms of research design issues. In some studies, such as the one conducted by Douglas and Judge (Citation2001), TQM is operationalised as a single construct to analyse the relationship between TQM and firms’ performance, while others, like Samson and Terziovski (Citation1999), for instance, operationalise TQM as a multidimensional construct. Again, the levels of performance measured vary among the studies. Some studies operationalise performance only at operating levels as Samson and Terziovski did, while others like Douglas and Judge measured only financial performance. Das et al. (Citation2000) measure performance at multiple levels. Another issue of inconsistency in results was the analytical framework used to investigate the relation between TQM and performance as differs among the studies. In other words, when the data analyses are based on a series of multiple regressions (Samson & Terziovski, Citation1999), correlations (Sadikoglu & Zehir, Citation2010) or ranking indexes (Khanna, Citation2009; Sadikoglu & Olcay, Citation2014), the studies are likely to have different results.
2.3. Studies on TQM Implementation in Higher Education Institutions (HEIs)
Managing quality in education could begin at any of the institutional units, as well as the institution in general, similar to that of manufacturing and other service industries (Koch & Fisher, Citation1998). Total Quality Management (TQM) is one of the most known Quality Management models that have been implemented in HEIs. Since the education sector is considered as a service industry like Healthcare, Banking, and Automobile services, operating a total quality management system in the sector is necessary and applicable as well (Al-Tarawneh & Mubaslat, Citation2011). TQM philosophy focuses on the continuous improvement of the education services delivered to their institutional customers.
Many education institutions that began the Total Quality Management (TQM) implementation in the early 1990s have had success and failure stories to tell (Tsinidou et al., Citation2010). For example, TQM philosophy has been applied to Faculties/Schools and Colleges in the United Kingdom, the United State of America (USA), and other European countries (Kanji et al., Citation1999). The researchers found many informative reports on successful TQM applications in USA Higher Education Institutions (HEIs). In the European countries, quality has always been the centre of the action, being regarded as one of the success factors of the Bologna process (Berlin Communiqué, Citation2003; Reinalda & Kulesza, Citation2006). Nevertheless, these institutions in Europe have benefited from the TQM process similar to their counterparts in the USA, such as improved student performance, better services, reduced costs, and customer satisfaction.
In the case of Africa, TQM has not been practised rigorously, except for some isolated cases. Few attempts of TQM implementation have been seen in some Higher Education Institutions, while the rest are still contemplating on its implementation (Ahmed & Ali, Citation2016; Ogachi, Citation2009; Strydom & Strydom, Citation2004). It is over 20 years (1999) now, as the Association of African Universities (AAU) has been much concerned about universities to establishing Internal Quality Assurance (IQA). The IQA goes beyond the Quality Control (QC) aspect of managing quality and it is to put confidence into the management and customers of the services being provided by the institution that quality service will be met as required. Cheruiyot and Maru (2013), for instance, conducted a study on Service quality and relative performance of three public universities in three countries including; Kenya, Uganda, and Tanzania. It was an exploratory survey of three public universities in East African countries namely Moi, Makerere, and Dar es Salaam, with students as the only participants. The study provided insights on the relative importance of service quality dimensions and their effects on relative performance.
Anwowie et al. (Citation2015) investigated students’ satisfaction with service quality at the Takoradi Technical University in Ghana. The study was conducted using the SERVQUAL instrument for measuring expectations and perceptions according to the five quality dimensions. One hundred and eighty-eight students were sampled using the SERVQUAL questionnaire. The study shows that students’ perceptions of service quality exceeded their expectations on four service quality dimensions namely tangibility, responsiveness, assurance, and empathy, while their expectations for reliability exceeded their perceptions.
Mattah et al. (Citation2018) conducted student graduates’ satisfaction with service quality at the University of Cape Coast, in Ghana. Quality dimensions use include quality of academic services and facilities, quality of lecturers, and quality of academic programs. With a sample size of 500 Graduands, they were satisfied with academic services, lecturers, and programmes. They were, however, not satisfied with the quality of facilities. The majority of the respondents indicated to be loyal to the university as a result of their satisfaction with the services, lecturers as well as programmes.
Abubakar et al. (Citation2018), in their study, assessed total quality management practices in three selected Ghanaian public Universities. The driving force for this investigation includes issues like the lack of TQM framework and inefficient influences of external quality assurance bodies within the Ghana Higher Education Institutions in monitoring the teaching and learning enterprise. The mixed method approach was adopted for their study and analyses were performed on three universities involved, namely: the University of Cape Coast, the University of Ghana, and the University of Mines with 36 respondents. The findings from the study indicated the average level at which the critical success factors (TQM principles) are adopted to achieve effective quality management in the institutions (51%). Nonetheless, their study did not verify the situation from the Institutional stakeholders apart from management to ascertain the total evaluation of the TQM implementation. Again, the TQM operation involves the quality control and quality assurance system in addition to quality improvement. In the case of TQM philosophy, it is questionable to say that the three universities with their core mandate to provide services to satisfy their external and internal customers lack the TQM philosophy, which includes customer satisfaction.
Despite the numerous supports for the TQM implementation in both manufacturing and service organisations, the implementation has had a remarkably small impact on the Higher Education Institutions (HEIs). According to Koch (Citation2003), some of the educational institutions that began TQM implementation in the 1990s also encountered failures. The failure institutions argued that TQM has failed to address the most important issues and because of the nature of academic culture and the difficulty of defining the precise nature of HEIs, it is likely to happen. However, the most difficult thing about applying the TQM approach is the implementation process (Ahmed & Ali, Citation2016). In order to have continual improvement in quality education, the output must be defined as iterated by Motwani and Kumar (Citation1997). This can sometimes be a hard task to accomplish in certain areas of education. Most universities do not know where to begin, what level to start at, how long it will take, and who will be involved in the process, while some of the universities who have implemented TQM did it in several ways.
Pratasavitskaya and Stensaker (Citation2010), mentioned resistance to change; insufficient administration commitment; high time investment due to personal training; difficulty in the implementation of TQM in HEIs environment; lack of quality awareness and commitment; little experience of teamwork constitutes some factors contributing to the TQM implementation failures in Higher Education Institutions. Rosa et al. (Citation2012), added the absence of effective communication channels; the difficulty in measuring HEIs results; the co-existence of several purposes and objectives for HEIs; an emphasis in the individualism and significant degree of internal competition; the bureaucracy decision-making circuits; and the absence of strong leadership, highly committed to the ideas and principles it wants to implement and capable of involving all the institution’s members.
2.4. Education service
A Service has been defined in many ways but with no general agreement as to what constitutes it. Services are those separately identified, and essentially intangible, activities that provide satisfaction to the recipient and are not necessarily tied to the sale of a product (Al-Marri et al., Citation2007; Mateos-Ronco & Hernández Mezquida, Citation2018; Stanton et al., Citation2002; H. Wang et al., Citation2016; Zografaki et al., Citation2017). Education is a service to the customer and an ongoing process of transforming the participants involved (Abdullah, Citation2006). It is a transforming process through which the customers’ expectation is a change through the learning process. It is a lasting process meant to relatively iron out and enhance values, beliefs, customs, traditions, and practices that the education institutions share with their students (primary customers), and other customers. The transformation process considers the relationship between a particular institution and society. In the long run, quality has to be looked at as a practice, use, and experience.
2.5. Institutional customer groups
Anyone who is affected by the service or by the process used to provide the service in an institution is a customer. In other words, an institutional customer is defined as a person, group, department, or other institution directly or indirectly benefitting from the services being provided or establishing a relationship with the Institution (Sallis, Citation2014). The word “customer” being used in this study has the equivalent meaning as institutional clients or stakeholders used by the previous researchers, of which the terms are at times used interchangeably (Sahney, Citation2016). Education institutions have numerous customer groups and the customers of the education service are diverse with different needs and want. According to Spanbauer (Citation1995), there are two types of customers, being internal and external. Spanbauer sees students, employers, parents, communities, alumni, suppliers, government, and other institutions as external, the final consumers of the education products. The internal customers are those which assist management to provide the external customers’ needs and wants. They include the lecturers, administrators, the supporting staff, departments, and sections of the University (Militaru & Drăgu, Citation2009). Ishikawa was the first among the quality experts of TQM who introduced the importance of internal customers (C. H. Wang et al., Citation2012).
Kanji et al. (Citation1999) also came out to say that, the customers of Higher Education Institutions (HEIs) are divided into many different groups, of which they have links to the educational process. They classified the customers according to the location; being internal, within the institution, and external, outside the institution. They also classified customers according to the frequency of interaction that an institution has with the customers, into primary, secondary, or tertiary, being internal or external customers. They further considered that the product of higher education is the education service to students and depending on the role of students by the institutions, students can be classified as internal or external. The classification made is depicted in .
2.6. Measuring service quality through institutional customers’ perspective
In defining quality, different customers’ views must be taken into consideration as quality should be defined by the institutional customers (O’Neill & Palmer, Citation2004; Watty, Citation2005). Therefore, institutions’ service provision should be based on their customers’ specifications. According to Lagrosen et al. (Citation2004), understanding quality from the customers’ viewpoint is essential. Sureshchandar et al. (Citation2002), and Uthu et al., (2002) did research in Banking services. They recommended the need for this kind of study to underpin how service institutions like Banks perform in developing countries and what best practices need to be implemented to improve service quality. Many investigations were conducted in the education context from the institutional customers’ perception on how the efficiency and quality of classroom instructions be improved (Bayraktar et al., Citation2008; Chen et al., Citation2017; Kanji et al., Citation1999; Sakthivel et al., Citation2005; N. Zakuan et al., Citation2012).
In most of the previous studies conducted, their respondents were institutional management and staff (internal customers) only. Moreover, the previous researchers on quality management and its relationship with service quality performance mostly combined the internal and external customers in assessing service quality from one angle (Martinović et al., Citation2017). Meanwhile, the diverse nature of institutional customers, being external or internal, as well as being primary, secondary, or tertiary needs strong consideration. The current study also comprehends that such an investigation is vital for educational institutions to enhance their service quality performance.
2.7. Determinants of service quality dimension in education
Njenge et al. (Citation2015), and Oduor (Citation2015) pointed out that to measure quality performance, and consequently to improve quality, it is necessary to find out the service quality dimensions in relation to how TQM is being practised in an institution. The study literature has revealed that different researchers have used different quality dimensions to measure organisational service performance and for that matter, there are no universally accepted defined variables (Fening et al., Citation2008; N. M. Zakuan et al., Citation2010). Notably among them are shown in .
Table 1. Measurement scale and their quality dimensions used by previous researchers
All these measurement scales have different customer groups at the center of the quality dimensions and they used different quality dimensions as well as different measurement procedures. However, many researchers are familiar with the most popular service quality delivery model of Parasuraman et al. (Citation1988), the SERVQUAL, used to measure quality performance in both manufacturing and service organisations. The SERVQUAL quality dimensions are defined as follows:
Tangibility- Physical facilities, equipment, and appearance of personnel;
Reliability—Ability to perform the promised service dependably and accurately;
Responsiveness—Willingness to help customers and provide prompt service
Assurance—(including competence, courtesy, credibility, and security). That is management and employees’ knowledge, courtesy, and ability to inspire trust and confidence in the external customers and finally,
Empathy—(including access, communication, understanding the customer). Comprising caring and individualised attention an institution provides to its customers.
Despite the number of criticisms, researchers and practitioners seem to generally agree that the SERVQUAL instrument with 22 items is good predictors of the overall evaluation of service quality by consumers. However, it will be interesting to note that, the completeness of the 22-item scale proposed by Parasuraman et al. (Citation1988) in addressing the critical dimensions of service quality is a subject of further investigation because scrutiny of the scale items reveals that most of the items mainly focus on the human aspects of service delivery and the second dimension is the tangibles of service (Sureshchandar et al., Citation2002). The implication is that the four of the five SERVQUAL’s dimensions, namely, reliability, responsiveness, assurance, and empathy, correspond to the factor of the human element in the service delivery only. It appears that assessing any service institution with SERVQUAL dimensions is looking for only two indicators, namely “human aspects of service delivery” and “tangible of service”.
Although the importance and relevance of these SERVQUAL factors in predicting service quality are, without any uncertainty, acclaimed by many, it is also worth noting that the highly subjective concept of service quality is not only confined to the realms of these two dimensions. This current study is of the view that educational institutions could be evaluated on more than the two aforementioned dimensions (indicators) and therefore in support of Sureshchandar et al. (Citation2002), adopted the other three names of their quality dimensions in addition to the two. Although they used it in banking institutions, the five names fit to the constructs of the 26-items established through the Exploratory Factor analysis explained under the methodology section. The five service quality dimensions are listed in with the symbols used and an explanation of each of them.
Table 2. The five service quality dimensions used in this study
3. Methodology
According to Mertens (Citation2007), the nature of the definition of any research is influenced by the kind of theoretical framework which is referred to as the paradigm, meaning the knowledge claims. This portion of the main study that this paper focused on, is a quantitative research design and is to examine the outcome criteria from the implementation of TQM through a survey (Creswell, Citation2003). A survey is a strategy of inquiry in which the researcher identifies the essence of human experiences about the phenomenon as described by participants. Multisampling procedures were used in this study, including a purposive sample; simple random sampling; stratified sampling; probability proportional to the size, and systematic random sampling. The purposive sampling logic was relied upon, and the first public university institution operating Quality Management Systems (QMS) for more than 18 years was selected among the existing nine public universities in Ghana. When undertaking a quantitative data collection, it is important to consider the study population and determine the sample size (Teddlie & Tashakkori, Citation2009). From sample results, the researcher could generalise or makes claims about the population. This current study explores how external customers perceived the outcome of TQM implementation in an education context (Bell et al., Citation2018; Creswell, Citation2003). The selected university’s external customers were stratified into subgroups to have the sampling unit which covered the targeted population without overlap, and that, every element in the population belongs to one and only one unit (Ieva & Ziliani, Citation2018). This method was appropriate to collect sufficient information from the population to make statistical inferences (see ).
Table 3. Sample frame for the targeted population (External Customer Sub-groups)
The sample frame constructed for the study indicates the sub-groups of external customers under the three strata. The external customers by the frequency of interaction could be classified as primary, secondary, and tertiary with the students’ group as the only one in the primary stratum. The student group was picked, while the other two, the Alumni and Employers, were randomly selected from their secondary and tertiary strata or categories.
In trying to look at the assessment of TQM institutions, there is the need to compare the practices against the established theories of the quality experts. However, the evaluation procedure through the perceptions of customers should be treated differently between the external and internal customers of an institution. It is imperative therefore to look at these diverse customer groups differently when seeking their views on quality, hence this study focused on external customers. The external customers were chosen with the reason being that, they are the final consumer(s) of education services, typically they have a choice about where to do business, and establish a relationship with the preferred institution but, they are little known about the services being provided.
The total students’ population of the conventional system of the selected institution as of 2018 was 17,865. The study considered the regular students’ group at the expense of their sandwich and distance learners because they are the only group that has experienced for long on all the five quality dimensions used in measuring the institution performances. The registered Alumni for the last five years as of the period for investigation (2015–2019) were 2,620. In the case of employers/businesses group, according to figures from the Registered General Department (RGD), Ghana, 50 organisations with many branches all over the country were engaging the graduates between 2015 and 2019. depicts the breakdown of the targeted population and from each of the customer sub-groups (strata), probability proportional to size allocation was used in the selection of the participants from each sub-group. According to Krejcie and Morgan (Citation1970) table for determining the sample size for categorical data, supported by Cohen (Citation1988) formular calculated for the maximum sample size, 384 participants for the two subgroups (students and Alumni) were considered. Finally, all the 50 Employer organisations which have engaged the products of the institution were added to the two external customer sub-groups figure and give a total of 434 as shown in the last three columns of .
Table 4. The study population and sample size of External Customer sub-groups
3.1. Survey instrument and data collection procedures
A survey instrument was developed to elicit data from selected subgroups. An initial 39-item instrument was developed with help from the established theories of the quality experts and previous researchers’ measurement instruments used in both the manufacturing and service industries. The developed, instrument was pilot-tested in one of a public university, which was not selected for the main fieldwork. The data from 123 respondents were subjected to Exploratory Factor Analysis (EFA) to determine the number of latent factors (quality dimensions) the items could be assigned to. The most common method of factor analysis used was Principal Component Analysis (PCA). The mode adopted to determine the appropriateness of factor analysis in the pilot-tested was examined on the correlation matrix (Zikmund et al., Citation2013). A statistical test for the presence of correlations among the variables was computed. Items with low correlations (less than 0.30) usually will not have high loadings on the same factor. Any correlation values found greater than 0.3 are considered to be significant loadings and there is the need to have at least 3 items being loaded to each of the latent factors identified (Suhr, Citation2006). The items were reduced to 26 and were loaded onto five latent factors while the 13 items deleted were having correlation values of less than 0.3. the original and the final reliability values when items are deleted have been shown in the fourth and seventh columns respectively in .
Table 5. Item reliabilities for the five service quality dimensions
As a result of the piloting, the feedback was so relevant and called for modification and rewording of the remaining items of the developed instrument. Some of the items were too loaded for the respondents to complete at the scheduled time and were reworded. The latent factors were comparable to the quality dimensions used by Sureshchandar et al. (Citation2002) used in banking research in India, hence the names were adopted. The current study is of the view that these five quality dimensions cover the activities of any TQM Higher Education Institution on service provision. The instrument with 26-items was twofold and focuses on the external customers’ expectations and perceptions on service quality. Options to the items on expectations part were made on 5-point Likert-scales ranged from 1 (highly unimportant) to 5 (very important), while those on perceptions ranged from 1 (very unsatisfactory) to very 5 (satisfactory). The ordinal measurement scale which is a ranking of rating data that normally use integers in ascending order has been used in this study. The numbers assigned to the agreement scale (1, 2, 3, 4, 5) do not indicate that the intervals between the scales are equal, nor do they indicate absolute quantities (Naoum, Citation2012).
The respondents were asked to indicate how important their expectations are and how they perceived service quality. The designed instruments proven in this survey for measuring institutional service quality performance, intended to be a standard model was adapted and reworded from what Sureshchandar et al. (Citation2001) The survey instrument was revised based on the feedback from the pilot survey conducted, making the instruments more refined and worded. It was reworded and modified to suit the education context and therefore the instruments found to be valid and reliable (Shahin & Dabestani, Citation2010). The final 26-item instrument used to elicit information on the external customers’ expectations and perceptions in the main survey has been shown in Appendix A. The individual participants from the Student groups were selected using the systematic sampling techniques in which every tenth student from various programmes groupings was giving a questionnaire. The Alumni were contacted after receiving their list from the Alumni office of the university and questionnaires were administered to them through personal and email-addresses.
3.2. Data analysis and procedures
The following analysis was developed to meet the research purpose through the computation of statistical hypotheses tested to achieve the stated objectives. To achieve the stated objectives, the Validity and Reliability of the instrument was computed; the statistical hypotheses Ho1: the homogeneity test and Ho2: the paired samples t-test were computed. Finally, the relative important indices; the effect size, and service gaps were computed to determine the most significant of the dimensions, the existence of service gaps, and the magnitude of the effect of the gaps.
4. Presentation of findings
4.1. Response rate
A total of 434 questionnaires were administered personally with the assistance from two Senior Research Assistants. In all 364 questionnaires were returned, of which 361 were usable, while 3 questionnaires were either incomplete or ineligible. According to Saunders et al. (Citation2003), the overall response rate of 83.8%, is considered high and adequate to carry out the data analysis.
4.2. Reliability and validity of measurement instrument
Two reasons seem very necessary to analyse the reliability and validity of the survey instrument. First, the analysis assured of the responses and findings that they were truthful, credible, and therefore convincing (Neuman & Kreuger, Citation2003). Secondly, the valid and reliable instrument allowed others to replicate the use of the instrument for other comparative studies and with other populations (Hair et al., Citation2006). The reliability of the quality dimensions used in the instrument is related to the homogeneity of their items. It is a measure of the ability to have the same results when the instrument is used for similar research. Generally, reliability coefficients of 0.70 or more are considered acceptable or reliable in most social science research situations. Cronbach’s alpha values obtained for the five quality dimensions of service delivery are shown in . The Cronbach’s values including the overall value of 0.965, all above the suggested cut-off value of 0.70, testifies the reliability of the survey instrument (Hair et al., Citation2006). Therefore, the factor analysis is appropriate for the data and there is much confidence to conclude that each quality dimension is a sufficiently reliable measurement of the service quality (Ali & Raza, Citation2017).
Table 6. Reliability statistics of the factors (Quality Dimensions)
4.3. Validity for the instrument
The issues of validity like reliability are very important in order to determine whether the nine TQM principles measure the concepts they are supposed to measure as well as being stable and accurate (Hair et al., Citation2006). Validity is defined as the extent to which any instrument measures what it is intended to measure. In this study, content, and construct validity were considered to evaluate the measurement instruments. It was argued that the five service quality dimensions identified had content validity since the items developed were based mainly on an extensive literature review, detailed evaluations by quality expertise, and pilot-tested.
A measurement tool has construct validity if it measures the theoretical construct or it fits the theories around which the test is designed (Sekaran, Citation2003). Construct validity is one way to test the validity of a test; it’s used in education, the social sciences, and psychology. One type of construct validity is Convergent which sometimes claimed if the correlation coefficient is above.50, through factor analysis. The second type, which is discriminant validity shows that, two measures that are not supposed to be related are in fact, unrelated. Both types of validity are a requirement for excellent construct validity (Ali & Raza, Citation2017).
4.4. Homogeneity testing among the external customer perspective
The chi-square goodness-of-fit test is a single-sample nonparametric test, also referred to as Pearson’s chi-square goodness-of-fit test. It is used to determine whether the distribution of cases (survey participants) in a single categorical variable (external customer consisting of three groups: “students”, “Alumni” and “employers”) follows a known or hypothesised distribution. The data from individual participants of the various sub-groups were tested using the chi-square test of goodness-of-fit. The homogeneity test of external customer-perceived service quality was conducted to test if there were any differences in perceptions among the various customer subgroups. The chi-square goodness-of-fit test computed is depicted in . The test statistic was found to be statistically significant, with Chi-Square (χ2), the value of 271.85a, degree of freedom (2) and p-value = 0.00 < α (0.01).
Table 7. Test statistics output of external customer sub-groups
There was enough evidence to reject the null hypothesis and the conclusion was that there are statistically significant differences in the external customer sub-groups’ views on service quality dimensions. The deduction is that the University is serving diverse external customers and there is enough evidence to demonstrate that the various customer sub-groups have different views about the institutional service delivery.
4.5. Hypothesis testing: Paired samples t-test
A hypothesis test was conducted to determine if differences exist between the respondents’ expectations and perceptions. To test the difference between service quality expectation and perceived service quality delivered, a paired samples t-test was used to determine if there was any significant difference. In all the five dimensions at the 99% (α = 0.01) confidence level, there was a statistically significant difference between what external customers expected from the institution and their perceptions of the services offered. shows the overall customers’ results of mean differences in expectations and perceptions. The arithmetic mean differences, the standard deviation, as well as standard error mean of the expected and perceived service were computed with SPSS version 21 software. It is evident from the results that the mean differences for the service quality range from −10.18 to −2.81 on the five dimensions (see column 2 of ).
Table 8. A paired samples t-test of customers’ expectations and perceptions
The t-test results with the significance values (p-values = 0.00) for the service quality dimensions among the three selected subgroups are statistically significant. The study can vividly conclude that there is a difference between their expectations and perceptions of the service quality dimensions used in measuring the service performance.
4.6. Development of measurement scales and their interpretations
In developing the ranges of scales to interpret the mean scores of the respondents, the difference between the maximum rating value (5) and minimum rating value (1) was divided by five, thus [(5–1)/5 = 0.80]. The dividend (0.80) was added to each of the coded or the option values (1, 2, 3, 4) to form the upper limit of each range except the maximum (5) else it will be out of range. Again, the limits of the range should be closed. The Levels of Importance for expectations and levels of Satisfaction for perceptions had their ranges and interpretations shown in .
Table 9. Summary of the range of scales and their interpretation
4.7. Statistical analysis of the service quality dimensions by sub-group
The five quality dimensions included in this study were: Core service or service product (A); Human element of service delivery (B); Systematization of service delivery: non-human element (C); Tangibles of service (D) and Social responsibility (E). The grand mean scores for each of the five quality dimensions indicated from the three customer sub-groups were computed with their levels of importance and satisfaction interpreted (see ).
Table 10. Statistics on the grand mean scores of the service quality dimensions
In all the dimensions, the employers considered them as highly important, however, they perceived the delivery as low since they declared unsatisfactory rating for them. Both the Students and Alumni (past students) were of the view that the dimensions (core areas) are highly important to them and they are satisfied with their delivery by the institution as shown in .
4.8. Computation of relative important indices
EnShassi et al. (Citation2007) define ranking as a comparison among given options, within pairs of options, by the cardinality of importance (first, second, third), or those score items one at a time using a common scale, which also determines the importance of that factor. In this study, Important Indices was used to rank the variables for service quality dimensions. The Important Index (I.I) of determination of the significance of factors was adapted because, EnShassi et al. (Citation2007), emphasised that to analyse data on an ordinal scale like the 5-point Likert scale used in the study, the application of Important Index is necessary and suitable for interpretation of the findings. It is defined as follows:
Where: n1 = number of respondents who answered ‘1ʹ
n2 = number of respondents who answered ‘2ʹ
n3 = number of respondents who answered ‘3ʹ
n4 = number of respondents who answered ‘4ʹ
n5 = number of respondents who answered ‘5ʹ
The level of significance of the service quality dimensions was measured in two major parts, expectations, and perceptions which are shown in .
Table 11. Relative important indexes scores for customers subgroups
The student group considered the “Systematization of service delivery as the most significant dimension that they focus on before accepting the entry into the University for service. However, the Students after their experiences gained in the process of service provision perceived the Core service or service product as the most significant quality dimension.
In the case of the Alumni customer group, those who have already passed through the teaching and learning enterprise had their expectation similar to the current students. They rated the “Systematisation of service delivery” as the most important dimension. Nevertheless, they perceived the core service or service product and Systematization of service delivery as their most relevant quality dimension with the Human element of service delivery being low in delivery. Employers/Businesses were of different views as they ranked the Core service or service product (95%) as the most significant service quality dimension to them before establishing a relationship with the university. This could probably be associated with the fact that they need the graduates with knowledgeable skills who could fit for the job. At the end, Employers considered the human element of service delivery (76%) as the most significant quality dimension after their experiences gained with the institution. All three sub-groups considered “Social responsibility” as the least significant service quality dimension.
4.9. Service gaps and effect size computation
Of the seven service gaps professed by Parasuraman et al., 1995, The Gap5 definition “discrepancy between customer expectations and their perceptions of the service delivered” is more related to external customers (Luk & Layton, 2002). In this case, customer expectations are influenced by the extent of personal needs, word of mouth, recommendation, and past service experiences. Customer perceptions are also influenced by the experiences and observations gained by the customers after having a relationship with the service providers. It was then considered to be the true measure of service quality in this study. The service quality gap scores analysis was computed by summation of the means of expectations and perceptions of the respondents. The procedure for the computation has been analytically framed showing the true picture of the service Gap as shown in .
Figure 2. Analytical framework for service gaps. (Reseachers own, 2017)
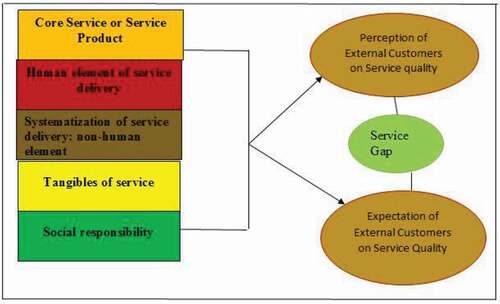
The framework depicts the level of gaps that exists between customers’ expectations and perceptions among the selected external customers of the University in the content of service quality. Service quality gap (G) is obtained by subtracting Expectation (E) scores from the Perception (P) score for each item (G = P-E). Three possible results are likely to happen. First is, either perception (P) exceeding expectation (E), thus (P > E), which means service quality is very satisfactory to the customer; if perception (P) equals expectation (E), thus (P = E), then service quality is satisfactory and finally, when University’s (P) is less than expectation (E), (P < E), the service quality is poor or unsatisfactory to the customers. Although the study was focused on external customers’ perspectives on service performance, it is also necessary to look at individual sub-group basis on each service quality dimension due to the diverse nature of the respondents. The service gaps computation is depicted in .
Table 12. Service quality gap scores and effect size
However, while a P-value can inform the reader whether an effect exists, the P-value will not reveal the size of the effect. In reporting and interpreting research findings, both the statistical significance (P-value) and substantive significance (effect size) are essential results to be reported. The effect size is a statistical concept that measures the strength of the relationship between two variables on a numeric scale. Effect size calculated in this study is the magnitude of the difference between customers’ expectations and perceptions. The greater the effect size, the greater the difference between the two variables. The standardized values of Effect size are; Small, when d = 0.2, Medium when d = 0.5, and Large effect, when d ≥ 0.8, based on benchmarks suggested by (Cohen, Citation1988 as cited in Cohen et al., Citation2007).
It is worth noting that the negative signs attached to the Gap values are an indication of significant shortfalls in meeting customers’ expectations across all service quality dimensions. The findings depict that, the external customers were expecting more from both the Human and Non-human service delivery of the University service and therefore perceived the service delivery as low. To interpret this effect, the common language effect size has been computed and shown in the last column of . In the case of the “human element of service delivery” and “non-human service delivery”, the magnitude of the effects on these two quality dimensions are large on the university’s service performances.
The finding of the service gaps scores at the various sub-groups levels and the magnitude of the effects have also followed the same trend of the overall responses. The Students and Alumni portrayed more service gaps in human and non-human elements of service delivery with large effect, while the Alumni had large service gaps on the core service and social responsibility with medium effect. A look at the gap scores for employers shows that their perception fell short of their expectations with vast service gaps as compared to other customer groups portrayed in all the five quality dimensions. However, it may interest to know that, the magnitudes of effect on the two dimensions with the highest service gaps scores (Social responsibilities = 0.56; Core services = 0.62) were found to have a medium effect, as compared to those indicated by other subgroups.
5. Discussions, conclusions, and recommendations
5.1. Discussion of findings
In general, the research on measuring service quality has focused primarily on how to meet or exceed the external customer’s expectations, and considered the perceived service quality as a measure of how the level of service performance matches their expectations (Kang et al., Citation2002). The study tested hypothetically the homogeneity of the respondents’ views and the differences between their expectations and perceptions which truly depicted that there are statistically significant differences. The study also determines the level of significance of the quality dimensions used in measuring service quality. The three subgroups of the external customers have diverse expectations and perceptions, and therefore imperative to know their relative importance of the identified quality dimensions.
In aggregate, there is the existence of service gaps between external customers’ expectations and their perception of the quality of service delivered to them by the university. It depicted that the service gaps exist. There was evidence of diverse views among the selected external customer subgroups of UCC, the students, employers, and Alumni. The subgroups have varied expectations and perceptions and they were found to vary for each of the service quality dimensions. When responses from the subgroups were analysed separately, it was found that the service gap was larger in the side of employers on all five dimensions. This may indicate that employers had greater concerns about the services the University provides to students.
Perhaps, the students considered the human and non-human aspects of quality dimensions to be more relevant to them when they sought admission into the University, just like the Alumni customer-group who had had the experience. However, whereas the students were satisfied with the core service after being with the University for some period, the Alumni were not satisfied with the core service and social responsibility of the University. By implication, students usually expect more service delivery, while studying in the University. However, the employers and businesses that need the services of the institutional graduates considered the “core service” or “service product”, as the most important dimension. Their experience depicted a low level of satisfaction for it. In general, the study has looked at measuring service quality primarily from the perspective of how to meet or exceed the external customer’s expectations. The service quality is viewed as a measure of how the delivered service level matches consumer’s expectations (Kang et al., Citation2002).
In the first place, the study supported the service gap analysis with scientific proof, by computing the test hypothetically if the gaps exist with diverse views of the selected customers. The effect size of the gap to determine the magnitude of the effect was also calculated. The study has therefore established the levels of expectations at the aggregated level and individual sub-group levels. On both the aggregate and individual group levels, there exists a gap between external customers’ expectations of service quality and their perceptions of how they experienced the service quality delivered to them by the university.
6. Conclusions
The study literature has reviewed that different researchers have used different indicators to measure organisational performance and for that matter, there are no universally accepted define variables (N. M. Zakuan et al., Citation2010). However, through Exploratory Factor Analysis (EFA) this current study has identified five major core areas that every Higher Education Institution (HEI) is expected to operate. These five constructs identified and referred to as service quality dimensions with a total of 26 items was developed as a measurement instrument and solicited information from the three selected external customer subgroups. Data on the respondents’ expectations and perceptions informed the needs and wants, and the satisfactory level of the diverse institutional customers. Service quality performances and customer satisfaction are the core mandate of educational institutions and the results have indicated the existence of service gaps which therefore implies unsatisfactory service delivery. The respondents among the final consumers of the education service and their voices have been heard and their involvement is a very important concept. In this paper, a measurement instrument with the five quality dimensions has vividly revealed the relevancy of assessing the service performances of a TQM institution. The Relative Important Index computed, facilitates the identification of the level of significance of the quality dimensions contributing to service quality performance in the HEIs, while the existing service gaps and the magnitude of the effect determined in this study have happened at the right time of global competitiveness.
6.1. Recommendations
The university management should acknowledge the five service quality dimensions identified to evaluate the institutional performances to meet or exceed their diverse customers’ expectations.
The university management should regularly listen to the voices of their external customers (final consumers) and consider the feedback to improve service quality.
The university management, together with the quality assurance facilitators and all internal customers should address the service gaps identified by the external customers.
The instrument developed has been proved to be valid and reliable and therefore recommended to other educational institutions, both private and public to assess their service quality performances.
6.2. Limitation of the study
The study after developing its instrument and subjected the pilot-tested results into factor analysis decided to name the five constructs acquired the same as what the Sureshchandar et al. (Citation2002) used. They could also be named differently by different researchers provided the names given apply to education service activities.
The survey instruments were based on the general opinion of the selected staff of the university and the three randomly selected subgroups of the external customers as against the census survey, which is not verifiable to some extent and hence could limit the findings of the research.
The total evaluation of TQM implementation comprises three distinct but interrelated assessments namely: TQM implementation itself, assessment of process criteria, and assessment of outcome criteria. However, the study focused on the third assessment that talks about service quality performance, hence having limited literature studies on the other two.
Additional information
Funding
Notes on contributors

Albert Justice Kwarteng
Dr. Albert Justice Kwarteng is a Research Fellow (Statistician) with extensive experience of working with large research teams consisting of economists, statisticians, and systematic reviewers. He is also the Head of Quality Assurance Section at the University of Cape Coast (UCC), Ghana. This paper comes from broader research in partial fulfillment of the requirements for the award of Doctor of Philosophy (Ph.D.) Degree in Qualitative Research in Education. There is a paucity of empirical studies related to the total evaluation of TQM institutions outside developed countries. A total evaluation of a TQM philosophy includes three distinct but interrelated types of assessment which include: the TQM implementation itself, the process criteria, and the outcome criteria. The research addresses a gap in the literature with UCC as a case study. This paper of the study focuses on the assessment of outcome criteria, where service performance was assessed from the external customers’ perspective.
References
- Abdullah, F. (2006). The development of HEdPERF: A new measuring instrument of service quality for the higher education sector. International Journal of Consumer Studies, 30(6), 569–25. https://doi.org/https://doi.org/10.1111/j.1470-6431.2005.00480.x
- Abubakar, N. J., Sighn, G., & Mohammed, I. (2018). Development of total quality management framework for higher education institutions in Ghana- A case study of three public universities. Asian Journal of Management, 9(1), 383–392. https://doi.org/https://doi.org/10.5958/2321-5763.2018.00059.8
- Ahmed, R., & Ali, S. I. (2016). Implementing TQM practices in Pakistani higher education institutions. Pakistan Journal of Engineering, Technology, and Science, 2(1), 1–26. https://doi.org/https://doi.org/10.22555/pjets.v2i1.692
- Ali, M., & Raza, S. A. (2017). Service quality perception and customer satisfaction in Islamic banks of Pakistan: The modified SERVQUAL model. Total Quality Management & Business Excellence, 28(5–6), 559–577. https://doi.org/https://doi.org/10.1080/14783363.2015.1100517
- Al-Marri, K., Moneim, M., Baheeg Ahmed, A., & Zairi, M. (2007). Excellence in service: An empirical study of the UAE banking sector. International Journal of Quality & Reliability Management, 24(2), 164–176. https://doi.org/https://doi.org/10.1108/02656710710722275
- Al-Tarawneh, H., & Mubaslat, M. (2011). The Implementation of Total Quality Management (TQM) On the higher educational sector in Jordan. International Journal of Industrial Marketing, 1(2), 1–10. https://doi.org/https://doi.org/10.5296/ijim.v1i1.771
- Andrade, J., Mendes, L., & Lourenço, L. (2017). Perceived psychological empowerment and total quality management-based quality management systems: An exploratory research. Total Quality Management & Business Excellence, 28(1–2), 76–87. https://doi.org/https://doi.org/10.1080/14783363.2015.1050166
- Anwowie, S., Amoako, J., & Abrefa, A. A. (2015). Assessment of students’ satisfaction of service quality in Takoradi polytechnic: The students’ perspective. Journal of Education and Practice, 6(29), 148–155.
- Bayraktar, E., Tatoglu, E., & Zaim, S. (2008). An instrument for measuring the critical factors of TQM in Turkish higher education. Total Quality Management, 19(6), 551–574. https://doi.org/https://doi.org/10.1080/14783360802023921
- Bell, E., & Bryman, A. (2007). The ethics of management research: An exploratory content analysis. British Journal of Management, 18(1), 63–77. https://doi.org/https://doi.org/10.1111/j.1467-8551.2006.00487.x
- Bell, E., Bryman, A., & Harley, B. (2018). Business research methods. Oxford University Press.
- Berlin Communiqué. (2003). Realising the European higher education area. Communiqué of the Conference of Ministers responsible for Higher Education in Berlin. Retrieved September 19, 2003, from www.bologna-berlin2003.de
- Bhat, B. A. (2017). Teachers’ Perception towards total quality management in secondary schools. EDUCARE, 9(1).
- Bhat, K. S., & Rajashekhar, J. (2009). An empirical study of barriers to TQM implementation in Indian industries. The TQM Journal, 21(3), 261–272. https://doi.org/https://doi.org/10.1108/17542730910953031
- Chen, I. S., Chen, J. K., & Padró, F. F. (2017). Critical quality indicators of higher education. Total Quality Management & Business Excellence, 28(1–2), 130–146. https://doi.org/https://doi.org/10.1080/14783363.2015.1050178
- Chua, C. (2004, July). Perception of quality in higher education. In Proceedings of the Australian universities’ quality forum (pp. 181–187). Melbourne, Australian University Quality Agency
- Cohen, J. (1988). Statistical power analysis for the behavioral sciences (2nd ed.). Lawrence Erlbaum.
- Cohen, L., Manion, L., & Morrison, K. (2007). Research methods in education (6th ed.). Routledge.
- Creswell, J. W. (2003). Research Design: Qualitative, quantitative and mixed methods approach (2nd ed.). Sage.
- Dale, B. G., Bamford, D., & van der Wiele, T. (Eds.). (2016). Managing quality: An essential guide and resource gateway. John Wiley & Sons.
- Das, A., Handfield, R. B., Calantone, R. J., & Ghosh, S. (2000). A contingent view of quality management‐the impact of international competition on quality. Decision Sciences, 31(3), 649–690. https://doi.org/https://doi.org/10.1111/j.1540-5915.2000.tb00938.x
- Douglas, T. J., & Judge, W. Q., Jr. (2001). Total quality management implementation and competitive advantage: The role of structural control and exploration. Academy of Management Journal, 44(1), 158–169.
- EnShassi, A., Mohamed, S., Mayer, P., & Abed, K. (2007). Benchmarking masonry labor productivity. International Journal of Productivity and Performance Management, 56(4), 358–368. https://doi.org/https://doi.org/10.1108/17410400710745342
- Eriksson, H., & Hansson, J. (2003). The impact of TQM on financial performance. Measuring Business Excellence, 7(1), 36–50.
- Feigenbaum, A. V. (1983). Quality control (3rd ed.). McGraw-Hill.
- Fening, F. A., Pesakovic, G., & Amaria, P. (2008). Relationship between quality management practices and the performance of small and medium size enterprises (SMEs) in Ghana. International Journal of Quality & Reliability Management, 25(7), 694–708. https://doi.org/https://doi.org/10.1108/02656710810890881
- Flynn, B. B., Schroeder, R. G., & Sakakibara, S. (1994). A framework for quality management research and an associated measurement instrument. Journal of Operations Management, 11(4), 339–366. https://doi.org/https://doi.org/10.1016/S0272-6963(97)90004-8
- Gallear, D., Aldaweesh, M., & Al-Karaghouli, W. (2012). The relationship between total quality management implementation and leadership in the Saudi higher education: A review and conceptual framework.
- Gómez, J. G., Martinez Costa, M., & Martinez Lorente, A. R. (2017). EFQM Excellence Model and TQM: An empirical comparison. Total Quality Management & Business Excellence, 28(1–2), 88–103. https://doi.org/https://doi.org/10.1080/14783363.2015.1050167
- Hair, J. F., Black, W. C., Babin, B. J., Anderson, R. E., & Tatham, R. (2006). Multivariate data analysis. Uppersaddle River.
- Hajjem, O. (2016). Determinants of quality management systems implementation in Tunisian firms. Journal of Innovation Management, 4(2), 156–175. https://doi.org/https://doi.org/10.24840/2183-0606_004.002_0008
- Hasham, S. E. (2018). Academic institutions are no different to any other: Total quality management does enhance performance. International Journal of Organizational Leadership, 7(4), 348–373. https://doi.org/https://doi.org/10.33844/ijol.2018.60340
- Ibrahim, M. Z., Ab Rahman, M. N., & Yasin, R. M. (2012). Assessing students’ perceptions of service quality in technical educational and vocational training (TEVT) institution in Malaysia. Procedia-Social and Behavioral Sciences, 56, 272–283. https://doi.org/https://doi.org/10.1016/j.sbspro.2012.09.655
- Ieva, M., & Ziliani, C. (2018). The role of customer experience touchpoints in driving loyalty intentions in services. The TQM Journal, 30(5), 444–457. https://doi.org/https://doi.org/10.1108/TQM-11–2017-0141
- Irani, Z., Beskese, A., & Love, P. E. D. (2004). Total quality management and corporate culture: Constructs of organizational excellence. Technovation, 24(8), 643–650. https://doi.org/https://doi.org/10.1016/S0166-4972(02)00128-1
- Kang, G. D., Jame, J., & Alexandris, K. (2002). Measurement of internal service quality: Application of the SERVQUAL battery to internal service quality. Managing Service Quality: An International Journal, 12(5), 278–291. https://doi.org/https://doi.org/10.1108/09604520210442065
- Kanji, G. K., Malek, A., & Tambi, B. A. (1999). Total quality management in UK higher education institutions. Total Quality Management, 10(1), 129–153. https://doi.org/https://doi.org/10.1080/0954412998126
- Kaynak, H. (2003). The relationship between total quality management practices and their effects on firm performance. Journal of Operations Management, 21(4), 405–435. https://doi.org/https://doi.org/10.1016/S0272-6963(03)00004-4
- Khanna, V. K. (2009). 5 “S” and TQM status in Indian organizations. The TQM Journal, 21(5), 486–501. https://doi.org/https://doi.org/10.1108/17542730910983407
- Koch, J. V. (2003). TQM: Why is its impact in higher education so small? The TQM Magazine, 15(5), 325–333. https://doi.org/https://doi.org/10.1108/09544780310487721
- Koch, J. V., & Fisher, J. L. (1998). Higher education and total quality management. Total Quality Management, 9(8), 659–668. https://doi.org/https://doi.org/10.1080/0954412988136
- Kotler, P., & Turner, R. E. (1993). Marketing Management: Analysis, planning, implementation and control (7th Canadian ed.). Prentice-Hall.
- Krejcie, R. V., & Morgan, D. W. (1970). Determining sample size for research activities. Educational and Psychological Measurement, 30(3), 607–610. https://doi.org/https://doi.org/10.1177/001316447003000308
- Kumar, R., Garg, D., & Garg, T. K. (2009). Total quality management in Indian industries: Relevance, analysis and directions. The TQM Journal, 21(6), 607–622. https://doi.org/https://doi.org/10.1108/17542730910995873
- Lagrosen, S., Seyyed-Hashemi, R., & Leitner, M. (2004). Examination of the dimensions of quality in higher education. Quality Assurance in Education, 12(2), 61–69. https://doi.org/https://doi.org/10.1108/09684880410536431
- Lewis, B. R., & Mitchell, V. W. (1990). Defining and measuring the quality of customer service. Marketing Intelligence & Planning, 8(6), 11–17. https://doi.org/https://doi.org/10.1108/EUM0000000001086
- Martinović, M., Pavlić, I., & Šuman Tolić, M. (2017). Measurement of local public services’quality using servqual: The case of dubrovnik. Ekonomska Misao I Praksa, (2), 593–610.
- Mateos-Ronco, A., & Hernández Mezquida, J. M. (2018). Developing a performance management model for the implementation of TQM practices in public education centres. Total Quality Management & Business Excellence, 29(5–6), 546–579. https://doi.org/https://doi.org/10.1080/14783363.2016.1216309
- Mattah, P. A. D., Kwarteng, A. J., & Mensah, J. (2018). Indicators of service quality and satisfaction among graduating students of a higher education institution (HEI) in Ghana. Higher Education Evaluation and Development, 12(1), 36–52. https://doi.org/https://doi.org/10.1108/HEED-10-2017-0006
- Mertens, D. M. (2007). Transformative paradigm mixed methods and social justice. Sage Publications.
- Militaru, C., & Drăgu, B. (2009). Management through quality. Printech Publishing House.
- Mohammed, K., Alotibie, B. A., & Abdulaziz, A. (2016). Total quality management in Saudi higher education. International Journal of Computer Applications, 135(4), 6–12. https://doi.org/https://doi.org/10.5120/ijca2016908245
- Motwani, J., & Kumar, A. (1997). The need for implementing total quality management in education. International Journal of Educational Management., 11(3), 131–135.
- Naing, L., Winn, T., & Rusli, B. N. (2006). Practical issues in calculating the sample size for prevalence studies. Archives of Orofacial Sciences, 1, 9–14.
- Nair, A. (2006). Meta-analysis of the relationship between quality management practices and firm performance—implications for quality management theory development. Journal of Operations Management, 24(6), 948–975. https://doi.org/https://doi.org/10.1016/j.jom.2005.11.005
- Naoum, S. G. (2012). Dissertation research and writing for construction students. Routledge.
- Neuman, W. L., & Kreuger, L. (2003). Social work research methods: Qualitative and quantitative approaches. Allyn and Bacon.
- Njenge, L., Vermeulen, A., & Pretorius, J. H. C. (2015, June). Total quality management adoption by process engineering design firms in South Africa. IAMOT.
- O’Neill, M. A., & Palmer, A. (2004). Importance-performance analysis: A useful tool for directing continuous quality improvement in higher education. Quality Assurance in Education, 12(1), 39–52. https://doi.org/https://doi.org/10.1108/09684880410517423
- Oduor, C. (2015). Total quality management and performance of public universities in Kenya [Doctoral dissertation]. University of Nairobi.
- Ogachi, O. (2009). Internationalization vs regionalization of higher education in East Africa and the challenges of quality assurance and knowledge production. Higher Education Policy, 22(3), 331–347. https://doi.org/https://doi.org/10.1057/hep.2009.9
- Parasuraman, A., Zeithaml, V. A., & Berry, L. L. (1985). A conceptual model of service quality and its implications for future research. Journal of Marketing, 49(4), 41–50. https://doi.org/https://doi.org/10.1177/002224298504900403
- Parasuraman, A., Zeithaml, V. A., & Berry, L. L. (1988). SERVQUAL:A multiple-item scale for measuring consumer perceptions of service quality. Journal of Retailing, 64(1), 12–40.
- Parumasur, S. B., & Govender, P. (2013). Role of monitoring and controlling quality in total quality management (TQM). Problems and Perspectives in Management, 11(4), 147–157.
- Prajogo, D. I., & Sohal, A. S. (2006). The relationship between organization strategy, total quality management (TQM), and organization performance–the mediating role of TQM. European Journal of Operational Research, 168(1), 35–50. https://doi.org/https://doi.org/10.1016/j.ejor.2004.03.033
- Pratasavitskaya, H., & Stensaker, B. R. (2010). Quality management in higher education: Towards a better understanding of an emerging field. Quality in Higher Education, 16(1), 37–50. https://doi.org/https://doi.org/10.1080/13538321003679465
- Reinalda, B., & Kulesza, E. (2006). The Bologna process–Harmonizing Europe’s higher education: Including the essential original texts. Verlag Barbara Budrich.
- Rosa, M. J., Sarrico, C. S., & Amaral, A. (2012). Implementing quality management systems in higher education institutions. In M. Savsar (Ed.), Quality Assurance and Management (pp. 129–146). Rijeka: InTech.
- Sadikoglu, E., & Olcay, H. (2014). The effects of total quality management practices on performance and the reasons of and the barriers to TQM practices in Turkey. Advances in Decision Sciences, 2014, 1–17. https://doi.org/https://doi.org/10.1155/2014/537605
- Sadikoglu, E., & Zehir, C. (2010). Investigating the effects of innovation and employee performance on the relationship between total quality management practices and firm performance: An empirical study of Turkish firms. International Journal of Production Economics, 127(1), 13–26. https://doi.org/https://doi.org/10.1016/j.ijpe.2010.02.013
- Sahney, S. (2016). Use of multiple methodologies for developing a customer-oriented model of total quality management in higher education. International Journal of Educational Management, 30(3), 326–353. https://doi.org/https://doi.org/10.1108/IJEM-09-2014-0126
- Sakthivel, P. B., Rajendran, G., & Raju, R. (2005). TQM implementation and students’ satisfaction of academic performance. The TQM Magazine, 17(6), 573–589. https://doi.org/https://doi.org/10.1108/09544780510627660
- Salaheldin, S. I. (2009). Critical success factors for TQM implementation and their impact on performance of SMEs. International Journal of Productivity and Performance Management, 58(3), 215–237. https://doi.org/https://doi.org/10.1108/17410400910938832
- Sallis, E. (2014). Total quality management in education. Kogan Page Ltd.
- Samson, D., & Terziovski, M. (1999). The relationship between total quality management practices and operational performance. Journal of Operations Management, 17(4), 393–409. https://doi.org/https://doi.org/10.1016/S0272-6963(98)00046-1
- Saunders, M. D., Timler, G. R., Cullinan, T. B., Pilkey, S., Questad, K. A., & Saunders, R. R. (2003). Evidence of contingency awareness in people with profound multiple impairments: Response duration versus response rate indicators. Research in Developmental Disabilities, 24(4), 231–245. https://doi.org/https://doi.org/10.1016/S0891-4222(03)00040-4
- Sekaran, U. (2003). Towards a guide for novice research on research methodology: Review and proposed methods. Journal of Cases of Information Technology, 8(4), 24–35.
- Shahin, A., & Dabestani, R. (2010). Correlation analysis of service quality gaps in a four-star hotel in Iran. International Business Research, 3(3), 40. https://doi.org/https://doi.org/10.5539/ibr.v3n3p40
- Spanbauer, S. J. (1995). Reactivating higher education with total quality management: Using quality and productivity concepts, techniques and tools to improve higher education. Total Quality Management, 6(5), 519–538. https://doi.org/https://doi.org/10.1080/09544129550035189
- Stanton, J. M., Sinar, E. F., Balzer, W. K., & Smith, P. C. (2002). Issues and strategies for reducing the length of self‐report scales. Personnel Psychology, 55(1), 167–194. https://doi.org/https://doi.org/10.1111/j.1744-6570.2002.tb00108.x
- Strydom, A. H., & Strydom, J. F. (2004). Establishing quality assurance in the South African context. Quality in Higher Education, 10(2), 101–113. https://doi.org/https://doi.org/10.1080/1353832042000230590
- Suhr, D. D. (2006). Exploratory or confirmatory factor analysis? Statistics and Data Analysis. SUGI 31 Proceedings, 200-231. Users Group International Conference. Cary, NC: SAS Institute Inc.
- Sureshchandar, G. S., Rajendran, C., & Anantharaman, R. N. (2001). A holistic model for total quality service. International Journal of Service Industry Management, 12(4), 378–412. https://doi.org/https://doi.org/10.1108/09564230110405299
- Sureshchandar, G. S., Rajendran, C., & Anantharaman, R. N. (2002). The relationship between service quality and customer satisfaction–a factor specific approach. Journal of Services Marketing, 16(4), 363–379. https://doi.org/https://doi.org/10.1108/08876040210433248
- Talib, F., Rahman, Z., & Qureshi, M. N. (2013). An empirical investigation of relationship between total quality management practices and quality performance in Indian service companies. International Journal of Quality & Reliability Management, 30(3), 280–318. https://doi.org/https://doi.org/10.1108/02656711311299845
- Teddlie, C., & Tashakkori, A. (2009). Foundations of mixed methods research: Integrating quantitative and qualitative approaches in the social and behavioral sciences. Sage Publication Inc.
- Terziovski, M., & Samson, D. (1999). The link between total quality management practice and organisational performance. International Journal of Quality & Reliability Management, 16(3), 226–237. https://doi.org/https://doi.org/10.1108/02656719910223728
- Tsinidou, M., Gerogiannis, V., & Fitsilis, P. (2010). Evaluation of the factors that determine quality in higher education: An empirical study. Quality Assurance in Education, 18(3), 227–244. https://doi.org/https://doi.org/10.1108/09684881011058669
- Tuan, V. K., & Rajagopal, P. (2018). An investigation of factors affecting customers’ satisfaction in the supermarket sector in Ho Chi Minh City (HCMC)-Vietnam. British Journal of Marketing Studies, 6(5), 42–61. www.eajournals.org
- University of Cape Coast [UCC]. (2017). Basic statistics. UCC Printing Press.
- Wang, C. H., Chen, K. Y., & Chen, S. C. (2012). Total quality management, market orientation and hotel performance: The moderating effects of external environmental factors. International Journal of Hospitality Management, 31(1), 119–129. https://doi.org/https://doi.org/10.1016/j.ijhm.2011.03.013
- Wang, H., Kim, K. H., Ko, E., & Liu, H. (2016). Relationship between service quality and customer equity in traditional markets. Journal of Business Research, 69(9), 3827–3834. https://doi.org/https://doi.org/10.1016/j.jbusres.2016.04.007
- Watty, K. (2005). Quality in accounting education: What say the academics? Quality Assurance in Education, 13(2), 120–131. https://doi.org/https://doi.org/10.1108/09684880510594373
- Yang, C. C. (2006). The impact of human resource management practices on the implementation of total quality management. The TQM Magazine, 18(2), 162–173. https://doi.org/https://doi.org/10.1108/09544780610647874
- Yousuf, M. A., & Wahab, E. B. (2017). The role of trust in the relationship between quality factors and customer satisfaction in mobile banking: A conceptual framework. The Social Sciences, 12(4), 712–718.
- Zakuan, N., Muniandy, S., Saman, M. Z. M., Ariff, M. S. M., Sulaiman, S., & Jalil, R. A. (2012). Critical success factors of total quality management implementation in higher education institution: A review. International Journal of Academic Research in Business and Social Sciences, 2(12), 185-203. DOI: https://doi.org/10.1080/14783360903550020
- Zakuan, N. M., Yusof, S. M., Laosirihongthong, T., & Shaharoun, A. M. (2010). Proposed relationship of TQM and organisational performance using structured equation modelling. Total Quality Management, 21(2), 185–203. https://doi.org/https://doi.org/10.1080/14783360903550020
- Zeithaml, V. A., Parasuraman, A., & Malhotra, A. (2002). Service quality delivery through web sites: A critical review of extant knowledge. Journal of the Academy of Marketing Science, 30(4), 362–375. https://doi.org/https://doi.org/10.1177/009207002236911
- Zikmund, W. G., Babin, B. J., Carr, J. C., & Griffin, M. (2013). Sampling designs and sampling procedures. Business Research Methods, 394–395. http://www.ccc.commnet.edu/apa/
- Zografaki, E., Magoutas, A., & Chountalas, P. (2017). Focus on human resources as a mediating factor between ISO 9001 certification and continuous quality improvement. International Journal of Decision Sciences, Risk and Management, 7(1–2), 105–122. https://doi.org/https://doi.org/10.1504/IJDSRM.2017.084010