Abstract
Economic restructuring has led to the emergence of new socio-economic arrangements in cities based on the cognitive-cultural economy. Furthermore, the arrival of new middle classes in inner-cities has contributed to a renaissance of interest in urban culture and new consumption spaces. Focusing on specialty coffee bars (SCBs), the study explores their spatial patterns and spatial distributions in Amsterdam in order to find the spatial correlations between new urban consumption spaces and their locational economic strategies in terms of the cognitive-cultural opportunities. By employing geographic information system (GIS), the findings suggest a positive spatial correlation between urban areas involved in the cognitive-cultural economy and the concentration of SCBs. Although the argued correlation does not imply causation, it provides distinct insights related to the interconnectedness of new urban consumption spaces and their contextual urban economy. The paper also slightly touches upon some of the capabilities of GIS in the field of urban studies and poses some questions for further investigations.
Public Interest Statement
In parallel with the expansion of the cognitive-cultural economy, specialty coffee bars are mushrooming in almost all urban settings across the globe. The dispersion of them, however, has appeared to be quite uneven within the urban areas. Pursuing a GIS-based methodology, the author has argued that there is a positive spatial correlation between the concentration of specialty coffee bars within specific regions of Amsterdam and the embedded economic opportunities.
1. Introduction
There is an intimate relationship between urbanisation and capitalism. In other words, every historical phase of capitalism has its own distinctive urban form with its own corresponding, equally unique, type of urban living (Scott, Citation2008). For instance, in the post-Second World War era, in the Fordist period, cities were going down and people were leaving them for suburbs (Fava, Citation1956; Walks, Citation2013). However, the shift from Fordism to post-Fordism that has had a strong bearing on learning, creativity and innovation has led to the emergence of new socio-economic arrangements in cities and, as a result, an enormous urban resurgence (Gordon, Citation2004) as a function of the revivification and spread of the cognitive-cultural economy (Scott, Citation2008, Citation2012). This new economy has come to focus on unstandardised products in sectors like technology-intensive production, business, finance and personal services, as well as a wide array of cultural industries ranging from the media to fashion-intensive crafts (Scott, Citation2014).
Associated with the economic change, new middle classes are arriving in inner-cities. Searching for consumption spaces which fit their distinctive lifestyles and fulfil their consumption preferences, newcomers have transformed the retail landscape of neighbourhoods (Gammon & Elkington, Citation2015; Zukin, Citation2010). Certain types of restaurants, cafes, bars and shops have emerged in certain neighbourhoods as highly visible signs of gentrification (Zukin et al., Citation2009) and also as the “critical infrastructure of new urban culture” (Zukin & Kosta, Citation2004, p. 102).
Amongst the new urban consumption spaces changing the streetscape of cities, specialty coffee bars (SCBs) have drawn not only the attention of people on the streets, but also people in academia. Reviewing the scholarly literature suggests that social scientists mostly have put these mushrooming urban spaces within the broader context of gentrification and/or new urban middle class debates and have tried to shed light on darker relationships. For example, and just to mention a few, there are studies on the relationship between the rise of coffee shops and class composition restructuring (Roseberry, Citation1996), coffee culture, knowledge and connoisseurship as forms of (sub)cultural capital (Gavin, Citation2013; Manzo, Citation2010), brand and coffee societies (Bookman, Citation2013a, Citation2013b, Citation2014; Thompson & Arsel, Citation2004) and also place attachment and social behaviours within these consumption spaces (Waxman, Citation2006). So far, however, there has been little discussion about the geographical aspects of coffeehouses. Furthermore, except those studies which relate coffeehouses as part and parcel of gentrification, few studies have attempted to answer why and how SCBs have been distributed in urban settings in certain fashions or why some neighbourhoods have housed more coffeehouses than others. Is there any spatial pattern behind the geographical locations of coffee bars and the dominant urban economy?
In this light, the paper focuses on the urban geography of SCBs to determine whether there is any meaningful connection between new urban consumption spaces and their locational strategies in terms of the cognitive-cultural economic opportunities. In other words, the research tries to answer why SCBs are located in particular urban areas, and whether their concentrations are related to particular types of economic sectors in those urban areas. In this regard, Amsterdam, as a city characterised by an economy that, at least partially, seems to fit the cognitive-cultural discourse and has a vibrant urban setting with a wide-ranging coffee scene, has been selected for understanding relationships between the new form of urban economy and new urban consumption spaces.
The research data in this paper are drawn from two main sources: the Dutch six-digit postcodes of SCBs from an internet-based data collection, as well as detailed socio-economic data (employment and business establishments) at the two urban levels of district and wider neighbourhood gathered from the municipality of Amsterdam (O+S Amsterdam, Citation2015) have shaped the raw inputs. This study, nevertheless, is unable to encompass the entire possible scales of analysis simply because the available data at the neighbourhood level seems not to contain the requisite degree of detailed information on economic opportunities.
Walking along an exploratory and interpretative scope of analysis, furthermore, the study has utilised geographical information system (GIS) (Chrisman, Citation1999; Longley, Goodchild, Maguire, & Rhind, Citation2001) as its main analytical platform. Through a set of GIS-based methods of aggregating source data such as point-in-polygon, hotspots and kernel density estimation (KDE) (Chainey, Tompson, & Uhlig, Citation2008), as well as raster analysis, the collected multiscalar and multizonal data have been processed for finding, exploring, analysing, interpreting and visualising the possible relationships between SCBs and their contextual urban economy.
The findings of the paper suggests, unambiguously, that there is a positive spatial correlation between SCBs and their urban economic contexts, which highlights the contextual role of the cognitive-cultural economy in the concentration of new urban consumption spaces in Amsterdam. The outcomes of the GIS processes illustrate that in urban settings (both at district and wider neighbourhood scales) with higher cognitive-cultural economic opportunities, the number of identified and processed SCBs seems to be higher than other areas. Additionally, the findings attempt to demonstrate how the scale of the analysis can affect the resultant outcomes and interpretations. In other words, as SCBs mostly function at the local scale, smaller scale analyses would represent a clearer understanding of their locational strategies.
Overall, this research sheds new light on the interconnectedness of the new urban economy and new urban consumption spaces. It not only provides an exciting opportunity to visualise this intimate relationship but also spatially supports the growing literature on gentrification and the new urban middle classes. The applied methodology, moreover, makes a contribution to the capabilities of GIS in the field of urban studies. With this in mind, following a brief literature review on the new form of urban economy, the new urban middle classes, as well as the new urban consumption spaces, methodology and findings of the research will be discussed. Some new avenues for further investigations will be also opened up.
2. From the cognitive-cultural economy to specialty coffee bars
There seems to be a consensus amongst social scientists that with the decline of Fordist regime of economy, which had its roots in the mass, standardised, industrial production, in the mid to late 1970s in Western countries, a new economic system of service, technology, culture and creative activities has appeared in the deindustrialised nation-states. In the regime of “flexible accumulation” (Harvey, Citation1989), “post-Fordist” (Amin, Citation1994), “disorganised capitalism” (Lash and Urry, Citation1994) or “cognitive-cultural economy” (Scott, Citation2007) emphasis has been put on the intellectual and creative service sectors. This new economic order, based on Scott (Citation2014), heavily depends on the flexible, specialised and skilled urban labour as well as occupations that require significant levels of human capital. Occupational categories and knowledge-intensive economic sectors such as managers, professional workers, business and financial analysts, scientific researchers, technicians, skilled craftsworkers, designers and artists are of the top tiers of the new economy (Kloosterman, Citation2010; Scott, Citation2008).
On the other hand, Zukin (Citation2008) argues that alongside this economic restructuring, new middle classes (Burris, Citation1986), roughly equivalent to Florida’s (Citation2002) “creative class” or what Scott (Citation2012) has labelled “symbolic analysts”, with high levels of cognitive and cultural skills arrive in inner-cities, change the retail landscape of cities and contribute to a renaissance of interest in urban culture. Other scholars, additionally, have expressed that the changed economy has transformed Western cities from working-class-dominated spaces of industrial production to middle-class-dominated spaces of services and consumption (Boterman, Citation2012; Hall, Citation1998; Zukin, Citation1995; Zukin & Maguire, Citation2004). In other words, although cities are mostly command-and-control centres (Sassen, Citation1991, Citation1994) and, to a lesser degree, sites of manufacturing, their presence is now increasingly built around their utility as sites for consumption (Jayne, Citation2006; Latham, Citation2003).
This transformation, furthermore, is reflected in the appearance of a “new” and “polymorphous” form of public urban culture (Bridge & Dowling, Citation2001; Latham, Citation2003), which has been organised around a range of goods, services and their urban consumption spaces such as cafes, SCBs, craft beer bars, wine bars, fusion restaurants, artisanal bakeries, bookshops, music venues, art galleries, boutiques, vintage shops, hair, nail and beauty salons, travel agencies, ethnic caterings and ethnic therapies, as well as design and tailor shops. These arrays of amenities, which are shaping unique urban scenes (Silver, Citation2011; Silver & Clark, Citation2013, Citation2015; Silver, Clark, & Rothfield, Citation2007; Silver, Clark, & Yanez, Citation2010; Straw, Citation2001), have been argued broadly as signs of residential, as well as commercial gentrification (Atkinson & Bridge, Citation2005; Bridge & Dowling, Citation2001; Lees & Wyly, Citation2010; Zukin, Citation2010; Zukin & Kosta, Citation2004; Zukin, Kasinitz, & Chen, Citation2015), the expansion of the creative economy (Florida, Citation2002; Peck, Citation2005, Citation2012; Scott, Citation2012), the growth of the new middle classes (Butler, Citation1997), new (sub)cultures and lifestyles and the proliferation of urban public life (Bennett et al., Citation2009).
These amenity scenes have not only attracted recreational and cultural activates but also consist of the clusters of technology-intensive, service and cultural producers. As Scott (Citation2014) argues, these clusters are sites of productive labour in which know-how is accumulated, skills are honed and firms are worked out. The labours around these clusters are sources of creative energies as flexible workers rotate through different jobs and interact with one another in project-oriented teams. In this respect, the cultural and social spaces within the city, as well as local institutions, like schools and universities, are of major consequence. The creative labour (Florida, Citation2002) also needs specific spaces for their distinctive consumption preferences (Bourdieu, Citation1984, Citation1989), identity development and lifestyle maintenance (Cote, Citation1996; Escalas, Citation2013; Featherstone, Citation1987, Citation1991, Citation2007; Giddens, Citation1991; Howard, Citation2000; Le Roux, Rouanet, Savage, & Warde, Citation2008; Shields, Citation1992; Warde, Citation1994, Citation2002, Citation2005, Citation2014; Warde, Martens, & Olsen, Citation1999), group boundary preservation (Clarke, Doel, & Housiaux, Citation2003; Lamont & Molnar, Citation2002; McCracken, Citation1988) and the formation of social networks (Corrigan, Citation1997; Evans, Foxall, & Jamal, Citation2009; Lizardo, Citation2006; Peter & Olson, Citation2009).
By the same token, one of these small-scale amenities in the urban streetscapes, with considerable attention recently paid to it, is trendy espresso bars and specialty coffeehouses. They are mushrooming in almost all big cities across the globe and are becoming part of the contemporary urban living. They have distinguished themselves from traditional coffeehouses through providing high-quality coffees which derive from distinct processes of planting, harvesting, processing and washing, drying, milling, roasting, grinding and brewing (Specialty Coffee Association of America [SCAA], Citation2015). Furthermore, in the third wave of coffee experience, taste and flavours matter (Manzo, Citation2014).
Socio-economically, moreover, ever-shifting product variety, volatile, flexible outputs and targeting market niches (Glennie & Thrift, Citation1992; Jayne, Citation2006; Scott, Citation2012) have attracted consumers with high cultural capital (Bourdieu, Citation1984) who prefer natural, fresh goods as opposed to the emphasis on mass-market standardised products. They are mostly attracting young, well-educated, culturally aware urban dwellers, which ultimately result in a new form of urbanism. Regulars, based on several recent studies on this line, do not visit these urban spaces only for consumption; for them, coffeehouses are also providing a place for work, socialisation, relaxation and leisure (Bookman, Citation2013a, Citation2013b, Citation2014; Gelmers, Citation2015; Karsten, Kamphuis, & Remeijnse, Citation2015; Manzo, Citation2010, Citation2014, Citation2015; Martins, Citation2015; Rath & Gelmers, Citation2014; Shaker Ardekani, Citation2015a, Citation2015b, Citation2016; Woldoff, Lozzi, & Dilks, Citation2013). Providing high profile products which reflect a creative, artisanal, as well as aesthetic production and consumption (Charters, Citation2006), SCBs seem to be the local manifestation of sociocultural restructuring caused by the restructured economy.
The evidence presented in this section, generally, suggests that a large and growing body of literature has looked at the new urban consumption spaces, in general, and SCBs, in particular, through the lens of gentrification processes and the distinctive consumption practices of the new urban middle classes. However, the extent to which the distribution of SCBs across urban settings and their concentration in specific urban areas would be related to the economic arrangement of their geographical context seems to be less studied. In this regard, in the following section, this paper attempts, via the use of GIS, to spatially analyse the relationship between SCBs and their locational economic strategies.
3. Data, methods and approach
Urban analysis has always had an intricate spatial component. In the past 25 years, the role and potential of GIS to support various forms of urban analysis have been widely accepted through a substantial body of quantitative as well as qualitative studies (McLafferty, Citation2002; Moore-Cherry, Crossa, & O’Donnell, Citation2015; Paez & Scott, Citation2004; Pickles, Citation2006; Yin et al., Citation2013). Additionally, the increased availability of detailed geographic data on socio-economic activities combined with GIS capabilities has provided researchers with an unprecedented opportunity to study urban societies (Buliung & Kanaroglou, Citation2006). In this sense, one of the main applications of GIS is finding and studying the spatial patterns and spatial distributions of geographically related social phenomena.
In this respect, the study uses GIS as a method of spatial analysis (Knigge & Cope, Citation2006; Steinberg & Steinberg, Citation2006) and tries to explore and explain spatial patterns of SCBs, as geographically bounded urban entities, within the cognitive-cultural economy. However, in order to realise and represent the potential spatial correlations between SCBs and the new form of urban economy, two sets of data seem to be required: urban locations of SCBs within a city engaged in the cognitive-cultural economy, as well as the contextual economic arrangement with a certain degree of accuracy and detail.
Amsterdam, which seems to be a justifiable case, has been selected as a pathway case (Goertz & Mahoney, Citation2012) or a typical case, based on Gerring (Citation2006), for pursuing the research. Easy access to reliable, detailed data on economic opportunities at different urban scales has been the most important reason for choosing Amsterdam. Moreover, this is a city characterised by an economy that, at least partially, seems to fit the cognitive-cultural discourse. It has a vibrant urban setting with the wide ranging new urban consumption spaces and coffee-scene. The relative familiarity of the author with its urban context has also played a significant role for selecting the case and the population.
Data for this study have been gathered from two sources. A set of detailed socio-economic data (employment and business establishments) have been collected from the municipality of Amsterdam (O+S Amsterdam, Citation2015). The data includes two urban scales: the district level (Stadsdelen) and the wider neighbourhood level (Buurtcombinaties). Because the neighbourhood level (Buurten) does not contain the relevant data, it has been excluded from the study. This lack of micro-scale analysis pushes the analysis to be conducted to the district and, mainly, wider neighbourhood levels.
SCBs in Amsterdam have been identified based on an internet-based data collection. However, it should be noted that selecting SCBs as units of analysis that are vital for the analysis has been made carefully, as they are ultimately providing the results and findings from which conclusions need to be drawn. In this sense, an SCB could be either a commercial chain, or an independent coffeehouse. Therefore, the population consists of chain-based and independent SCBs in Amsterdam. In this respect, Coffeecompany, Starbucks and Bagels & Beans have shaped the chain-based coffeehouses. Finding appropriate independent SCBs, nevertheless, appeared to be, moderately, challenging. The author has consulted with blogs recommending “cool” coffeehouses in the city. Nonetheless, in order to make an exhaustive case selection, attempts were made to triangulate the suggested coffeehouses through other websites to avoid selecting biased coffee places, which easily affect not only the results of the analysis, but also how the results are interpreted. The overall blogs and websites can be found in the visualisations of the following section. However, in several cases, the researcher has also visited some of the uncertain SCBs in order to make sure that places within which specialty coffees are being brewed have been selected. Considering all the selection criteria, the population is 79 independent and 59 chain-based coffee bars for which their 6-digit postcodes have been extracted as the raw data for further processing.
Finding the urban location of the collected postcodes on the GIS map of the city has been done via geocoding. However, as the outcome is point data, for the spatial pattern recognition and aggregation, scales and zones are crucial (Schuurman, Bell, Dunn, & Oliver, Citation2007). Whilst scale is the geographical level at which any phenomenon of interest is experienced, observed and organised, zoning is defined as the spatial unit at which states and outcomes are represented or issues are analysed. In this light, multiscalar as well as multizonal analyses via GIS help to investigate the spatial patterns between SCBs and their urban context in terms of economic opportunities in Amsterdam in order to give the best possible answer to the research questions.
In this respect, the study uses the socio-economic data in the predefined areas in which the districts and wider neighbourhoods have been defined by the municipality of Amsterdam. This approach, nevertheless, produces different results based on the scale and zone of analysis which has been identified as the modifiable areal unit problem (MAUP) (Flowerdew, Citation2011; Openshaw, Citation1984; Schuurman et al., Citation2007). However, it has advantages in relation to the visualisation of geographical patterns and comparison (Pfeffer, Deurloo, & Veldhuizen, Citation2012) which would assist the author to find the spatial patterns in an easy-to-read fashion. However, in order to reduce the scale MAUP, some methods have been employed which revolve around aggregating source data, such as point-in-polygon as well as hotspots, raster maps and KDE (Chainey et al., Citation2008). KDE, in particular, has been employed more than other methods because it behaves independently from scale and calculates the density of points using a kernel function to fit a smoothly tapered surface to each point.
Additionally, for dealing with the zone MAUP which generates different outcomes at different zones, predefined areas have been aggregated and/or converted into raster zones based on the value of each sector in different economic opportunities. In this light, both employment and business establishments in different economic sectors have been classified into five different zones via the GIS raster conversion. However, it should be noted that more zones could make the analysis fragmented and, as a result, difficult to find patterns. On the other hand, fewer zones would be led towards an artificial concentration of SCBs and, consequently, inaccurate outcome. Moreover, in this approach, economic opportunities are denser in zones 4 and 5, which provide a unique opportunity for the interpretation of the spatial correlation. In other words, if the number of SCBs in the denser zones of each economic sector is higher than other economic zones of analysis, it could be argued that that economic sector has positive effects on the locational strategies of SCBs.
The final step of the study examines the relationships between SCBs and economic opportunities. via applying a holistic fashion and putting SCBs in a broader context, this stage brings the overall economic composition of each wider neighbourhood into account and attempts to establish links between the spatial concentration of SCBs in specific wider neighbourhoods and the dominant economic regime of that wider neighbourhood.
4. Analyses and findings
4.1. Spatial correlation at the district level
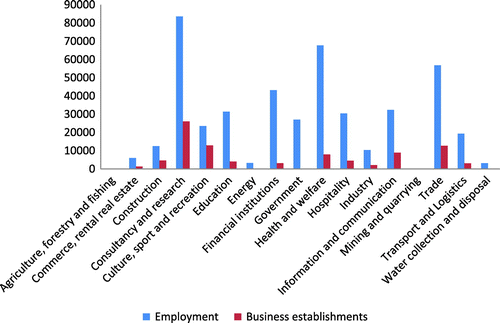
Even a cursory look at the statistical data on the economic sectors illustrated in Figure supports Scott’s (Citation2007, Citation2008, Citation2012, Citation2014) suggestion that Amsterdam is involved in the cognitive-cultural economy. As he explains, the heavy emphasis on the knowledge-intensive sectors and the cultural industries of the urban economy indicates that the city is working along the line of the new order of economy. In this sense, economic opportunities such as information and communication, consultancy and research, financial services, education, health, welfare and personal services, as well as culture, sport and recreation are of high interest.
Figure 1. The number of economic opportunities in Amsterdam in different sectors in 2014.
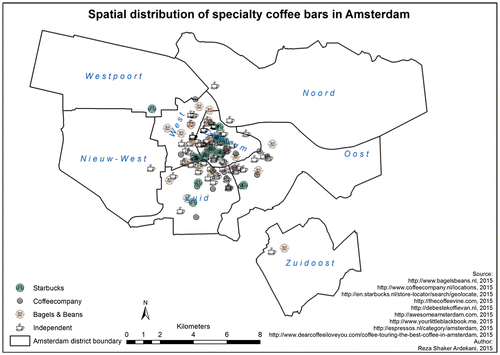
This paper, however, is concerned with the possible realisation and rationalisation of the links between spatial distribution and concentration of new urban consumption spaces, SCBs, in this case, and the cognitive-cultural economy in the urban context of Amsterdam. For doing so, postcodes of SCBs in Amsterdam (138 chain-based and independent ones), have been extracted from an Internet-based investigation and have been geocoded based on the Dutch 6-digit postcode provided by the statistical bureau of Amsterdam (O+S Amsterdam, Citation2015). However, the resultant map (Figure ) as a point-in-polygon method (Pfeffer et al., Citation2012) does not vividly represent the spatial concentration of SCBs.
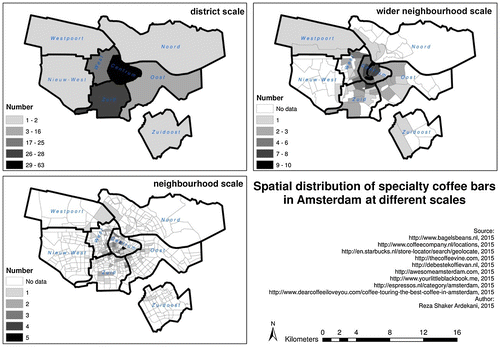
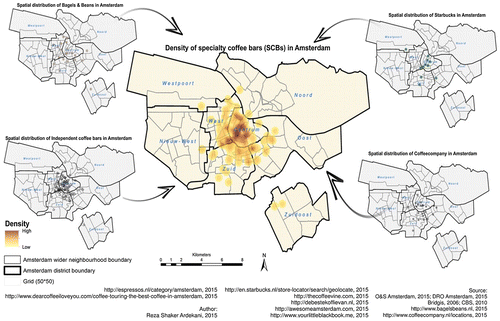
To compensate for this disadvantage, a popular way of mapping spatial concentrations using point data would be aggregating points into tabular data based on the spatial join method at different scales (Figure ). This approach, nonetheless, clarifies MAUP and clearly suggests that scale matters. However, the KDE function, which calculates density of point features using a kernel function, to some extent, solves the scale MAUP. In this light, by applying KDE and setting the search radius to 500 square metres, the density of the population has been calculated in a scale-unbounded manner. The result, which has been represented in Figure , shows the spatial concentration of SCBs in Amsterdam.
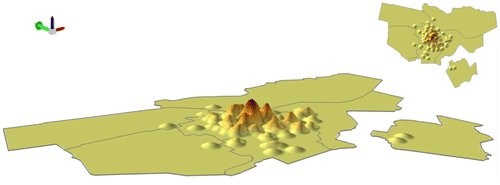
An enhanced realisation, furthermore, could be also illustrated in a 3D visualisation from the overall density of SCBs. via converting the raster layer of SCB density (Figure ) into a triangulated irregular network data-set, using the GIS 3D builder, i.e. ArcScene and adjusting the vertical exaggeration, Figure has been generated. This depiction clearly illustrates that certain parts of the city are having denser coffee-scenes. It could be argued that the concentration of SCBs in the inner-city areas might be, to some extent, related to the touristic/cultural nature of the area. Nevertheless, further analyses will add other dimensions into the rationalisation.
Joining the tabular data of the employment and business establishments with the GIS layers of Amsterdam would lead towards the generation of the zone MAUP. For dealing with the problem, via a set of raster analyses, each sector of the economic opportunities has been reclassified into five zones. This method not only reduces MAUP but also provides a distinct opportunity to scrutinise the spatial correlation between the number of SCBs and employment and firms in each reclassified economic zone at the district level. Figures and illustrate the outcomes of the method.Footnote1 It should, however, be noted that for the sake of saving space these visualisations do no show the spatial correlation of the entire economic sectors but simply emphasis on some selected representative segments of Fordist and the cognitive-cultural regimes of economy.
Figure 6. Spatial correlation between business establishments in different economic sectors and SCBs at district scale.
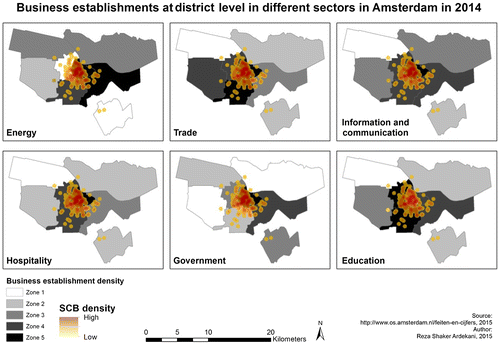
Figure 7. Spatial correlation between employment in different economic sectors and SCBs at district scale.
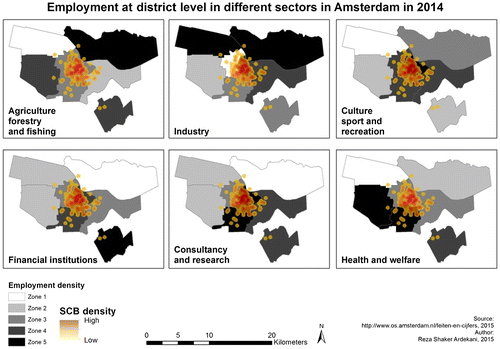
Another advantage of this method is that it calculates zones based on the density of the economic opportunities. Simply put, zones 4 and 5 have more firms and higher employment opportunities than other zones. In this regard, via overlaying the KDE layer of SCBs with the reclassified zones, the spatial relationship between the two has been highlighted. Differently put, the results of the presented figures clarify some links between concentration of SCBs and their locational economic arrangements. For instance, in specific zones the number of SCBs appears to be higher than other areas: as Table shows 85% of the population is located within business establishment sectors in information and communication; 66% in consultancy and research; 66% within employment sectors in culture, sport and recreation, as well as consultancy and research; and 46% in information and communication. What is interesting in this data is that these sectors are all related to the cognitive-cultural economy. As a result, it could be argued that the spatial distribution of SCBs within Amsterdam at the district scale distinctively has been connected with the new economic order.
Table 1. The number of SCBs in the top five sectors of business establishment and employment in zone 5 at district scale
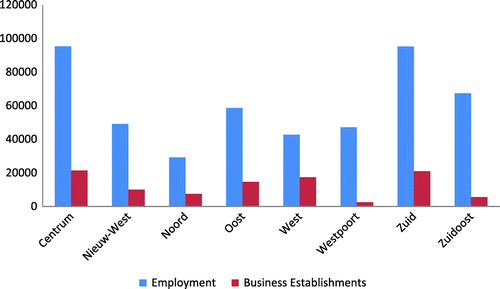
However, the analyses have some conflicting outcomes as well. For example, in Table in zone 5 of the industry sector, which is heavily related to the Fordist economy, the number of SCBs is more than sectors relevant to the cognitive-cultural economy. This may be related to the overall concentration of economic opportunities in specific districts. For instance, as Figure illustrates, “Centrum” and “Zuid” are districts with the highest portion of employment and business establishments in almost all economic sectors. In this regard, although the analyses at the district scale do provide some insights, it seems that a smaller scale approach at the wider neighbourhood level could paint a clearer picture of locational strategies related to the concentration of SCBs in specific areas of Amsterdam.
Figure 8. The number of economic opportunities in different districts of Amsterdam.
4.2. Spatial correlation at the wider neighbourhood level
Repeating the above-mentioned analyses at the wider neighbourhood scale with its reclassified economic zones reveals a stronger connection between geographical location of SCBs and the new economic regime. The outcomes (Figures and ) not only enhance the validity of the former analyses at the district scale but also solve the contradictions which come from the MAUP. For example, at this scale of the analysis, the economic opportunities which witness the highest number of SCBs, i.e. zone 5 in Table , include hospitality, finance, culture, sport and recreation, information and communication, consultancy and research, education, as well as health and welfare. What is interesting in this data is that the economic sectors which are highly in harmony with the cognitive-cultural economy possess the densest specialty coffee scenes.
Figure 9. Spatial correlation between different sectors of business establishment and SCBs at the wider neighbourhood scale.
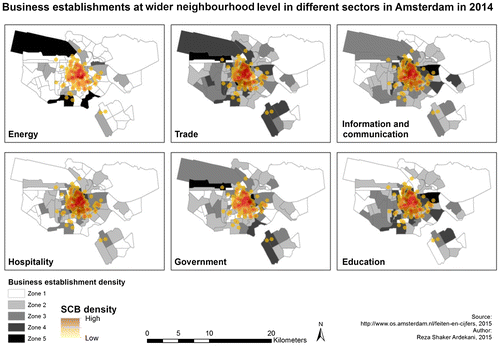
Figure 10. Spatial correlation between different sectors of employment and SCBs at the wider-neighbourhood scale.
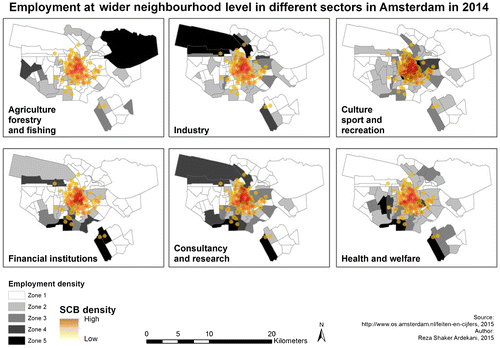
Table 2. The number of SCBs in the top five sectors of business establishment and employment in zones 4 and 5 at the wider neighbourhood scale
Although the number of SCBs in zone 5 at this scale of analysis seems not to be large enough to convey a strong argument, when supported from the economic sectors from zone 4, a meaningful relationship is exposed. These correlations as well as the statistical investigation resulting from the raster and spatial analyses obviously confirm that in wider neighbourhoods and zones with a higher number of the cognitive-cultural socio-economic sectors, SCBs are visibly present, which explains the connection between these new urban consumption spaces and the new form of economy.
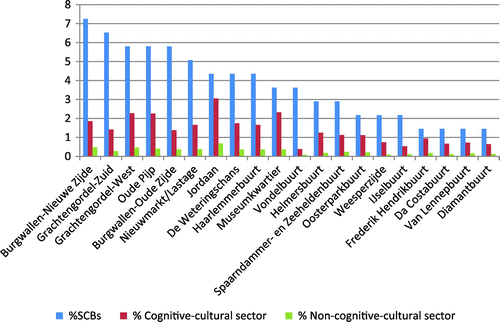
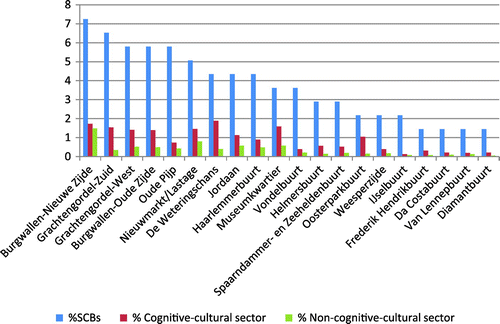
This approach, however, takes the individual economic sectors into account to explain the spatial correlation. Despite its ability for visualising meaningful connections, the study attempts to delve deeper through employing a holistic method in which the overall economic composition of each wider neighbourhood zone plays a major role and not just some of its sectors. In this respect, via the spatial-join aggregation of source data (Figure ), the number of SCBs within each wider neighbourhood zone has been extracted. The economic arrangement of each zone, in addition, has been reclassified into the cognitive-cultural and non-cognitive-cultural sectors. The former includes hospitality, information and communication, financial institutions, consultancy and research, education, health and welfare, as well as culture, sport and recreation, whilst the latter embraces the rest of the sectors. Finally, after calculating the proportion of each sector and sorting the top 20 wider neighbourhood zones with the highest number of SCBs, further complementing insights have been revealed.
As Figures and illustrate, a general tendency could be perceived from this holistic approach. Broadly speaking, wider neighbourhoods, such as Oude Pijp, Jordaan and Museumkwartier, with the denser specialty coffee scene tend to be engaged more than other wider neighbourhoods with the cognitive-cultural economy. The other way around, in areas such as Diamantbuurt, Van Lennepbuurt and Da Costabuurt with less engagement with the new economy the number of SCBs shrinks. By and large, taken this method as well as the aforementioned analyses into account, the results suggest that there is a relationship between the cognitive-cultural economy and the spatial concentration of SCBs. Interestingly, a clearer picture would be painted at smaller scales. The study, in this sense, clearly has illustrated that how the connection between SCBs and their urban socio-economic contexts at the wider-neighbourhood scale has appeared to be more accurate than at the district scale.
5. Discussion
As mentioned above, the study has focused on the possible illustrations of the relationships between SCBs and their urban contexts in Amsterdam via applying a set of GIS functions. Using density and raster analyses, the author has made some arguments on the cognitive-cultural economy in Amsterdam and urban spaces of specialty coffee consumption. In this regard, the main advantage of the approach would be solving the scale/zone MAUP. As geographers are aware of the effect of spatial scale on research results (Heywood, Cornelius, & Carver, Citation2011; Schuurman et al., Citation2007), pains were taken to overcome the MAUP to a certain extent. In this respect, the applied approach is a combination of aggregation methods such as join data of attribute tables based on spatial location, point/polygon to raster conversion, KDE and 3D visualisation.
Furthermore, a concentration mapping approach via the spatial join method in pre-defined zones, as a normally used method in aggregating source data, has been utilised, the outcome of which Figure illustrates. This approach obviously shows the areas in which SCBs are concentrated. This method could be useful for pursuing further analyses at smaller scales as well, and would be suitable for identifying potential neighbourhoods for further investigations. On the other hand, KDE provides opportunities to calculate, map and visualise the spatial density of SCBs in Amsterdam in a customised fashion. Furthermore, via providing a personal environment, it allows the analyst to investigate different scales. Although this approach seems to be closer to the reality, nevertheless, it increases the complexity of analysis.
In contrast, the followed approach has some shortcomings. The first limitation would be related to the geographical location of geocoded SCBs. As Pfeffer et al. (Citation2012) argue, the Dutch 6-digit postcodes contain about 10–20 households and do not represent the exact location and specific spot within the city. In this light, the setting of the SCBs seems problematic, which has a direct influence on the analyses and outcomes.
Additionally, there are some sensitivities in the methodology which need to be discussed. The first one concerns the particularity of the aggregation rules. In this study, the search radius for building KDE has been set to 500 square metres. Although based on Amsterdam, as a compact city, this search radius seems logical, tuning the radius would generate different outcomes and, as a result, different interpretations. Another methodological sensitivity would be the pursued raster analysis. By nature, vector to raster conversion reduces the accuracy of data (Carver & Brunsdon, Citation1994). The size of the raster cell can also create problems. For compensating the loss and undertaking the analyses in a proper fashion, the cell size should be set to a small degree. In the spatial investigation presented in this paper, for instance, the cell size has been set to 50 square metres, which, again, seems a justifiable size for Amsterdam as a compact city. Nevertheless, like search radius in KDE, trying different sizes for cells can generate different outcomes.
Classifying business establishments and employment sectors into different zones, as has been represented in Tables and , seems also to be also challenging. For example, in this study the entire zones have been reclassified based on “Natural Breaks (Jenks)” method. Needless to say that other classification methods such as “Equal Interval”, “Quantile”, “Geometric Interval” and/or “Standard Deviation” could generate different zones and, as a result, different outcomes. In addition to all the foregoing challenges with raster analysis, although the author has tried to depict an accurate picture of the socially constructed reality, in the 3D visualisation also the level of the vertical exaggeration could raise problems in terms of conveying an overstated image. Finally, as Pfeffer et al. (Citation2012, p. 334) argue, “the data should cover a certain level of detail, both in terms of thematic categories and spatial resolution”. In this regard, the analyses could have generated more accurate outcomes if data were available at the neighbourhood level, especially for business establishments and employment.
Last but not least, as it has been mentioned in the previous section, the process of raster analysis is a tiring, time-consuming, repetitive and sensitive one (the process has been repeated for 68 times in this study). In this sense, although the researcher has paid close attention to the accuracy of the process, using GIS automation (model building and/or ArcPy scripts) could not only save time in order to avoid a repetitive process but also reduces possible human errors.
Overall, the purpose of the discussion here is not to merely explain the advantages and challenges of the applied methodology, but also to raise awareness of the capabilities of GIS in the field of the urban studies. Furthermore, it invites attention to the sensitivities as well as complexities of this technology and the extent to which a simple change in methods, for example, the size of the raster cells and/or search radius in KDE used in this study, could alter the outcomes of the analysis. The contextual situations of the case study would also seem to be playing an important part and should be taken into consideration in order to adopt the best possible configuration amongst the many available options. By and large, researchers trying to follow the GIS-based methodology should possess a comprehensive appreciation of its capabilities, sensitivities and complexities.
6. Conclusion
It is a widely held view that urban scholars usually approach urban consumption spaces along the lines of gentrification processes and/or the sociology of new urban middle classes (Gammon & Elkington, Citation2015; Zukin, Citation2010; Zukin et al., Citation2015). The followed study, quite on the contrary, has taken neither the gentrification nor the new middle class debates into account; it has simply tried to look for the relationships between new consumption spaces and the dominant urban economy. In other words, the study was designed to determine the spatial correlations between SCBs and their contextual urban economy in order to unearth the hidden role of the cognitive-cultural economy in the concentration of new urban consumption spaces.
In this respect, via analysing the spatial concentration of urban spaces of specialty coffees in Amsterdam by means of GIS in multiscalar and multizonal methods, spatial associations between distribution of SCBs and business establishments and employment opportunities have been found, interpreted and visualised. Whilst this study has not confirmed any causations, its findings have substantiated a positive correlation and stressed that in areas with higher cognitive-cultural economic opportunities, the number of identified and processed SCBs tends to be higher than other urban areas.
This research, moreover, has several scholarly applications. Firstly, the current study adds to a growing body of literature on the sociology, geography and economy of consumption. Related to the first reason, the findings of this research could be used to spatially support and contribute to the current literature on the distinctive lifestyles and consumption patterns of the new middle classes in gentrified/ing neighbourhoods (Bennett et al., Citation2009; Lees & Wyly, Citation2010; Shove & Warde, Citation2002; Soron, Citation2010). By the same token, the unique applied method in this investigation would also excite the thoughts of the researchers in order to employ the GIS-based methodologies more in the study of the sociogeography of consumption.
The present study, however, reveals that scale matters and the connection between these urban consumption spaces and the new economic regime has appeared to be stronger and more distinct at smaller scales. In other words, at the wider neighbourhood level, the influence of the cognitive-cultural economy on the concentration of SCBs is noticeably more visible than at the district level. Nevertheless, a clearer image needs a closer look at the reality and appropriate data with a certain level of detail from the reliable data sources.
To compensate for the lack of data to bridge the gap between the macro-level research presented in this study and the micro-level research at the lowest possible scale, some further research work would be required. Also, the research has thrown up many questions in need of more investigation. Why have coffee bar owners decided to start their business within a particular neighbourhood? What would the main factors be? Who would their main customers be? Individuals who work close; people who live nearby; tourists who have their accommodation of places of interest near them; or people that just accidentally pass by? How would consumers navigate through the neighbourhoods to reach their preferred SCBs? In this sense, a focus on some carefully selected neighbourhoods (Figure ) in order to compare them with one another would provide some insights related to these questions. Furthermore, it would be interesting to compare some cities: would cities less engaged with the cognitive-cultural economy have fewer SCBs?
For doing so, additional methods such as surveys, observations, interviews and, in general, qualitative approaches (Boschmann & Cubbon, Citation2014; Cinderby, Citation2010) would be supportive techniques which may strengthen the research design. In this regard, in order to use some similar GIS-based methodologies (Cope & Elwood, Citation2009; Knigge & Cope, Citation2006; Kwan & Ding, Citation2008), further analyses at their smallest scales could benefit from grounded visualisation methods, 3D GIS-based time-geographic methods, as well as qualitative geographic information systems.
Funding
The author received no direct funding for this research.
Acknowledgements
The author would like to thank Karin Pfeffer and anonymous reviewers for their insightful comments on the earlier versions of this article. In addition, the author would like to thank Nathan Law for his generous suggestions.
Additional information
Funding
Notes on contributors
Reza Shaker Ardekani
Reza Shaker Ardekani is a research master in urban studies at the University of Amsterdam. He is interested in the sociology and geography of the new urban consumption spaces. Fascinated in the ubiquitous specialty coffee bars, he is investigating the human capital of the new urban middle classes in different urban settings and countries.
Notes
1. The raster analyses which have been repeated several times in this investigation include several steps as it follows: (1) the joint GIS layer with the municipal data has been converted into raster via Polygon-to-Raster function in GIS. The “value field” based on the purpose of the analysis would be selected amongst the economic sectors. The “cell assignment type” is “maximum area” in order to cover the largest area within the cell. (2) the point layer of SCBs has been converted into raster. (3) the final step would be “Zonal Statistics as Table” to identify the number of SCBs within each zone of analysis. This process has been accomplished for 68 times for the both district and wider neighbourhood scales and the outcomes are presented in Tables and .
References
- Amin, A. (Ed.). (1994). Post-fordism: A reader. Oxford: Blackwell.
- Atkinson, R., & Bridge, G. (Eds.). (2005). Gentrification in a global context: The new urban colonialism. London: Routledge.
- Bennett, T., Savage, M., Silva, E., Warde, A., Gayo-Cal, M., & Wright, D. (2009). Culture, class, distinction. London: Routledge.
- Bookman, S. (2013a). Branded cosmopolitanisms: ‘Global’ coffee brands and the co-creation of ‘cosmopolitan cool’. Cultural Sociology, 7, 56–72.10.1177/1749975512453544
- Bookman, S. (2013b). Coffee brands, class and culture in a Canadian city. European Journal of Cultural Studies, 16, 405–423.10.1177/1367549413484298
- Bookman, S. (2014). Brands and urban life: Specialty coffee, consumers, and the co-creation of urban cafe sociality. Space and Culture, 17, 85–99.10.1177/1206331213493853
- Boschmann, E. E., & Cubbon, E. (2014). Sketch maps and qualitative GIS: Using cartographies of individual spatial narratives in geographic research. The Professional Geographer, 66, 236–248.10.1080/00330124.2013.781490
- Boterman, W. R. (2012). Residential mobility of urban middle classes in the field of parenthood. Environment and Planning A, 44, 2397–2412.10.1068/a44558
- Bourdieu, P. (1984). Distinction: A social critique of the judgment of taste. London: Routledge.
- Bourdieu, P. (1989). Social space and symbolic power. Sociological Theory, 7, 14–25.10.2307/202060
- Bridge, G., & Dowling, R. (2001). Microgeographies of retailing and gentrification. Australian Geographer, 32, 93–107.10.1080/00049180020036259
- Buliung, R., & Kanaroglou, P. (2006). A GIS toolkit for exploring geographies of household activity/travel behavior. Journal of Transport Geography, 14, 35–51.10.1016/j.jtrangeo.2004.10.008
- Burris, V. (1986). The discovery of the new middle class. Theory and Society, 15, 317–349.
- Butler, T. (1997). Gentrification and the middle classes. Aldershot: Ashgate Publishing.
- Carver, S. J., & Brunsdon, C. F. (1994). Vector to raster conversion error and feature complexity: An empirical study using simulated data. International Journal of Geographical Information Systems, 8, 261–270.10.1080/02693799408901999
- Chainey, S., Tompson, L., & Uhlig, S. (2008). The utility of hotspot mapping for predicting spatial patterns of crime. Security Journal, 21, 4–28.10.1057/palgrave.sj.8350066
- Charters, S. (2006). Aesthetic products and aesthetic consumption: A review. Consumption. Markets and Culture, 9, 235–255.10.1080/10253860600772255
- Chrisman, N. R. (1999). What does ‘GIS’ mean? Transactions in GIS, 3, 175–186.10.1111/1467-9671.00014
- Cinderby, S. (2010). How to reach the ‘hard-to-reach’: The development of participatory geographic information systems (P-GIS) for inclusive urban design in UK cities. Area, 42, 239–251.10.1111/area.2010.42.issue-2
- Clarke, D. B., Doel, M. A., & Housiaux, K. M. L. (Eds.). (2003). The consumption reader. London: Routledge.
- Cope, M., & Elwood, S. (Eds.). (2009). Qualitative GIS: A mixed methods approach. London: Sage.
- Corrigan, P. (1997). The sociology of consumption: An introduction. London: Sage.
- Côté, J. E. (1996). Sociological perspectives on identity formation: The culture-identity link and identity capital. Journal of Adolescence, 19, 417–428.10.1006/jado.1996.0040
- Escalas, J. (2013). Self-identity and consumer behavior. Journal of Consumer Research, 39, xv–xviii.10.1086/669165
- Evans, M. M., Foxall, G., & Jamal, A. (2009). Consumer behaviour. Chichester: Wiley.
- Fava, S. F. (1956). Suburbanism as a way of life. American Sociological Review, 21, 34–37.10.2307/2089337
- Featherstone, M. (1987). Lifestyle and consumer culture. Theory, Culture & Society, 4, 55–70.
- Featherstone, M. (1991). The body in consumer culture. In M. Featherstone, M. Hepworth, & B. Turner (Eds.), The body: Social process and cultural theory (pp. 170–196). London: Sage.10.4135/9781446280546
- Featherstone, M. (2007). Consumer culture and postmodernism. London: Sage.
- Florida, R. L. (2002). The rise of the creative class: And how it’s transforming work, leisure, community and everyday life. London: Basic Books.
- Flowerdew, R. (2011). How serious is the modifiable areal unit problem for analysis of English census data? Population Trends, 145, 1–13.
- Gammon, S., & Elkington, S. (Eds.). (2015). Landscapes of leisure: Space, place and identities. London: Palgrave Macmillan.
- Gavin, D. (2013). Starbucks exceptionalism: An institutional ethnographic exploration of coffee culture in America. Journal of Psychological Issues in Organizational Culture, 4, 44–58.10.1002/jpoc.v4.3
- Gelmers, W. (2015). Specialty coffee bars: Are they to stay or to go? Retrieved from http://theprotocity.com/specialty-coffee-bars/
- Gerring, J. (2006). Case study research. Cambridge: Cambridge University Press.10.1017/CBO9780511803123
- Giddens, A. (1991). Modernity and self-identity: Self and society in the late modern age. Cambridge: Polity Press.
- Glennie, P., & Thrift, N. (1992). Modernity, urbanism, and modern consumption. Environment and Planning D: Society and Space, 10, 423–443.10.1068/d100423
- Goertz, G., & Mahoney, J. (2012). A tale of two cultures. Princeton, NJ: Princeton University Press.10.1515/9781400845446
- Gordon, I. (2004). The resurgent city: What, where, how and for whom? Planning Theory & Practice, 5, 371–379.
- Hall, T. (1998). Urban geography. London: Routledge.
- Harvey, D. (1989). The condition of postmodernity. Oxford: Blackwell.
- Heywood, D. I., Cornelius, S. C., & Carver, S. J. (2011). An introduction to geographical information systems. Harlow: Prentice Hall.
- Howard, J. A. (2000). Social psychology of identities. Annual Review of Sociology, 26, 367–393.10.1146/annurev.soc.26.1.367
- Jayne, M. (2006). Cities and consumption. London: Routledge.10.4324/9780203358733
- Karsten, L., Kamphuis, A., & Remeijnse, C. (2015). ‘Time-out’ with the family: The shaping of family leisure in the new urban consumption spaces of cafes, bars and restaurants. Leisure Studies, 34, 166–181.10.1080/02614367.2013.845241
- Kloosterman, R. C. (2010). This is not America: Embedding the cognitive-cultural urban economy. Geografiska Annaler: Series B, Human Geography, 92, 131–143.10.1111/geob.2010.92.issue-2
- Knigge, L., & Cope, M. (2006). Grounded visualization: Integrating the analysis of qualitative and quantitative data through grounded theory and visualization. Environment and Planning A, 38, 2021–2037.10.1068/a37327
- Kwan, M. P., & Ding, G. (2008). Geo-narrative: Extending geographic information systems for narrative analysis in qualitative and mixed-method research. The Professional Geographer, 60, 443–465.10.1080/00330120802211752
- Lamont, M., & Molnár, V. (2002). The study of boundaries in the social sciences. Annual Review of Sociology, 28, 167–195.10.1146/annurev.soc.28.110601.141107
- Lash, S., & Urry, J. (1994). Economies of signs and spaces. London: Sage.
- Latham, A. (2003). Urbanity, lifestyle and making sense of the new urban cultural economy: Notes from Auckland, New Zealand. Urban Studies, 40, 1699–1724.10.1080/0042098032000106564
- Le Roux, B., Rouanet, H., Savage, M., & Warde, A. (2008). Class and cultural division in the UK. Sociology, 42, 1049–1071.10.1177/0038038508096933
- Lees, L., & Wyly, E. K. (Eds.). (2010). The gentrification reader. London: Routledge.
- Lizardo, O. (2006). How cultural tastes shape personal networks. American Sociological Review, 71, 778–807.10.1177/000312240607100504
- Longley, P. A., Goodchild, M. F., Maguire, D. J., & Rhind, D. W. (2001). Geographic information system and Science. Chichester: Wiley.
- Manzo, J. (2010). Coffee, connoisseurship, and an ethnomethodologically-informed sociology of taste. Human Studies, 33, 141–155.10.1007/s10746-010-9159-4
- Manzo, J. (2014). Machines, people, and social interaction in “third-wave” coffeehouses. Journal of Arts and Humanities (JAH), 3(8), 1–12.
- Manzo, J. (2015). “Third-wave” coffeehouses as venues for sociality: On encounters between employees and customers. The Qualitative Report, 20, 746–761. Retrieved from http://www.nova.edu/ssss/QR/QR20/6/manzo2.pdf
- Martins, J. (2015). The extended workplace in a creative cluster: Exploring space(s) of digital work in silicon roundabout. Journal of Urban Design, 20, 125–145.10.1080/13574809.2014.972349
- McCracken, G. (1988). Culture and consumption, new approaches to the symbolic character of consumer goods and activities. Indianapolis, IN: Indiana University Press.
- McLafferty, S. L. (2002). Mapping women’s worlds: Knowledge, power and the bounds of GIS. Gender, Place & Culture, 9, 263–269.10.1080/0966369022000003879
- Moore-Cherry, N., Crossa, V., & O’Donnell, G. (2015). Investigating urban transformations: GIS, map-elicitation and the role of the state in regeneration. Urban Studies, 52, 2134–2150. doi:10.1177/0042098014545520
- O+S Amsterdam. (2015). Research, information and statistics: Facts and umbers. Amsterdam: Author.
- Openshaw, S. (1984). The modifiable areal unit problem. Norwich: GeoBooks.
- Paez, A., & Scott, D. M. (2004). Spatial statistics for urban analysis: A review of techniques with examples. Geo Journal, 61, 53–67.
- Peck, J. (2005). Struggling with the creative class. International Journal of Urban and Regional Research, 29, 740–770.10.1111/ijur.2005.29.issue-4
- Peck, J. (2012). Recreative city: Amsterdam, vehicular ideas and the adaptive spaces of creativity policy. International Journal of Urban and Regional Research, 36, 462–485.10.1111/ijur.2012.36.issue-3
- Peter, J. P., & Olson, J. (2009). Consumer behavior. New York, NY: McGraw-Hill Education.
- Pfeffer, K., Deurloo, M. C., & Veldhuizen, E. M. (2012). Visualising postcode data for urban analysis and planning: The Amsterdam city monitor. Area, 44, 326–335.10.1111/j.1475-4762.2012.01096.x
- Pickles, J. (2006). Ground truth 1995–2005. Transactions in GIS, 10, 763–772.10.1111/tgis.2006.10.issue-5
- Rath, J., & Gelmers, W. (2014). Coffee in the city. Retrieved from http://theprotocity.com/coffee-city
- Roseberry, W. (1996). The rise of yuppie coffees and the reimagination of class in the United States. American Anthropologist, 98, 762–775.10.1525/aa.1996.98.issue-4
- Sassen, S. (1991). The global city: New York, London, Tokyo. Princeton, NJ: Princeton University Press.
- Sassen, S. (1994). Cities in a world economy. London: Pine Forge Press.
- Schuurman, N., Bell, N., Dunn, J. R., & Oliver, L. (2007). Deprivation indices, population health and geography: An evaluation of the spatial effectiveness of indices at multiple scales. Journal of Urban Health, 84, 591–603.10.1007/s11524-007-9193-3
- Scott, A. J. (2007). Capitalism and urbanization in a new key? The cognitive-cultural dimension. Tabula Rasa, 6, 195–217.
- Scott, A. J. (2008). Social economy of the metropolis. Oxford: Oxford University Press.10.1093/acprof:oso/9780199549306.001.0001
- Scott, A. J. (2012). A world in emergence. Cheltenham: Edward Elgar Publishing.10.4337/9781781009314
- Scott, A. J. (2014). Beyond the creative city: Cognitive-cultural capitalism and the new urbanism. Regional Studies, 48, 565–578.10.1080/00343404.2014.891010
- Shaker Ardekani, R. (2015a, February 2). Polarised Tehran: Tea house vs. coffee shop. Retrieved from http://theprotocity.com/polarised-tehran-tea-house-vs-coffee-shop
- Shaker Ardekani, R. (2015b, September 21). Self, selfie, sex, cigarette as resistance in espresso city spaces. Retrieved from http://theprotocity.com/self-selfie-sex-cigarette-as-resistance-in-espresso-city-spaces
- Shaker Ardekani, R. (2016). Tracing musical tastes in Tehran: How urbanism selects its sound. Cogent Social Sciences, 2(1), 1132093. doi:10.1080/23311886.2015.1132093
- Shields, R. (Ed.). (1992). Lifestyle shopping: The subject of consumption. London: Routledge.
- Shove, E., & Warde, A. (2002). Inconspicuous consumption: The sociology of consumption, lifestyles and the environment. In R. E. Dunlop, F. H. Buttel, P. Dickens, & A. Gijswijt (Eds.), Sociological theory and the environment: Classical foundations, contemporary insights (pp. 230–251). New York, NY: Rowman & Littlefield.
- Silver, D. (2011). The American scenescape: Amenities, scenes and the qualities of local life. Cambridge Journal of Regions, Economy and Society, 5, 97–114.
- Silver, D., & Clark, T. N. (2013). Buzz as an urban resource. Canadian Journal of Sociology, 38(1), 1–32.
- Silver, D., & Clark, T. N. (2015). The power of scenes. Cultural Studies, 29, 425–449.10.1080/09502386.2014.937946
- Silver, D., Clark, T. N., & Rothfield, L. (2007). A theory of scenes. Manuscript. University of Chicago. Retrieved from http://tnc.research.googlepages.com/atheoryofscenes
- Silver, D., Clark, T. N., & Navarro Yanez, C. J. N. (2010). Scenes: Social context in an age of contingency. Social Forces, 88, 2293–2324.10.1353/sof.2010.0041
- Soron, D. (2010). Sustainability, self-identity and the sociology of consumption. Sustainable Development, 18, 172–181.10.1002/sd.v18:3
- Specialty Coffee Association of America. (2015). Retrieved from http://www.scaa.org
- Steinberg, S., & Steinberg, S. (2006). GIS geographic information systems for the social sciences, investigating space and place. London: Sage.
- Straw, W. (2001). Scenes and sensibilities. Public, 22–23, 245–257.
- Thompson, C. J., & Arsel, Z. (2004). The starbucks brandscape and consumers’ (anticorporate) experiences of glocalization. Journal of Consumer Research, 31, 631–642.10.1086/jcr.2004.31.issue-3
- Walks, A. (2013). Suburbanism as a way of life, slight return. Urban Studies, 50, 1471–1488. doi:10.1177/0042098012462610
- Warde, A. (1994). Consumption, identity-formation and uncertainty. Sociology, 28, 877–989.
- Warde, A. (2002). Changing conceptions of consumption. In A. Anderson, K. Meethan, & S. Miles (Eds.), The changing consumer (pp. 10–24). London: Routledge.
- Warde, A. (2005). Consumption and theories of practice. Journal of Consumer Culture, 5, 131–153.10.1177/1469540505053090
- Warde, A. (2014). After taste: Culture, consumption and theories of practice. Journal of Consumer Culture, 14, 279–303.10.1177/1469540514547828
- Warde, A., Martens, L., & Olsen, W. (1999). Consumption and the problem of variety: Cultural omnivorousness, social distinction and dining out. Sociology, 33, 105–127.10.1177/S0038038599000061
- Waxman, L. (2006). The coffee shop: Social and physical factors influencing place attachment. Journal of Interior Design, 31, 35–53.10.1111/joid.2006.31.issue-3
- Woldoff, R. A., Lozzi, D. M., & Dilks, L. M. (2013). The social transformation of coffee houses: The emergence of chain establishments and the private nature of usage. International Journal of Social Science Studies, 1, 205–218.
- Yin, L., Raja, S., Li, X., Lai, Y., Epstein, L., & Roemmich, J. (2013). Neighbourhood for playing: Using GPS, GIS and accelerometry to delineate areas within which youth are physically active. Urban Studies, 50, 2922–2939.10.1177/0042098013482510
- Zukin, S. (1995). The cultures of cities. Oxford: Blackwell.
- Zukin, S. (2008). Consuming authenticity. Cultural Studies, 22, 724–748.10.1080/09502380802245985
- Zukin, S. (2010). Naked city: The death and life of authentic urban places. Oxford: Oxford University Press.
- Zukin, S., & Kosta, E. (2004). Bourdieu off-broadway: Managing distinction on a shopping block in the east village. City & Community, 3, 101–114.
- Zukin, S., & Maguire, J. S. (2004). Consumers and consumption. Annual Review of Sociology, 30, 173–197.10.1146/annurev.soc.30.012703.110553
- Zukin, S., Trujillo, V., Frase, P., Jackson, D., Recuber, T., & Walker, A. (2009). New retail capital and neighborhood change: Boutiques and gentrification in New York city. City & Community, 8, 47–64.
- Zukin, S., Kasinitz, P., & Chen, X. (Eds.). (2015). Global cities, local streets: Everyday diversity from New York to Shanghai. London: Routledge.

