
 ?Mathematical formulae have been encoded as MathML and are displayed in this HTML version using MathJax in order to improve their display. Uncheck the box to turn MathJax off. This feature requires Javascript. Click on a formula to zoom.
Abstract
Amenities are recognized as an important factor for hospitality and tourism development. While previous studies have primarily focused on natural amenities, this research considers both natural and constructed amenities based on Clark’s amenity concept. This study explored how and which amenities were related to the spatial distribution patterns of hotels in the United States. Exploratory spatial statistical techniques were employed in this research. The findings suggest that hotels are not randomly distributed across the country. As the Moran’s I statistic demonstrates, hotels tend to be regionally clustered. While this study statistically confirms the importance of natural amenities in the spatial distribution patterns of hotels using bivariate local indicators of spatial association tests, it also reveals a stronger spatial relationship between constructed amenities and the spatial distribution patterns of US hotels compared with natural amenities.
Public Interest Statement
This study examines the distribution of hotels in the United States and the ways in which they tend to cluster. This research builds off the assumption that amenities, both natural and constructed, are among the crucial factors that relate to this distribution. This study employs spatial statistical analysis to examine the distribution patterns of hotel business and its possible associations with amenities using the US Standard Industrial Classification code for hotel industries as well as other public accessible secondary sources. The results show that the distribution patterns of US hotels are regionally clustered. Of the natural amenities and constructed amenities, constructed amenities are strongly related to the spatial distribution patterns. Based on these results, practical implications regarding hotel distribution patterns are discussed.
1. Introduction
While rural areas have been justly considered major tourism destinations due to their rich natural amenities (Christaller, Citation1964; Truchet, Callois, Aubert, & Piguet, Citation2011), recent urban development and regeneration trends have highlighted the importance of urban amenities (e.g. parks, waterfronts), particularly in the post-industrial cities of the US. These urban locations are enhanced as places to live and visit via local culture as it exists in its many forms and via the various urban amenities that contribute to the cultural landscape (Clark, Citation2011a). Indeed, the urbanity of tourism is implied in the many American cities that “have reconfigured themselves and are now better known as places of consumption than as places of production (e.g. Boston’s Faneuil Hall and Baltimore’s Inner Harbor)” (Debbage & Ioannides, Citation1998, p. 291). Accordingly, scholars of regional development, urban studies, economic geography, sociology, and tourism geographies have, in recent years, focused increasingly on the role of tourism in urban areas as a means of bolstering economic development (e.g. Beauregard, Citation1998; Clark, Citation2011a; Hoffman, Fainstein, & Judd, Citation2003). This perspective is due to the belief that “tourism is considered a significant contributor to a city’s prosperity and image” (Beauregard, Citation1998, p. 220) and because “tourists … can help the local economy” (Beauregard, Citation1998, p. 220). As a result, how amenities fit into the overall equation in regard to meeting or contributing to demand in and around both urban and rural areas is of central importance for hotel developers.
Amenities should be understood in the larger context of the tourism supply system, which is composed of attractions, transportation, services, information, and promotion (Gunn, Citation2002). Unfortunately, how tourism in urban areas relates spatially to various surrounding factors such as land use and environment has received scant attention (Li, Fang, Huang, & Goh, Citation2015). Thus, how the distribution of hotels as one part of the supply side of tourism relates to other parts of the supply side (such as natural and constructed amenities) is an area lacking in both description and explanation. One specific example of this lacuna is that little is known about how US hotels are spatially distributed between urban and rural areas and what such patterns might mean for developing comprehensive regional tourism development plans. Similarly, despite the obvious importance of understanding the hotel industry from a spatial perspective, tourism and hospitality scholars have paid little attention to hotel research on a national scale. Indeed, the only two notable studies (i.e. Roehl & Van Doren, Citation1990; Van Doren & Gustke, Citation1982) regarding the spatial distribution of hotels at the scale of the entire US are now over 20- and 30-years-old, respectively. This study, thus, provides an update to those previous projects, which remain a useful benchmark to assess the growth and development trend of US hotels during the last 30 years.
Recent advances in Geographical Information Systems (GIS) have facilitated more rigorous spatial analysis by utilizing spatial statistics, giving researchers access to more enhanced descriptions of spatial distribution (Wolman, Citation2004). Luo and Yang (Citation2013) first employed exploratory spatial statistics to examine the nationwide spatial distribution of hotels in China. However, their research was heavily-focused on establishing a methodological framework rather than engaging with related theories that might explain their results. Thus, the present research will complement the previous studies’ critics by applying Clark’s amenity theory along with using spatial statistics. The purpose of the present paper is twofold. The first task is to assess the spatial distribution of hotels in the US using exploratory spatial data analysis techniques. The second purpose is to examine the relationship between amenities and hotel distribution patterns.
2. Literature review
2.1. Spatial distribution of hotels
Analyses of the spatial patterns of tourism supply and demand as well as tourists’ spatial movements or flows have long been recognized as fundamental components of tourism geographical research (Pearce, Citation1979). While tourism scholars have explored the distribution of tourism industry activities through space and/or time, some critics have highlighted the neglect of theoretical advances regarding regional tourism development (Sharpley & Telfer, Citation2014).
Spatial distribution patterns of hotels have been examined by other researchers since Van Doren and Gustke (Citation1982). These studies can be divided into two spatial scales: national (e.g. Luo & Yang, Citation2013; Pearce & Grimmeau, Citation1985; Roehl & Van Doren, Citation1990; Rogerson, Citation2013; Sund, Citation2006; Van Doren & Gustke, Citation1982; Walford, Citation2001) and regional/city (e.g. Broadway, Citation1993; Sharma, Sneed, & Ravichandran, Citation2007; Shoval & Cohen-Hattab, Citation2001; Shoval, McKercher, Ng, & Birenboim, Citation2011; Truchet et al., Citation2011; Urtasun & Gutiérrez, Citation2006; Wall, Dudycha, & Hutchinson, Citation1985). Most past research has focused on intra-urban location rather than the inter-region location, which includes urban and rural areas, and generally has had very little focus on the role of amenities. Little research has also adopted spatial statistics in order to investigate the nature of the spatial distribution of hotels, excluding Luo and Yang’s study (Citation2013), who examined hotels in China using city-level data.
Van Doren and Gustke (Citation1982) pioneered spatial distribution pattern research at the national level with their work in the US, which spanned from 1963 to 1977. At that time, the Sunbelt states (i.e. central Florida, Las Vegas, Nevada, and Hawaii) were the major growth areas for the US hotel industry and the authors predicted that they would remain that way in the near future:
Continued lodging industry growth can be expected in the Sunbelt. Coastal growth may have reached the apex and future growth of the industry will take place in the interior of the country, particularly in the Mountain West and Appalachia. Nationwide continued growth will take place in small- to medium-sized cities. (Van Doren & Gustke, Citation1982, p. 561)
Roehl and Van Doren (Citation1990) later examined the locational characteristics of US resort hotels and confirmed the continued importance of coastal locations. They also noted the emerging importance of the cultural amenities of the city and identifying locations of hotels within population centers. Along with traditionally recognized, natural resource-based destinations, urban destinations emerged, such as Chicago, Dallas, and New Orleans, for serving the tourism and hotel businesses as well as meeting and convention markets.
In sum, these two studies identified useful insights to understand the spatial patterns of hotels across diverse spatial scales. However, these studies were not based on spatial statistical evidence and did not particularly engage in theories regarding the spatial aspects of hotel distributions. Yet Luo and Yang (Citation2013) later demonstrated the possibilities of such an exercise by showing that hotel clustering in Chinese cities is associated with areas boasting high levels of foreign investment and mature tourism development.
2.2. Amenity concept
In the middle to late part of the twentieth century traditional industrial cities in the US experienced economic decline associated with globalization and the outsourcing of manufacturing activities (Clark, Citation2011b). Cycles of disinvestment coupled with “white flight” served to hollow out many of these places leaving behind crumbling infrastructures and impoverished populations. The past several decades have seen many of these post-industrial cities experience a rebirth of sorts through various urban regeneration projects and the return of middle class residents. A corollary to this renewed growth and interest in cities has been an increase and reinvestment in the supply of urban amenities.
Amenities are mainly defined as “pleasant living conditions” (Ullman, Citation1954, p. 119). Ullman (Citation1954) addressed the importance of amenities for urban and regional development by suggesting that amenities “should be kept in mind in predicting future regional population and development” (p. 132). For this study, amenities are simply understood as conditions or resources that are potentially related to hotel locations in urban and rural areas.
The definition of amenities remains necessarily broad because the motivation for tourism with regard to natural and/or constructed amenities is highly variable, incorporating everything from parks, theaters, and museums to places with beautiful landscapes or favorable climates. Naturally, tourists’ visitation patterns are associated with the spatial distribution patterns of amenities (e.g. Marcouiller & Prey, Citation2005) and, because tourism demand is generally high around places with rich amenity resources, the hospitality industry has necessarily incorporated proximity to amenities when making locational decisions. However, tourism and hospitality scholars’ efforts at fully understanding the importance of amenities have been slow to emerge.
Until recently, most tourism and hospitality scholars have concentrated on amenities in rural rather than urban areas (e.g. Betz & Perdue, Citation1993; Kuentzel & Ramaswamy, Citation2005; Marcouiller, Kim, & Deller, Citation2004; Marcouiller & Prey, Citation2005; Truchet et al., Citation2011). Growing attention has been given to urban amenities, however, in other fields, such as urban sociology. For example, Clark (Citation2011b) explored urban spaces focusing on the role of amenities in city development and theorized that cities should be understood as entertainment machines rather than as growth machines conceptualized by Logan and Molotch (Citation2007).
Due to globalization and intense inter-local competition, cities and regions are increasingly required to be entrepreneurial in their quests to attract capital in order to reinforce and reinvigorate their positions (Peck, Theodore, & Brenner, Citation2009). In response, local governments often apply urban development practices that focus on developing amenities in order to attract consumption. For example, waterfront redevelopment projects aimed at repurposing older port spaces have proliferated around the world in recent years (Shaw, Citation2013). These types of spaces and other refurbished urban areas are now geared toward attracting tourists and providing attractive amenities to local residents.
Clark’s amenity concept describes that amenities can build local human capital by attracting creative people to a city or region. As cities act as loci of interactions, a clustering of talented people can conceivably lead to economic growth and population increase (Clark, Citation2011b; Clark, Lloyd, Wong, & Jain, Citation2002). As Clark (Citation2011b) noted, the growth machine in Chicago was built on amenities, especially Lake Michigan. Similar arguments have become influential in the past decade, particularly through Florida’s concept of the “creative class” and the need to attract human capital (Florida, Citation2003, Citation2004, Citation2005). Other work by Glaeser and his colleagues described increased human capital and consumer benefits resulting from city amenities (Glaeser, Citation2005; Glaeser & Gottlieb, Citation2006; Glaeser & Shapiro, Citation2003).
Regarding the definition of amenities, Clark (Citation2011b) outlined that amenity items include natural amenities, constructed amenities, socio-economic composition and diversity, and values and attitudes of residents. Of these diverse amenities, the focus of the present study is natural amenities and constructed amenities. Natural amenities indicate climate, humidity, temperature, water access, overall natural attractiveness, while constructed amenities include numbers of bigger institutions such as libraries, museums, bookstores, juice bars, Starbucks, etc.
Despite sharp critiques suggesting that these theories are too simplistic to explain urban growth and short-sighted in their prescriptions for attracting human capital and development (Peck, Citation2005; Storper & Scott, Citation2009), they still have influence in policy circles and, as such, require further examination. Thus, the present research seeks to examine any potential relationships between the presence of amenities in a destination area and that area’s ability to attract visitors and enhance tourism opportunities.
Little information exists as to whether the spatial distribution of hotels may be associated with the distribution of amenities on a national, rather than state or city scale. In addition, if amenities matter regarding hotel distribution patterns, then the question remains as to what types of amenities (i.e. either natural amenities or/and constructed amenities) affect the distribution patterns of hotels.
2.3. Agglomeration concept
Other spatial distribution theories are also worth considering in an examination of hotel distribution patterns in the United States. The spatial agglomeration of hotels has been one area of hospitality studies that has prompted attempts to study the tendency of hotels to cluster together (Adam & Mensah, Citation2014; Lee & Jang, Citation2015; Tsang & Yip, Citation2009; Yang, Luo, & Law, Citation2014). The agglomeration theory provides insights into the locational advantages that contribute to the clustering of hotels (Yang et al., Citation2014). Understanding how certain phenomena tend to cluster is essential for hospitality and tourism development planners. A common theme among these studies is that hotels tend to cluster due to perceptions by management that they will benefit from external economies of scale. In most cases, however, these studies focus on the location of hotels in relation to other hotels and in how individual hotel locational decisions are made. One notable exception was Yang, Wong, and Wang (Citation2012) who provided a useful step forward in analyzing hotel distribution in relation to public services and transportation networks. But the overriding question of why hotels cluster in a particular area in relation to amenities that contribute to touristic demand was typically not addressed in these studies. As a result, this study investigates whether hotel clusters are related to amenities by applying exploratory spatial statistics.
2.4. Research questions
Based on literature review, five research questions were developed as follows:
RQ1: Is the number of hotels spatially clustered?
RQ2: Is there a positive spatial relationship between the natural amenities and the clustered patterns of hotels?
RQ3: Is there a positive spatial relationship between the level of ruralization and the clustered patterns of hotels?
RQ4: Is there a positive spatial relationship between the higher constructed amenity level and the clustered patterns of hotels?
RQ5: Is there a positive spatial relationship between population density and the clustered patterns of hotels?
3. Methods
3.1. Data
The Standard Industrial Classification (SIC) code for Hotels and Motels (four digit SIC code 7011) from the United States Department of Labor was selected as a key variable to denote the number of hotels at the county-level. This study used the number of hotels as a key variable in each county to show the spatial cluster patterns of hotels and the correlation with the different types of amenities in the US. The data-set was transformed into a spatial data-set in order to conduct the exploratory spatial statistical analysis. However, it should be noted that this study only considered the number of hotels in each county, the size and type of the hotels were not included. While the SIC code had been applied in hotel research previously (e.g. Wang & Chung, Citation2015), transforming the data into spatial data sets is novel.
The natural amenity data and rural-urban continuum codes were obtained from the United States Department of Agriculture Economic Research Service (USDA ERS). Natural amenity data was available for counties in the 48 contiguous states, and included that environmental characteristics have not changed frequently. The six measures of warm winter, winter sun, temperate summer, low summer humidity, topographic variation, and water area were used to construct natural amenity measures using a composite score (https://www.ers.usda.gov/data-products/natural-amenities-scale/). As a result, the USDA natural amenity measure was applied as a proxy variable for Clark’s natural amenities.
Art/Entertainment/Recreation Business data were drawn from North American Industry Classification System (NAICS). NAICS 71 represents “the arts, entertainment, and recreation sector. Establishments in this category include those utilized in live performances, events, and exhibits, as well as places of historic, cultural and educational interest” (Liu, Debbage, & Blackburn, Citation2006, p. 333). NAICS 71 code already included information on the prosperity of the tourism industry. For example, the number of employees in Amusement parks and arcades (NAICS 7131), the number of employees in museums, historical site and similar institution (NAICS 7121), the number of employees in performing arts, sports, and similar events (NAICS 7113) and etc. NAICS 71 is used as a key indicator to access the market size of the leisure, recreation, and tourism industry (e.g. Baade & Matheson, Citation2004; Humphreys & Ruseski, Citation2009; Schumann, Citation2013). Chhetri, Corcoran, and Hall (Citation2008) also found positive relationships between the spatial patterns of tourism related industries and the role of the underlying geography of urban economic spaces in modeling tourism related employment. As a result, NAICS 71 was considered to represent Clark’s constructed amenities. The formula below shows the proportion of Art/Entertainment/Recreation employees in each county:
Rural-urban continuum codes were identified for metro counties (1–3) and non-metro counties (4–9). Counties in metro areas were classified by their population. Non-metro counties were coded by population and the degree of being adjacent to a metro area (http://www.ers.usda.gov/data-products/rural-urban-continuum-codes.aspx).
Specifically, for metro counties, 1 indicates counties in metro areas with a population of 1 million or more; 2 means counties in metro areas of 250,000 to 1 million population, and 3 represents counties in a metro area with fewer than 250,000 people. Regarding non-metro counties, 4 represents an urban population of 20,000 or more, adjacent to a metro area; 5 indicates urban population of 20,000 or more, not adjacent to a metro area; 6 represents an urban population of 2,500 to 19,999, adjacent to a metro area; 7 indicates urban population of 2,500 to 19,999, not adjacent to a metro area; 8 means completely rural or less than 2,500 urban population, adjacent to a metro area, and 9 represents completely rural or less than 2,500 urban population, not adjacent to a metro area. The classification structure was established to allow researchers to “analyze county data by finer residential groupings beyond strictly metropolitan and nonmetropolitan areas” (Reis et al., Citation2004, p. 2094).
Several different secondary datasets were deployed in a suitable spatial format to detect the relation between spatial patterns of hotels and its associated factors. Finally, population density data was included to account for agglomeration effects. The data were collected around the same time to maximize the reliability. Table describes key variables and associated factors as well as its data source.
Table 1. Key variables and their data sources
3.2. Analysis
A spatial cluster analysis (i.e. LISA) was employed to detect which areas showed clustered patterns based on the key variable (i.e. the number of hotels). A local bivariate Moran’s I was applied in order to examine the spatial relationship with its associated factors.
Geoda 1.8 was employed in order to compute the spatial and local bivariate correlations related to the hotel distributions. ArcMap10.4 was used to visualize the analysis results.
For the spatial dependency test, this study used permutations in order to improve the efficiency of the test and correct for potential bias in the estimated standard errors.
3.3. Findings
3.3.1. Spatial cluster analysis of hotel distribution
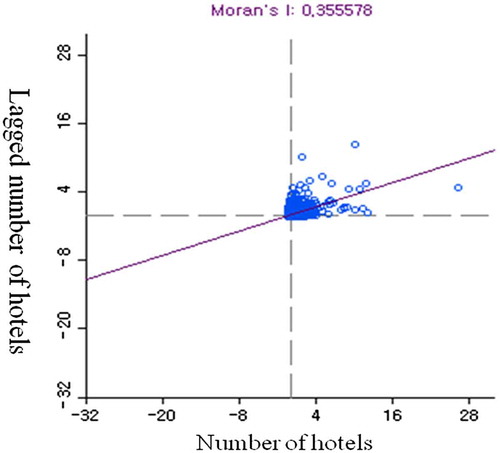
The global Moran’s I test demonstrated that the numbers of hotels in the US were spatially clustered (see Figure ). The global Moran’s I value for the number of hotels at the county-level was 0.355, which indicated a positive spatial autocorrelation in the study area. The resulting permutation distribution suggested a highly significant statistic. None of the simulated values was larger than the observed 0.355.
Figure 1. Global Moran’s I scatterplot of the number of hotels
The Moran’s I test revealed that the local indicator of spatial autocorrelation (LISA) could be used to identify the location and type of spatial clusters as well as be presented as a scatterplot map in order to illustrate the significance of the local spatial autocorrelation or clusters (see Figure ).
Figure 2. Local Moran’s I cluster map of the number of hotels
Specific information from Figure with regard to the regional distribution of hotel/lodging businesses in the larger states is provided in Table . One hundred-ninety counties located in such as California (32, 16.8%), Florida (23, 12.1%), and Texas (14, 7.4%) intensively showed High-High (HH) cluster patterns. HH means that one particular county and its adjacent counties had a larger number of hotels than the mean across the country.
Table 2. Regional distribution of hotel/lodging businesses in US states
Conversely, 565 counties located in such as Kansas (63, 11.2%) Nebraska (58, 10.4%), and Kentucky (51, 9.0%) showed Low-Low (LL) cluster patterns (see Table ). LL means that one particular county and its adjacent counties had smaller numbers of hotels below the mean. The results were significant at p < 0.05.
3.4. The local bivariate correlation analysis
3.4.1. Natural amenity and hotel distribution
The local bivariate correlation analysis showed a positive spatial relationship between natural amenity and the lagged number of hotels, Moran’s I = 0.245 (see Figure ). Specifically, 154 counties showed an HH relationship, meaning clusters of locations with high natural amenities and hotel locations, which were labeled as hotspots. The 154 counties included counties in California (28, 18.2%), Florida (26, 16.9%), and Texas (24, 15.6%) (see Figure ). As a result, one county had a higher natural amenity scale and its neighbor counties showed higher numbers of hotels at the county-level than the mean of the US.
Figure 3. The local bivariate correlation between natural amenities and the spatial lag of hotel distributions
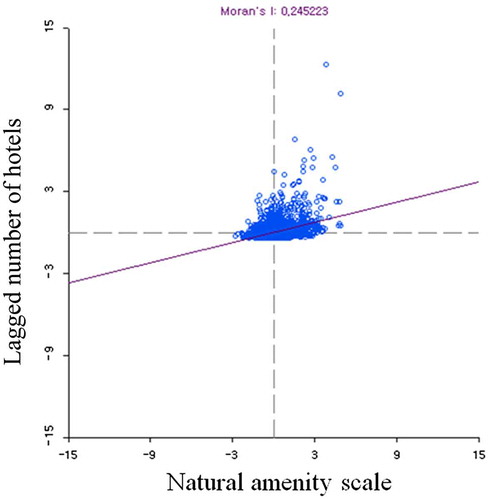
Figure 4. A BiLisa cluster map between the natural amenity scale and spatial lag of the number of hotels
Four hundred twenty-eight (428) counties showed an LL relationship, including counties in Kansas (56, 13.1%), Nebraska (53, 12.4%), and Iowa (35, 8.2%). The LL relationship indicated clusters of locations with low natural amenities and hotel concentrations. Thus, this result revealed that one county had a lower natural amenity scale and its neighboring counties showed a smaller number of hotels than the mean of the US.
3.4.2. Ruralization and hotel distribution
The local bivariate correlation analysis showed a negative spatial relationship between the level of ruralization and the lagged number of hotels, Moran’s I = −0.251 (see Figure ). Specifically, 22 counties showed an HH relationship and its distribution pattern included California (3, 13.6%), Colorado (2, 9.1%), and Florida (2, 9.1%). Sixty-six (66) counties showed an LL relationship, which included counties in Texas (7, 10.6%), Georgia (6, 9.1%), and Kentucky (5, 7.6%) (see Figure ).
Figure 5. The local bivariate correlation between the level of ruralization and spatial lag of hotel distribution
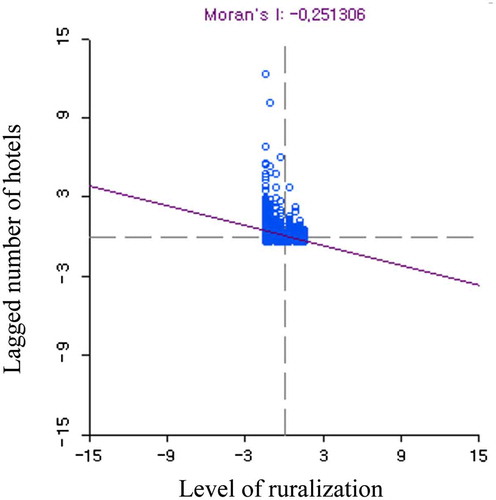
Figure 6. BiLisa Cluster map between the level of ruralization and spatial lag of the number of hotels
3.4.3. Constructed amenity and hotel distribution
The local bivariate correlation analysis showed a positive spatial relationship between the higher constructed amenity level and the lagged number of hotels, Moran’s I = 0.318 (see Figure ). Specifically, 160 counties showed HH relationships and their concentration included in California (27, 16.9%), Florida (23, 14.4%), and Texas (12, 7.5%). However, 586 counties showed LL relationships. Major states with these counties included in Kansas (63, 10.8%), Nebraska (60, 10.2%), and Kentucky (51, 8.7%) (see Figure ).
Figure 7. The local bivariate correlation between the constructed amenity scale and spatial lag of hotel distribution
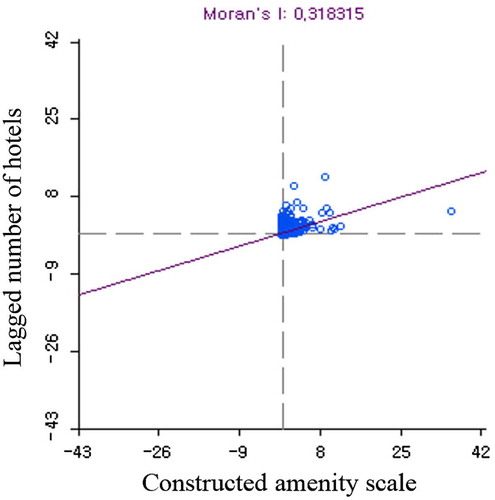
Figure 8. BiLisa cluster map between the constructed amenity scale and spatial lag of the number of hotels
3.4.4. Population density and hotel distribution
The local bivariate correlation analysis showed a positive but relative weak spatial relationship between population density and the lagged number of hotels, Moran’s I = 0.08 (see Figure ). Specifically, 111 counties showed an HH relationship, meaning clusters of locations with high population density and high hotel numbers, which were labeled as hotspots (HH). The 111 counties included counties in California (17, 15.3%), Florida (18, 16.2%), and New York (11, 9.91%) (see Figure ). As a result, one county had a higher population density and its neighbor counties showed higher numbers of hotels at the county-level than the mean of the US.
Figure 9. The local bivariate correlation between the population density and spatial lag of hotel distribution
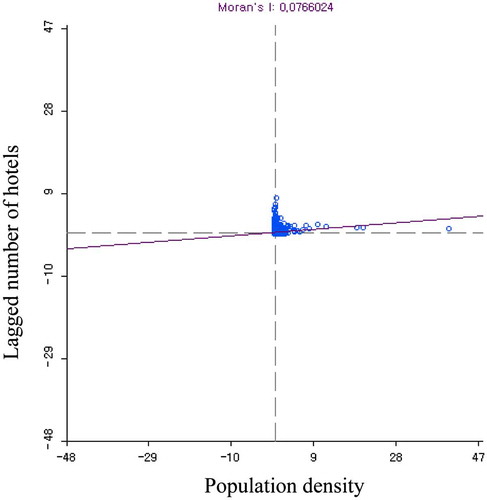
Figure 10. BiLisa cluster map between the population density and spatial lag of the number of hotels
One of the interesting findings from this analysis is that the Las Vegas areas showed LH relationship (e.g. lower population density and larger numbers of hotels). This means agglomeration effects not always positively affect the concentration of hotel industries. Overall, population density and hotel numbers showed weaker relationships compared to the constructed amenity scale and level of ruralization across the country.
4. Discussion
While amenities are recognized as a major consideration when selecting hotel locations within a functioning tourism system (Gunn, Citation2002), scholarly efforts in tourism and hospitality that examine the role of amenities for hotel locations remain rare. Building on Clark’s amenity concept, along with the agglomeration concept, this project examined which amenities, whether natural or constructed, were related to the spatial distribution of US hotels. The findings of this study revealed that hotels in the US remained regionally clustered and that constructed amenities in particular seem to have a strong relationship to hotel distribution patterns. This study also demonstrated the usefulness of a rigorous methodological approach that employed spatial statistics for examining the effects of amenity factors associated with the spatial distribution of hotels in the US.
As of 2014, there were 124,320 hotel/lodging businesses in the US according to the Standard Industrial Classification (SIC) code 71 (2014). Over a quarter of this stock of hotel/lodging businesses were found in three states: California, Texas, and Florida. Additionally, ten states (i.e. California, Texas, Florida, New York, Pennsylvania, Michigan, Georgia, North Carolina, Ohio, and Wisconsin) accounted for about 50% of the total supply in the US hotel/lodging industry. Thus, a sizeable spatial disparity in the distribution of hotels is apparent.
It is important to note that hotels are not randomly distributed across the country. As the Moran I statistic demonstrated, US hotels tend to be regionally clustered. These findings provide an update to the suggestions made by Van Doren and Gustke (Citation1982) and Roehl and Van Doren (Citation1990).
Specifically, the Sunbelt (i.e. California, Texas, and Florida) and the Mountain regions (i.e. Appalachian Highlands, including New York and North Carolina) have continually been major growth areas for the hotel industry (see Table ). In addition, coastal zones have continued to be areas of clustering. However, the clustering patterns of the US hotel industry also exist in interior states, such as Pennsylvania, Michigan, Georgia, Ohio, and Wisconsin.
More importantly, the study found underlying factors that could be related to the clustering patterns of hotels. By using Clark’s amenity concept, this study considered both natural and constructed amenities as they coexist rather than focusing on them in isolation.
Specifically, this research examined the relationships between natural and constructed amenities and the spatial distribution patterns of hotels. While the research statistically confirmed the relationship between natural amenities and the spatial distribution patterns of hotels, Moran’s I value = 0.245, this research found a stronger spatial relationship between constructed amenities and the spatial distribution patterns of the hotels, Moran’s I value = 0.318.
While natural amenities, such as climate, humidity, temperature, water access, and overall natural attractiveness, are continually important as tourist attractions, urbanized areas, where constructed amenities (e.g. arts, entertainment, and recreation establishments) are more likely to be located, are more likely to attract hotel occupants. While rural areas with attractive natural amenities will continue to draw tourists, the relationships to ruralization and natural amenities were found to be weaker, suggesting that tourists would not necessarily prefer to base themselves in rural areas for their accommodations when visiting rural sites.
One potential explanation is that many tourists might make day trips to rural areas to visit particular locations, but then return to their hotels located in urban areas. This reasoning would suggest that, while particular rural sites might be important, urban areas provide many more diverse options for services that tourists enjoy. Restaurants, shops, and even constructed parks could serve to facilitate tourists’ visitations in urban areas (Rosentraub & Joo, Citation2009).
Another potential interpretation is that tourists may desire a particular sense of place that urban areas provide (see Amsden, Stedman, & Luloff, Citation2011). This would certainly be variable from place to place, but it is important to consider in association with individual amenities. Certainly, this result suggests that the traditional core-periphery dichotomy (Christaller, Citation1964), placing tourists’ activities primarily in rural areas, could be clearly no longer valid.
Although the Office of Travel & Tourism Industries (Citation2012) has argued that “Rural America plays a particularly important role in the national tourism economy by attracting and retaining tourists for longer visits” (p. 7), the findings of this research have demonstrated the importance of constructed amenities in hotel locations. While this research does not clearly disregard the importance of natural amenities, this study reveals that constructed amenities have a stronger relationship with hotel distribution. This pattern might be further enhanced in post-industrial cities of the Rustbelt and in growing the Sunbelt cities where urban regeneration projects and newly developed infrastructure continues to shape the urban landscape. Changes in tourists’ demographic and socio-economic status might also be related to the growing importance of constructed amenities.
This project reconfirms and builds on Yang et al. (Citation2012)’s suggestion that hotel location modeling is practically valuable in providing suggestions and direction for urban planning and in allowing hoteliers’ stronger methods for making locational decisions. As such, local governments and destination marketing organizations may want to pay closer attention to their stock of constructed amenities (e.g. old buildings). For example, some of the post-industrial cities of the Midwest can now be seen as emerging tourism hotspots, and therefore it would be wise for those places to consider the possible cultural amenities that lay buried in their former heavy industry landscapes. Thus, some cities might decide to devote their marketing efforts to demonstrate that their well-preserved buildings or revitalized landscapes are constructed amenities for the hotel industry.
These findings provide meaningful insights for the hotel industry as well as for tourism research as a whole. While this paper clearly has implications for hotel locational analysis, it also suggests that hospitality and tourism professionals and academics should take a deeper look at the role of amenities in conceptualizing a larger framework for approaching tourism development. Since “the number of tourists entering the region (and so the number of hotels) depends on the global tourists’ perceptions of the regional level of amenities …” (Truchet et al., Citation2011, p. 16), destination marketing organizations (DMOs) might pay attention to constructed amenities when they conduct marketing efforts. Both natural and constructed amenities are critical for destination marketing and determining hotel locations. However, the findings might provide DMOs and the hotel industry with some clues for finding the best balance of how to target their investments between areas where natural amenities rich and constructed amenities rich. The findings may also suggest opportunities for brand diversification strategies of hotel locations.
5. Limitations
Different forms of tourism may yield different relationships to amenities. For example, business and leisure tourism demands would probably reflect different determinants and amenities. Eco-tourists or green tourists might prefer natural amenities, while urban tourists might likely visit urban heritage sites or constructed amenity resources, such as museums.
Each niche tourism market might demand amenity resources differently. This study particularly focused on supply side aspects, but demand side research, such as preference for or/and attitude toward natural and/or constructed amenities, may be important in regard to providing new insights for the hospitality and tourism industries. Case studies, surveying and interviews with tourists regarding their perceptions of amenities would be a useful means of developing the ideas presented here.
Finally, this study did not consider the type or size of the hotels in the study. A deeper foray into this topic might reveal different results if the type or size of the hotels could be incorporated. Spatially, there might be wide variations in the size of hotels between counties and, if so, understanding how the size of hotels affects the findings is potentially important.
This study suggests an important linkage in understanding hotel distribution by examining the spatial relationship between hotels and amenities in US. However, this study does not discount other possible explanations that might be working in concert to explain clustering or explain why constructed amenities have a strong relationship to hotel location. It is recommended that spatial regression analysis (e.g. SAR and SEM) could be applied to better examine diverse variables related to the clustered patterns of hotels.
Funding
The authors received no direct funding for this research.
Additional information
Notes on contributors
Kyung Hee Lee
Kyung Hee Lee is an Assistant Professor in the Department of Recreation, Park and Leisure services (RPL) at Central Michigan University. His research focuses on the urban and regional planning, geospatial analytics in tourism and recreation service provision and tourism demand modeling.
Sanghoon Kang
Sanghoon Kang is a Research Professor in the Tourism Research Institute at Kyonggi University, South Korea. His primary research areas are tourism planning and development. He is particularly interested in the applicability of geography principles and methods in the context of tourism and hospitality.
William C. Terry
William C. Terry is an economic geographer whose research primarily focuses on tourism supply side issues, particularly workforces.
Michael A. Schuett
Michael A. Schuett is an Associate Professor in the Department of Recreation, Park and Tourism Sciences (RPTS) at Texas A&M University. His research focuses on the planning and management of natural resources for recreation use.
References
- Adam, I. , & Mensah, E. A. (2014). Perceived spatial agglomeration effects and hotel location choice. Anatolia , 25 (1), 49–60.10.1080/13032917.2013.822818
- Amsden, B. , Stedman, R. C. , & Luloff, A. E. (2011). Exploring contexts of place: The role of setting and activity in a high-amenity tourism community. Tourism Geographies , 13 (4), 531–548.10.1080/14616688.2011.590518
- Baade, R. A. , & Matheson, V. A. (2004). The quest for the cup: Assessing the economic impact of the world cup. Regional Studies , 38 (4), 343–354.10.1080/03434002000213888
- Beauregard, R. A. (1998). Tourism and economic development policy in US urban areas. In D. Ioannides & K. G. Debbage (Eds.), The economic geography of the tourist industry: A supply-side analysis (pp. 220–234). London: Routledge.
- Betz, C. J. , & Perdue, R. R. (1993). The role of amenity resources in rural recreation and tourism development. Journal of Park and Recreation Administration , 11 (4), 15–29.
- Broadway, M. J. (1993). Montreal’s changing tourist landscape. Canadian Journal of Urban Research , 2 (1), 30–48.
- Chhetri, P. , Corcoran, J. , & Hall, C. M. (2008). Modelling the patterns and drivers of tourism related employment for South-East Queensland, Australia: A spatial econometric approach. Tourism Recreation Research , 33 (1), 25–38.10.1080/02508281.2008.11081287
- Christaller, W. (1964). Some considerations of tourism location in Europe: The peripheral regions-under-developed countries-recreation areas. Papers of the Regional Science Association , 12 (1), 95–105.10.1007/BF01941243
- Clark, T. N. (2011a). Introduction: Taking entertainment seriously. In T. N. Clark (Ed.), The city as an entertainment machine (pp. 1–13). Plymouth: Lexington Books.
- Clark, T. N. (2011b). Urban amenities: Lakes, opera, and juice bars – Do they drive development? In T. N. Clark (Ed.), The city as an entertainment machine (pp. 97–134). Plymouth: Lexington Books.
- Clark, T. N. , Lloyd, R. , Wong, K. K. , & Jain, P. (2002). Amenities drive urban growth. Journal of Urban Affairs , 24 (5), 493–515.10.1111/1467-9906.00134
- Debbage, K. G. , & Ioannides, D. (1998). Conclusion: The commodification of tourism. In D. Ioannides & K. G. Debbage (Eds.), The economic geography of the tourist industry: A supply-side analysis (pp. 287–292). London: Routledge.10.4324/9780203398425
- Florida, R. (2003). The rise of the creative class . New York, NY: Basic Books.
- Florida, R. (2004). Cities and the creative class . London: Routledge.
- Florida, R. (2005). The flight of the creative class . New York, NY: Harper Collins.
- Glaeser, E. L. (2005). Smart growth: Education, skilled workers and the future of cold-weather cities (Policy Brief PB-2005-1) . Cambridge, MA: Harvard University, Kennedy School.
- Glaeser, E. L. , & Gottlieb, J. D. (2006). Urban resurgence and the consumer city (Harvard Institute of Economic Research Discussion Paper 2109), Cambridge, MA.
- Glaeser, E. L. , & Shapiro, J. (2003). Urban growth in the 1990s: Is city living back? Journal of Regional Science , 43 , 139–165.10.1111/jors.2003.43.issue-1
- Gunn, C. A. (2002). Tourism planning (4th ed.). New York, NY: Taylor & Francis.
- Hoffman, L. M. , Fainstein, S. S. , & Judd, D. R. (2003). Cities and visitors: Regulating people, markets, and city space . Malden, MA: Blackwell Pub.10.1002/9780470773673
- Humphreys, B. R. , & Ruseski, J. E. (2009). Estimates of the dimensions of the sports market in the US. International Journal of Sport Finance , 4 (2), 94.
- Kuentzel, W. F. , & Ramaswamy, V. M. (2005). Tourism and amenity migration: A longitudinal analysis. Annals of Tourism Research , 32 (2), 419–438.10.1016/j.annals.2004.06.008
- Lee, S. K. , & Jang, S. (2015). Conditional agglomeration externalities in lodging markets. Journal of Hospitality & Tourism Research , 39 (4), 540–559.10.1177/1096348013491605
- Li, M. , Fang, L. , Huang, X. , & Goh, C. (2015). A spatial–temporal analysis of hotels in urban tourism destination. International Journal of Hospitality Management , 45 , 34–43.10.1016/j.ijhm.2014.11.005
- Liu, Z. J. , Debbage, K. , & Blackburn, B. (2006). Locational determinants of major US air passenger markets by metropolitan area. Journal of Air Transport Management , 12 (6), 331–341.10.1016/j.jairtraman.2006.08.001
- Logan, J. R. , & Molotch, H. L. (2007). Urban fortunes: The political economy of place . Berkeley, CA: University of California Press.
- Luo, H. , & Yang, Y. (2013). Spatial pattern of hotel distribution in China. Tourism and Hospitality Research , 13 (1), 3–15.10.1177/1467358413508579
- Marcouiller, D. W. , Kim, K.-K. , & Deller, S. C. (2004). Natural amenities, tourism and income distribution. Annals of Tourism Research , 31 (4), 1031–1050.10.1016/j.annals.2004.04.003
- Marcouiller, D. W. , & Prey, J. (2005). The tourism supply linkage: Recreational sites and their related natural amenities. The Journal of Regional Analysis & Policy , 35 (1), 23–32.
- Office of Travel & Tourism Industries . (2012). National travel & tourism strategy: Task force on travel & competitiveness . Retrieved from http://travel.trade.gov/pdf/national-travel-and-tourism-strategy.pdf
- Pearce, D. (1979). Towards a geography of tourism. Annals of Tourism Research , 6 (3), 245–272.10.1016/0160-7383(79)90101-4
- Pearce, D. , & Grimmeau, J.-P. (1985). The spatial structure of tourist accommodation and hotel demand in Spain. Geoforum , 16 (1), 37–50.10.1016/0016-7185(85)90005-3
- Peck, J. (2005). Struggling with the creative class. International Journal of Urban and Regional Research , 29 (4), 740–770.10.1111/ijur.2005.29.issue-4
- Peck, J. , Theodore, N. , & Brenner, N. (2009). Neoliberal urbanism: Models, moments, mutations. SAIS Review , 29 (1), 49–66.10.1353/sais.0.0028
- Reis, J. P. , Bowles, H. R. , Ainsworth, B. E. , Dubose, K. D. , Smith, S. , & Laditka, J. N. (2004). Nonoccupational physical activity by degree of urbanization and US geographic region. Medicine and Science in Sports and Exercise , 36 (12), 2093–2098.10.1249/01.MSS.0000147589.98744.85
- Roehl, W. S. , & Van Doren, C. S. (1990). Locational characteristics of American resort hotels. Journal of Cultural Geography , 11 (1), 71–83.10.1080/08873639009478438
- Rogerson, J. M. (2013). Reconfiguring South Africa’s hotel industry 1990-2010: Structure, segmentation, and spatial transformation. Applied Geography , 36 , 59–68.10.1016/j.apgeog.2012.06.004
- Rosentraub, M. S. , & Joo, M. (2009). Tourism and economic development: Which investments produce gains for regions? Tourism Management , 30 (5), 759–770.10.1016/j.tourman.2008.11.014
- Schumann, R. L., III . (2013). Recovering destination from devastation: Tourism, image, and economy along the hurricane coasts. Southeastern Geographer , 53 (2), 136–156.10.1353/sgo.2013.0010
- Sharma, A. , Sneed, J. , & Ravichandran, S. (2007). Spatial analysis of small hotel activity in Tanzania. International Journal of Contemporary Hospitality Management , 19 (7), 589–599.10.1108/09596110710818329
- Sharpley, R. , & Telfer, D. J. (Eds.). (2014). Tourism and development: Concepts and issues . Bristol: Channel View Publications.
- Shaw, K. (2013). Docklands dreamings: Illusions of Sustainability in the Melbourne docks redevelopment. Urban Studies , 50 (11), 2158–2177.10.1177/0042098013478237
- Shoval, N. , & Cohen-Hattab, K. (2001). Urban hotel development patterns in the face of political shifts. Annals of Tourism Research , 28 (4), 908–925.10.1016/S0160-7383(00)00083-9
- Shoval, N. , McKercher, B. , Ng, E. , & Birenboim, A. (2011). Hotel location and tourist activity in cities. Annals of Tourism Research , 38 (4), 1594–1612.10.1016/j.annals.2011.02.007
- Storper, M. , & Scott, A. J. (2009). Rethinking human capital, creativity and urban growth. Journal of Economic Geography , 9 (2), 147–167.
- Sund, K. J. (2006). The geographical concentration of hotels in Switzerland and the industry life cycle. Tourism and Hospitality Planning & Development , 3 (1), 1–18.10.1080/14790530600638788
- Truchet, S. , Callois, J.-M. , Aubert, F. , & Piguet, V. (2011). Amenities and locations of hotels: A micro-economic model and estimations. ERSA Conference Papers . European Regional Science Association. Retrieved from http://EconPapers.repec.org/RePEc:wiw:wiwrsa:ersa10p904
- Tsang, E. W. , & Yip, P. S. (2009). Competition, agglomeration, and performance of Beijing hotels. The Service Industries Journal , 29 (2), 155–171.10.1080/02642060802294896
- Ullman, E. L. (1954). Amenities as a factor in regional growth. Geographical Review , 44 (1), 119–132.10.2307/211789
- Urtasun, A. , & Gutiérrez, I. (2006). Hotel location in tourism cities. Annals of Tourism Research , 33 (2), 382–402.10.1016/j.annals.2005.12.008
- Van Doren, C. S. , & Gustke, L. D. (1982). Spatial analysis of the U.S. lodging industry, 1963-1977. Annals of Tourism Research , 9 , 543–563.10.1016/0160-7383(82)90072-X
- Walford, N. (2001). Patterns of development in tourist accommodation enterprises on farms in England and Wales. Applied Geography , 21 , 331–345.10.1016/S0143-6228(01)00010-8
- Wall, G. , Dudycha, D. , & Hutchinson, J. (1985). Point pattern analyses of accomodation in Toronto. Annals of Tourism Research , 12 (4), 603–618.10.1016/0160-7383(85)90080-5
- Wang, Y.-C. , & Chung, Y. (2015). Hotel brand portfolio strategy. International Journal of Contemporary Hospitality Management , 27 (4), 561–584.10.1108/IJCHM-01-2014-0031
- Wolman, M. G. (2004). The more things change. Annals of the Association of American Geographers , 94 (4), 723–728.
- Yang, Y. , Luo, H. , & Law, R. (2014). Theoretical, empirical, and operational models in hotel location research. International Journal of Hospitality Management , 36 , 209–220.10.1016/j.ijhm.2013.09.004
- Yang, Y. , Wong, K. K. , & Wang, T. (2012). How do hotels choose their location? Evidence from hotels in Beijing. International Journal of Hospitality Management , 31 (3), 675–685.10.1016/j.ijhm.2011.09.003