
 ?Mathematical formulae have been encoded as MathML and are displayed in this HTML version using MathJax in order to improve their display. Uncheck the box to turn MathJax off. This feature requires Javascript. Click on a formula to zoom.
Abstract
Malaria is a disease caused by the Plasmodium genus that is transmitted between humans by Anopheles mosquitoes. The study sought to assess the trends of Malaria incidence in Kumasi Metropolis and forecast future incidence. A retrospective comparative study design was employed using data from the Regional Health Directorate from January 2010 to December 2016. Trend of malaria prevalence was analysed and compared by years and months. Data used for the study was entirely secondary which was gathered from recorded monthly malaria cases at various hospitals in Kumasi. The Quadratic model was used for the forecasting of the half year incidence of Malaria while Auto regressive integrated moving average (ARIMA) (1, 1, 2) was used for forecasting monthly malaria incidence for the years 2018 and 2019 in Kumasi Metropolis. For the general pattern, July recorded the highest number of cases whereas January recorded the lowest cases in each year. Also, 2010 was the best performing year since it recorded the lowest number of malaria cases (10,336). The projected malaria cases for the first half year of 2018 is expected to be 61,371.8, while the second half year is expected to be 77,842.0. This model is recommended to the metropolitan health directorate and researchers who want to monitor the malaria reported cases in the metropolis and other parts of the world. It is suggested that measures should be put in place to curb malaria incidence during the period of the year when high incidence were recorded.
Public Interest Statement
Malaria is common in the tropical and subtropical areas of the world. Human infection starts from a blood meal of an infectious female mosquito. The parasites existing in the infectious mosquito’s saliva, enter the bloodstream of the human though mosquito bites and migrate to the liver. Malaria is endemic in African countries. This study sought to statistically analyse the malaria incidence in Kumasi metropolis in order to determine the trend pattern of malaria and project future incidence based on the trends. The study adopted the concept of time series analysis and used information on monthly malaria cases gathered from hospitals in Kumasi. The findings revealed that July records the highest number of Malaria cases. Moreover, it is expected that malaria cases in 2018 and 2019 will be lower than previous cases.
1. Introduction
Malaria is caused by the Plasmodium genus that is transmitted between humans by Anopheles mosquitoes (Thomas, Citation2014). P. falciparum and P. vivax are the most common species that cause malaria in humans. P. falciparum is the most dangerous because of the multi-drug resistance on this strain of the disease (Medical Research Council, Citation2001). A severe episode of cerebral malaria can result in epilepsy, cerebral palsy, or intellectual or physical disabilities (Davies & Eaton, Citation2018). These malaria victims are in the poorest, and sometimes most remote parts of the world, increasing the difficulty in finding support to cope with the disease (Davies & Eaton, Citation2018).
Malaria is both curable and preventable with medication therapy; however, a vaccine is not available. According to the World Health Organization, in 2012, there were approximately 207 million cases of malaria resulting in 627,000 deaths (World Health Organization, Citation2014). The overwhelming majority that is 90% of these cases occur in Africa (Medical Research Council, Citation2001). Most of the deaths occur in children. However, the rate of deaths in children has been reduced by 54% since 2000 (World Health Organization, Citation2014). The Countries with the most confirmed cases are in sub-Saharan Africa and India. Moreover, malaria contributed to 2.05% to the total global death in 2000 and was responsible for 9% of all death in Africa (WHO, Citation2003). WHO also estimated that the total cost of malaria in Africa was US$ 1.08 billion in 1995 and US$2 billion in 1997 (WHO, Citation1997). Malaria is therefore a massive problem which plagues all segments of the society. Malaria remains a major health challenge to mankind all over the world (World Health Organization, Citation2013). This is tied to the report that over three billion people in the world stand the risk of having malaria (World Health Organization, Citation2013). Despite local and international efforts towards the prevention of the disease, the rate at which people become sick and eventually die as a result of malaria is outrageous (Adebayo, Akinyemi, & Cadmus, Citation2015).
The future values of these variables are often predicted from their history. A time series analysis often does this and therefore this study was conducted to identify the trends of malaria cases in the Kumasi Metropolis over the period 2010 to 2016 using time series analysis and to forecast future incidence for 2018 and 2019. A good way of describing the incidence of malaria is important and it will go a long way to ensure proper planning and evaluation in the implementation of programs to monitor and control the disease, especially in endemic zones.
2. Methods
2.1. Study design
A retrospective comparative study design was employed using Malaria cases as reported by hospitals in the Ghanaian city of Kumasi from January 2010 to December 2016. Trend of malaria incidence was analysed and compared by years and months.
2.2. Malaria data
The nature of the data used in the analysis was secondary data gathered from records indicating monthly malaria cases. The secondary data of the reported malaria cases from January 2010 to December 2016 was obtained from the various hospitals in Kumasi for the analysis. The data included monthly number of malaria cases among the various age groups.
2.3. Statistical procedure
2.3.1. Auto regressive integrated moving average model
An Auto Regressive Integrated Moving Average (ARIMA) model was used and applied to Time Series Data of Malaria incidence in Kumasi. The model looks for temporal dependence between successive observations (Helfenstein, Citation1991). Due to the transmissibility and seasonality of malaria, models with an ARIMA structure have more predictive power compared to other methods (Nobre, Monteiro, Telles, & Williamson, Citation2001); such models have been applied to predict numerous infectious and non-infectious diseases with similar periodic patterns over the past decades (Luz, Mendes, Codeço, Struchiner, & Galvani, Citation2008; Ture & Kurt, Citation2006). Another advantage of the ARIMA approach is the relative simplicity and stability of the model in predicting malaria cases in a context where poor resources have led to lack of detailed data, which makes it difficult to calculate parameters needed for construction of more complex models of malaria (Pascual, Cazelles, Bouma, Chaves, & Koelle, Citation2008).
ARIMA models are in theory the best models for forecasting a time series. The procedure involves fitting an appropriate model, estimating the parameters and verifying the model. This model was used to forecast malaria incidence for the year 2018.
The monthly reported cases from January 2010 to December 2016 were fed into Minitab Spread sheet to generate the best trend fit, which was given by the quadratic model,
The seasonal indices (S.I) were obtained by dividing the actual values at time t by its respective trend forecast.
The quadratic trend model for the half year was given as
In order to choose the best model to forecast for the year 2018, an output of measure of accuracy to determine whether the use of ARIMA (1, 1, 1), ARIMA (1, 1, 2), ARIMA (0, 1, 1) or ARIMA (0, 1, 2) was appropriate for the monthly forecast of malaria in Kumasi for the years 2018 was performed and the results indicated that the ARIMA (1, 1, 2) was best fit for forecasting monthly malaria incidence for the year 2018. This was as a result of low values for the MAPE, MAD and MSE as shown in Tables and .
Table 1. Tentative ARIMA models and their corresponding normalized BIC and MAPE
Table 2. Measure of model accuracy
Therefore, the model selected for forecasting monthly incidence of Malaria in 2018 was ARIMA (1, 1, 2) because this model had the minimum normalized BIC of 15.085. The ARIMA (1, 1, 2) model also gives the best fit for forecasting monthly malaria incidence since it has the least MAD (1,351) and MSE(3,658,866) among all the models.
Considering the results, ARIMA (1, 1, 2) appeared fit for forecasting monthly malaria incidence for the year 2018 in Kumasi metropolis.
Hence the model for predicting future malaria incidence was
and the model obtained was;
where, μ is a constant, α, β is a parameter and is the Z t residual term.
Substituting the estimates of the parameters, we obtained(4)
(4)
2.3.2. Quadratic model
Also, in order to choose the best model for forecasting for the half year malaria incidence for 2018 and 2019, an output of measure of accuracy showing whether the use of Linear or Quadratic trend analysis was performed and the results have been summarized in Table .
Table 3. Measure of model accuracy
The Quadratic model appeared to be fit for the forecasting of half year malaria incidence. This was as a result of low values for the MAPE, MAD and MSE.
The quadratic trend model used for the forecast of half year malaria incidence was y t = 35,573 − 287t + 159t 2
The selection of the appropriate model also depended on the values of Normalized BIC and the ACF together with the PACF. The graphs of the ACF and PACF are shown in Figures and respectively. Four tentative models were examined and the model with the minimum Normalized BIC was chosen.
Figure 1. Residual plot of malaria cases
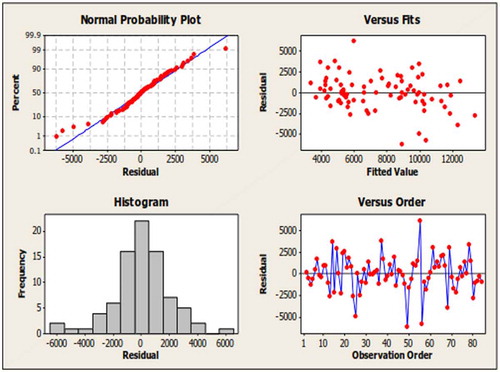
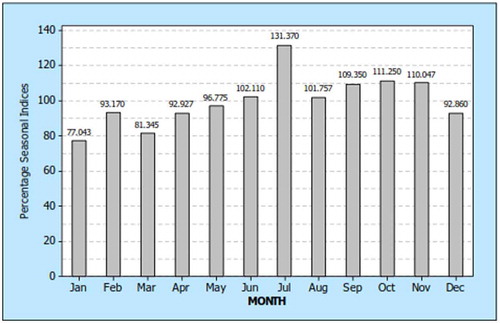
Figure 2. Seasonal indexes of malaria incidence in months
From the normal plot of residual, it was observed that the residuals did not deviate much from the straight line. This indicated that the errors were quite close to normal with no clear outliers. Thus, the normality assumption holds. The histogram of residuals confirmed this assumption. The plot of residuals vs. the fitted values exhibited no trend in dispersion. This indicated that the model satisfies the constant variance assumption. The plot of residuals vs. the order of the data suggested that the residuals were uncorrelated. This fact is supported by the Ljung Box statistics (Table ) which gives non-significant p-values. Thus the independent assumption is not violated. Once the assumptions hold the model can be seen as valid for prediction.
The final estimate of parameters for the model (Table ) shows that the AR (1) and MA (2) parameters have a p-value of 0.000, indicating a significant model parameter. The model converges after 25th iterations. The test statistic value of the constant is 13.31 and p-value is 0.000, indicating that the constant is significant at 5% and 10% level of significance.
Table 4. Parameters estimates of the model
Table shows the modified Box-Pierce (Ljung-Box) χ 2 statistic. It can be seen that all the lags have a p-value greater than the level of significant (0.05). This indicates non-significance implying that this model was appropriate.
Table 5. Modified box-pierce (Ljung-Box) χ 2 statistic
The statistical software used for the analysis was Minitab Version 16, SPSS Version 16 and Microsoft Excel 2013. The data for the analysis were grouped as Monthly malaria cases and Half year malaria Cases. The monthly reported cases from January 2010 to January 2016 were fed into a Minitab spread sheet and analyzed to obtain the descriptive statistics. That was followed by graphical and tabular exploration of yearly, monthly, and half year incidence of malaria and forecast of future incidence.
2.4. Ethical consideration
An introductory letter was sent to the various hospitals even though it was a retrospective study that made use of data which were monthly aggregates and anonymous counts of clinical cases gathered from the various hospitals in Kumasi.
3. Results
3.1. Descriptive statistics of monthly malaria cases
Table displays the Malaria Cases from 2010 to 2016 and from the table, the lowest average annual Malaria cases were recorded in 2014 with 14,866 cases while the highest were recorded in 2016 with 20,294 cases. However, the highest Malaria cases for the period were recorded in 2011 with 297,242 cases while the lowest were recorded in 2015 with 217,861 cases. From Table , the highest standard deviation is seen in the year 2011, which implies that, the reported cases in that year had the highest monthly variations whereas the lowest standard deviation was recorded in 2012 implying that the monthly reported cases did not vary significantly.
Table 6. Malaria cases from 2010 to 2016
3.2. Malaria incidence in months
The monthly analysis of malaria cases consisted of 84 months. That is, 12 month each for the 7 year period. The seasonal indices are obtained and shown in Figure . The seasonal indexes plot indicates that, malaria cases in June, July, August, September, October and November are above the average mark of 100%, Whiles those of January, February, March, April May, and December are below the average. The averages were adjusted so that those below 100% were below the monthly average and those above 100% were above the monthly average. Hence, from Figure , malaria incidence for July was 31.4% (131.37–100%) above the rate of incidence. January incidence on the other hand was 22.96% (100–77.043%) below the average. The same calculation can be done for all the other months. Thus July had the highest incidence of malaria whilst January had the lowest.
In general, the second half of the year records higher incidence of malaria than the first half.
3.3. Time series plot showing half year malaria incidence
The time series plot of the half year reported cases from January 2010 to January 2016 is shown in Figure . The plot shows that the time series was non-stationary.
Figure 3. Time series plot for half year malaria incidence
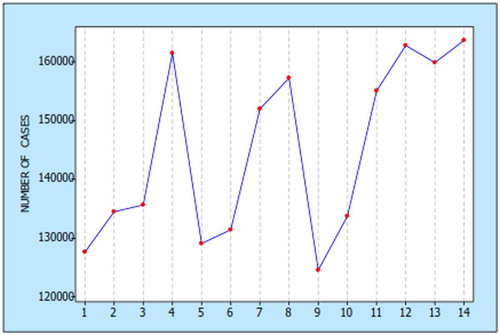
From Figure , the time series exhibit an increasing trend and seasonal variations implying that there has been an increment and seasonal fluctuation in malaria incidence for the half year.
The plot also showed that, there has been a consistent rise in malaria cases for the second half year over the first half year.
3.4. Half year malaria cases
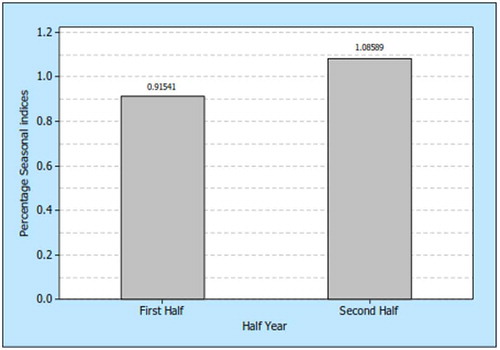
The half year analysis of malaria cases consisted of fourteen half years. That is, two half years for each of the years from 2010 to 2016. The seasonal indices were obtained and shown in Figure . The seasonal indices plot in Figure indicates that, malaria cases for first half year were below the average mark of 1 by 8.46% (1–0.91541), Whiles the second half year is above the average mark of 1 by 8.56% (1.08589–1). These indices suggest that Malaria cases fall below the average number in the first half of the year, whilst it rises above the average number in the second half of the year.
Figure 4. Malaria incidences for half year
3.5. Yearly malaria cases
The time series plot of the Yearly reported cases from 2010 to 2016 is shown in Table . The plot shows that the time series is cyclical.
Table 7. Time series plot showing yearly malaria cases
From Table , the time series plot describes the total number of malaria cases for the period under consideration (2010 to 2016). The series also exhibits an increasing trend.
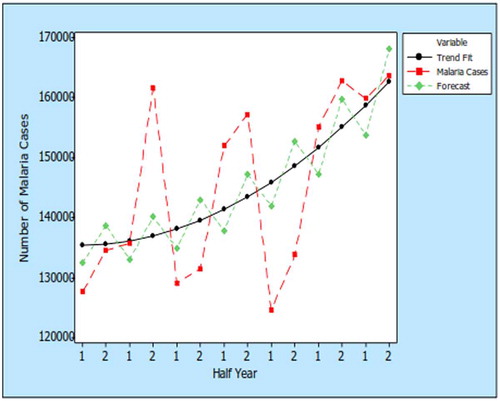
3.6. Quadratic trends and the fitted graph
The graph from Figure shows average half year trends of malaria cases in Kumasi and its future average forecast.
Figure 5. Quadratic trends and the fitted graph
3.7. Monthly forecast for the year 2018
Table gives the expected monthly forecast of malaria incidence using the model ARIMA (1, 1, 2). From Table , the forecast shows consistent but gradual increase in incidence from June to December, but a decrease from January to May.
Table 8. Expected malaria cases figures for 2018
3.8. Trend analysis for the half year malaria incidence for 2018 and 2019
A forecast for each half year for the next two years using the ARIMA (1, 1, 2) model is shown in Table . From the Table , the projected malaria cases for the first half of 2018 are expected to be 61,371.8 cases, while the second half of the year is expected to record 77,842.0 cases of Malaria. In the first half of 2019, it is expected that 70,161.6 cases of malaria will be recorded which will rise to 88,959.4 cases in the second half of the year. This suggests a general reduction of malaria cases from previous years.
Table 9. Trend and seasonal indices (S.I) forecast for 2018 and 2019
4. Discussion
For thousands of years, Malaria which is a caused by mosquitoes has afflicted humans.
Annually, between 700,000 to 2.7 million people die due to Malaria (Gagnon, Smoyer-Tomic, & Bush, Citation2002; Pattanayak, Corey, Sills, Kramer, & Myurray, Citation2003; Patz & Olson, Citation2006). The disease has been linked to rainfall as well as temperature by several authors (Anyamba, Chretien, Small, Tucker, & Linthicum, Citation2006; Barbieri & Soares-Filho, Citation2005; Campbell-Lendrum & Woodruff, Citation2006; Craig, Snow, & le Sueur, Citation1999; Gagnon et al., Citation2002; Guerra, Snow, & Hay, Citation2006; Hay et al., Citation2002; Jones, Wort, Morse, Hastings, & Gagnon, Citation2007; Mantilla, Oliveros, & Barnston, Citation2009; Massarani & Shanahan, Citation2006; Norris, Citation2004; Pascual, Ahumada, Chaves, Rodo, & Bouma, Citation2006; Pattanayak et al., Citation2003; Patz, Campbell-Lendrum, Holloway, & Foley, Citation2005; Poveda et al., Citation2001; Thomson et al., Citation2006; Vittor et al., Citation2006; Zhou, Minakawa, Githeko, & Yan, Citation2004). Time series analysis was adopted for this study to identify the trends in malaria cases in the Kumasi Metropolis over the period 2010 to 2016 and to forecast future incidence for 2018 and 2019. Time series methods were used for analysing the series data in order to extract meaningful statistics. Time series forecasting is the use of a model to predict future values based on previously observed values (Imdadullah, Citation2014).
Preliminary and further analysis conducted was based on Yearly, Half Year and Monthly Malaria cases. In all these cases, malaria cases have shown a continuously increasing trend. Previous studies of malaria incidence and incidence rates across different countries including Burundi in Africa have suggested the existence of high-frequency, also known as intrannual and seasonal or annual cycles (Gomez-Elipe, Otero, van Herp, & Aguirre-Jaime, Citation2007; Roca-Feltrer, Schellenberg, Smith, & Carneiro, Citation2009) and some of these have been associated with the influence of cyclic factors from either the mosquito/transmission patterns or natural environment, or both (Shumway, Citation1988). The yearly malaria cases recorded for this study was also cyclical, for instance, the year 2011 had a shoot up in cases over the year 2010 whilst the year 2012 had a decline over year 2011. This alternating incidence recorded yearly could be attributed to either the people not being meticulous about the diseases or the health care authorities have being inconsistent in the management of the disease. This study reported that the general pattern of the recorded malaria cases had variations in seasons. Thus, for monthly cases, July recorded the highest number of cases whilst January recorded the lowest number of cases. This may be as a result of the high incidence of rainfall in July which is generally the rainfall season in Ghana and the temperature associated with rainfall seasons. This supports Mabaso, Craig, Ross, and Smith (Citation2007) who revealed that rainfall seasonality as well as minimum temperature has being associated with the number of P. falciparum infective bites received by an individual during a season or annually. Previous research has shown that climate is also a key factor in explaining the incidence of malaria (Anyamba et al., Citation2006; Campbell-Lendrum & Woodruff, Citation2006; Craig et al., Citation1999; Gagnon et al., Citation2002; Hay et al., Citation2002; Jones et al., Citation2007; Mantilla et al., Citation2009; Pascual et al., Citation2006; Patz et al., Citation2005; Poveda et al., Citation2001; Thomson et al., Citation2006; Zhou et al., Citation2004). Other studies have concluded that temperature, precipitation, humidity, and atmospheric pressure may be linked to Malaria (Anyamba et al., Citation2006; Campbell-Lendrum & Woodruff, Citation2006; Craig et al., Citation1999; Gagnon et al., Citation2002; Hay et al., Citation2002; Jones et al., Citation2007; Mantilla et al., Citation2009; Pascual et al., Citation2006; Patz et al., Citation2005; Poveda et al., Citation2001; Thomson et al., Citation2006; Zhou et al., Citation2004). According to Thomson, Mason, Phindela, and Connor (Citation2005), Zhou et al. (Citation2004), Small, Goetz, and Hay (Citation2003) and Hay et al. (Citation2002), rainfall has an influence on the incidence of malaria because Mosquitoes require standing water in order to complete their life cycle. However, few studies found negative correlation between rainfall and malaria. Negative relationships between malaria and rainfall were found in studies conducted in Sri Lanka, the Amazon Basin, and Romania (Briët, Vounatsou, Gunawardena, Galappaththy, & Amerasinghe, Citation2008; Olson et al., Citation2009). This can be linked to the changing landscape of the region from forest to agriculture as claimed by Chaves, Cohen, Pascual, and Wilson (Citation2008), Guerra et al. (Citation2006), Massarani and Shanahan (Citation2006) and maybe topography as claimed by Olson et al. (Citation2009). According to Olson et al. (Citation2009), since these countries have relatively flat ground rainfall washes the breeding ground away so Mosquitoes are not able complete their life cycle.
For the half year results, there was a consistent rise in malaria cases in the second half of the year when compared to the first half of each year. This may be due to the climate conditions in the second half of the year when rains are usually frequent in the Metropolis and harmattan sets in getting to the end of the second half. This period is usually accustomed with extreme weather conditions. Pascual et al. (Citation2006) claims that increased temperatures can translate into a 30- 100% increase in mosquito abundance. This is supported by Patz and Olson (Citation2006) who claimed that increased temperatures also shorten the larval development, decreasing the amount of time needed for adult mosquitoes to spread malaria and allowing for the development of more mosquitoes The previous studies are in line with this study as seasonal indices analysis for malaria cases for first half year was below the average mark of 1 by 8.46% whiles the second half year was above the average mark of 1 by 8.56%. This implies that Malaria cases consistently rise in the second half of each year.
The time series model developed for predicting the number of monthly cases of malaria was ARIMA (1, 1, 2) while the Quadratic model was used for the forecasting of the half year incidence of Malaria. This implies that ARIMA (1, 1, 2) can be used as a forecasting model to project the future values of a series based entirely on its own inertia. ARIMA works best when data exhibits a stable or consistent pattern over time with a minimum amount of outliers (Labys, Citation2006). This model can be used by researchers for forecasting malaria reported cases (Nobre et al., Citation2001). However, it should be updated from time to time with the incorporation of current data.
5. Conclusion and recommendations
Based on the findings of the study, we make a number of conclusions and recommendations.
The general trend of both monthly and half year malaria cases follows an increasing quadratic trend and there is seasonality in both cases. For the general pattern, July recorded the highest number of cases whereas January recorded the lowest cases in each year and the second half of each year records higher number of malaria cases.
It was projected that Malaria cases for 2018 and 2019 will reduce when compared to previous years and therefore a projection for the first half of 2018 was 61,371.8 cases, while the second half cases will rise to 77,842.0. For the first half of 2019, it was projected that 70,161.6 cases of malaria will be recorded which is expected to rise to 88,959.4 cases in the second half of the year.
The ARIMA (1, 1, 2) model was used for forecasting the number of expected monthly cases of Malaria. The model was used to predict a twelve-month lead period of malaria cases for 2018. The Quadratic model was also used for the forecasting of expected half year incidence of Malaria cases for 2018 and 2019. This model is recommended to the metropolitan health directorate and researchers who would want to monitor the malaria reported cases in the metropolis and other parts of the world.
It is recommended that in some instances, indoor residual spraying should be applied to minimize environmental contamination. Indoor residual spraying is suggested for application prior to the rainy season to prevent and control epidemic outbreaks.
The use of Insecticide Treated Nets is also recommended especially in the rainy seasons when malaria cases increase.
Funding
The authors received no direct funding for this research.
Additional information
Notes on contributors
Reindolf Anokye
Reindolf Anokye is a Social Worker, Social entrepreneur and a Biostatistician. He read Social Work, Sociology and History at the University of Ghana and has recently completed a Master of Science degree programme in Disability, Rehabilitation and Development at the Department of Community Health, School of Medical Sciences, Kwame Nkrumah University of Science and Technology. Reindolf has worked as a Research Assistant at The Institute of Statistical, Social and Economic Research, University of Ghana, Legon (ISSER, UG) and has participated in surveys funded by UNICEF, Ghana AIDS Commission, MIDA, HFC Bank and St Louis University of Social Work. He has also worked as a Social Service Officer at the Domestic Violence and Victims Support Unit in Kumasi; Government Tutor and a Library Assistant at Garden City University College, Kenyase, Kumasi. The authors of this paper form a team of researchers who are interested in issues related to social inclusion, rehabilitation, public health and disability.
Related Research Data
References
- Adebayo, A. M. , Akinyemi, O. O. , & Cadmus, E. O. (2015). Knowledge of malaria prevention among women and female caregivers of under-five children in rural southwest Nigeria. Peer Journal , 3 , e792.10.7717/peerj.792
- Anyamba, A. , Chretien, J. P. , Small, J. , Tucker, C. J. , & Linthicum, K. J. (2006). Developing global climate anomalies suggest potential disease risks for 2006–2007. International Journal of Health Geographics , 5 (1), 60.10.1186/1476-072X-5-60
- Barbieri, A. F. , & Soares-Filho, B. S. (2005). Population and land use effects on malaria prevalence in the Southern Brazilian Amazon. Human Ecology , 33 (6), 847–874.10.1007/s10745-005-8213-8
- Briët, O. J. , Vounatsou, P. , Gunawardena, D. M. , Galappaththy, G. N. , & Amerasinghe, P. H. (2008). Temporal correlation between malaria and rainfall in Sri Lanka. Malaria Journal , 7 (1), 77.10.1186/1475-2875-7-77
- Campbell-Lendrum, D. , & Woodruff, R. (2006). Comparative risk assessment of the burden of disease from climate change. Environmental Health Perspectives , 114 (12), 1935.
- Chaves, L. F. , Cohen, J. M. , Pascual, M. , & Wilson, M. L. (2008). Social exclusion modifies climate and deforestation impacts on a vector-borne disease. PLoS Neglected Tropical Diseases , 2 (2), e176.10.1371/journal.pntd.0000176
- Craig, M. H. , Snow, R. W. , & le Sueur, D. (1999). A climate-based distribution model of malaria transmission in Sub-Saharan Africa. Parasitology Today , 15 (3), 105–111.10.1016/S0169-4758(99)01396-4
- Davies, M. , & Eaton, J. (2018). Malaria: Finding a preventive strategy that African countries can afford . The Guardian.
- Gagnon, A. S. , Smoyer-Tomic, K. E. , & Bush, A. B. (2002). The El Nino southern oscillation and malaria epidemics in South America. International Journal of Biometeorology , 46 (2), 81–89.10.1007/s00484-001-0119-6
- Gomez-Elipe, A. , Otero, A. , van Herp, M. , & Aguirre-Jaime, A. (2007). Forecasting malaria incidence based on monthly case reports and environmental factors in Karuzi, Burundi, 1997–2003. Malaria Journal , 6 (1), 129.10.1186/1475-2875-6-129
- Guerra, C. A. , Snow, R. W. , & Hay, S. I. (2006). A global assessment of closed forests, deforestation and malaria risk. Annals of Tropical Medicine and Parasitology , 100 (3), 189.10.1179/136485906X91512
- Hay, S. I. , Cox, J. , Rogers, D. J. , Randolph, S. E. , Stern, D. I. , Shanks, G. D. , … Snow, R. W. (2002). Climate change and the resurgence of malaria in the East African highlands. Nature , 415 (6874), 905.10.1038/415905a
- Helfenstein, U. (1991). The use of transfer function models, intervention analysis and related time series methods in epidemiology. International Journal of Epidemiology , 20 , 808–815.10.1093/ije/20.3.808
- Imdadullah, M. (2014). Time series analysis. Basic statistics and data analysis .
- Jones, A. E. , Wort, U. U. , Morse, A. P. , Hastings, I. M. , & Gagnon, A. S. (2007). Climate prediction of El Niño malaria epidemics in north-west Tanzania. Malaria Journal , 6 (1), 162.10.1186/1475-2875-6-162
- Labys, W. (2006). Modeling and forecasting primary commodity prices (pp. 51–68). England: Asghate.
- Luz, P. M. , Mendes, B. V. , Codeço, C. T. , Struchiner, C. J. , & Galvani, A. P. (2008). Time series analysis of dengue incidence in Rio de Janeiro. Brazil. The American Journal of Tropical Medicine and Hygiene , 79 , 933–939.
- Mabaso, M. L. , Craig, M. , Ross, A. , & Smith, T. (2007). Environmental predictors of the seasonality of malaria transmission in Africa: The challenge. The American Journal of Tropical Medicine and Hygiene , 76 (1), 33–38.
- Mantilla, G. , Oliveros, H. , & Barnston, A. G. (2009). The role of ENSO in understanding changes in Colombia’s annual malaria burden by region, 1960–2006. Malaria Journal , 8 (1), 6.10.1186/1475-2875-8-6
- Massarani, L. , & Shanahan, M. (2006). Amazon studies link malaria to deforestation. SciDev.Net . Retrieved December 6, 2009 from http://scidev.net/en/
- Medical Research Council . (2001). Malaria advice for southern Mozambique, Swaziland, and South Africa . Retrieved from http://www.malaria.org.za/Malaria_Risk/riskadv/General_Malaria_Info.pdf
- Nobre, F. F. , Monteiro, A. B. S. , Telles, P. R. , & Williamson, G. D. (2001). Dynamic linear model and SARIMA: A comparison of their forecasting performance in epidemiology. Statistics in Medicine , 20 (20), 3051–3069.10.1002/(ISSN)1097-0258
- Norris, D. E. (2004). Mosquito-borne diseases as a consequence of land use change. EcoHealth , 1 (1), 19–24.10.1007/s10393-004-0008-7
- Olson, S. H. , Gangnon, R. , Elguero, E. , Durieux, L. , Guégan, J. F. , Foley, J. A. , & Patz, J. A. (2009). Links between climate, malaria, and wetlands in the Amazon Basin. Emerging Infectious Diseases , 15 (4), 659.10.3201/eid1504.080822
- Pascual, M. , Ahumada, J. A. , Chaves, L. F. , Rodo, X. , & Bouma, M. (2006). Malaria resurgence in the East African highlands: temperature trends revisited. Proceedings of the National Academy of Sciences , 103 (15), 5829–5834.10.1073/pnas.0508929103
- Pascual, M. , Cazelles, B. , Bouma, M. J. , Chaves, L. F. , & Koelle, K. (2008). Shifting patterns: Malaria dynamics and rainfall variability in an African highland. Proceedings of the Royal Society B: Biological Sciences , 275 (1631), 123–132.10.1098/rspb.2007.1068
- Pattanayak, S. , Corey, G. C. , Sills, O. E. , Kramer, A. R. , & Myurray, C. B. (2003). Malaria, deforestation and poverty: A call for interdisciplinary policy science. RTI International’s Environment and Natural Resource Economics Working Paper , 3 (9).
- Patz, J. A. , Campbell-Lendrum, D. , Holloway, T. , & Foley, J. A. (2005). Impact of regional climate change on human health. Nature , 438 (7066), 310.10.1038/nature04188
- Patz, J. A. , & Olson, S. H. (2006). Malaria risk and temperature: Influences from global climate change and local land use practices. Proceedings of the National Academy of Sciences , 103 (15), 5635–5636.10.1073/pnas.0601493103
- Poveda, G. , Rojas, W. , Quiñones, M. L. , Vélez, I. D. , Mantilla, R. I. , Ruiz, D. , … Rua, G. L. (2001). Coupling between annual and ENSO timescales in the malaria-climate association in Colombia. Environmental Health Perspectives , 109 (5), 489.
- Roca-Feltrer, A. , Schellenberg, J. R. A. , Smith, L. , & Carneiro, I. (2009). A simple method for defining malaria seasonality. Malaria Journal , 8 (1), 276.10.1186/1475-2875-8-276
- Shumway, R. H. (1988). Applied statistical time series analysis . Englewood Cliffs, NJ: Prentice Hall.
- Small, J. , Goetz, S. J. , & Hay, S. I. (2003). Climatic suitability for malaria transmission in Africa, 1911–1995. Proceedings of the National Academy of Sciences , 100 (26), 15341–15345.10.1073/pnas.2236969100
- Thomas, L. O. (2014). A comprehensive review of malaria with an emphasis on plasmodium resistance (Diss.). University of Mississippi.
- Thomson, M. C. , Doblas-Reyes, F. J. , Mason, S. J. , Hagedorn, R. , Connor, S. J. , Phindela, T. , … Palmer, T. N. (2006). Malaria early warnings based on seasonal climate forecasts from multi-model ensembles. Nature , 439 (7076), 576.10.1038/nature04503
- Thomson, M. C. , Mason, S. J. , Phindela, T. , & Connor, S. J. (2005). Use of rainfall and seas surface temperature monitoring for malaria early warning in Botswana. American Journal of Tropical Medicine and Hygiene , 73 (1), 214–221.
- Ture, M. , & Kurt, I. (2006). Comparison of four different time series methods to forecast hepatitis A virus infection. Expert Systems with Applications , 31 (1), 41–46.10.1016/j.eswa.2005.09.002
- Vittor, A. Y. , Gilman, R. H. , Tielsch, J. , Glass, G. , Shields, T. I. M. , Lozano, W. S. , … Patz, J. A. (2006). The effect of deforestation on the human-biting rate of Anopheles darlingi, the primary vector of falciparum malaria in the Peruvian Amazon. The American journal of tropical medicine and hygiene , 74 (1), 3–11.
- World Health Organization . (1997). Application of the international classification of diseases to neurology: ICD-NA . World Health Organization.
- World Health Organization . (2003). WHO technical report series No. 892 . Geneva: WHO Expert Committee on Malaria.
- World Health Organization . (2013). Fact sheet on the world malaria report 2013 . Retrieved from http://www.who.int/malaria/media/world_malaria_report_2013/en/
- World Health Organization . (2014). Malaria [Internet]. Retrieved from http://www.who.int/mediacentre/factsheets/fs094/en/
- Zhou, G. , Minakawa, N. , Githeko, A. K. , & Yan, G. (2004). Association between climate variability and malaria epidemics in the East African highlands. Proceedings of the National Academy of Sciences of the United States of America , 101 (8), 2375–2380.10.1073/pnas.0308714100