
Abstract
Built environments have a profound effect on public health as they provide the background on which individuals make decisions to address their mobility, resulting in the adoption of varying degrees of physical activity. This is a logical adjunct to the natural environment that may or may not be conducive to physical activity (PA). Because microclimates influence the use of outdoor space, the built environment is crucial in creating conditions that are amenable for PA. A sample of 1359 participants declared activity levels during summer and winter over two years, via the International Physical Activity Questionnaire. The results, presented in this paper: a) estimate that 39% of all physical activity takes place outdoors, denoting dependence on indoor environments; b) test the measurement of PA in a standard, expedited way, allowing for seasonal monitoring; c) measure the seasonal difference between outdoor walking, thus quantifying the role of the weather. The study is the first on the topic in the Kingdom of Bahrain. It creates awareness for the relationship between built environment and public health, establishes directions and a foundation for future research, and baselines that may influence policymaking.
PUBLIC INTEREST STATEMENT
It is a common belief that the Middle East has a harsh climate and that, as a consequence, outdoors activities are limited. We argue that this is only the case for a small portion of the year and that the climate is otherwise pleasant. Furthermore, we document a high dependence on indoor environments. The local context suggests that this dependence could be inverted by planning, given the favorable climate. We propose that buildings could be able to accommodate walking for transportation needs for the warm part of the year. We add that, given the pleasant weather, mixed use development and a comprehensive pedestrian infrastructure could afford the population walking for transportation for the largest par of the year, thus diminishing the pressure on indoor environments, reducing the reliance on private transport, and increasing public health.
1. Background
Physical Activity and the Built Environment—A matter of Public Health
Endemic levels of physical inactivity throughout the developed world constitute a threat to the health of the general public. The emergence of sedentary lifestyles is a global trend (Boon, Hamlin, Steel, & Ross, Citation2010; Knuth, Bacchieri, Victora, & Hallal, Citation2009). Physical inactivity is a major risk factor associated with non-communicable diseases such as type 2 diabetes (Jeon, Lokken, Hu, & van Dam, Citation2007), breast and colon cancer (Friedenreich, Citation2010) and coronary heart disease (Sattelmair et al., Citation2011). Therefore, global inactivity levels are a threat to public health (Pate et al., Citation1995). Physical inactivity was estimated to be responsible for 5.3 million premature deaths worldwide in 2008 (I. M. Lee et al., Citation2013, Citation2012). Eliminating inactivity could eliminate between 6% and 10% of the incidence of the aforementioned major non-communicable diseases and increase life expectancy (I. M. Lee et al., Citation2012). As a consequence, the promotion of an active lifestyle has become an important concern in terms of public health. The World Health Organization (WHO) (Citation2013) has targeted a 10% reduction of the prevalence of physical inactivity (PA) in its 2013–2020 plan. The report includes an imperative to monitor PA (World Health Organization [WHO], Citation2013, p. 23), among other indicators.
The WHO recommends an absolute minimum of 150 min of moderate physical activity per week (WHO, Citation2013), which is equivalent to 600 metabolic equivalent of task (MET)-minutes/week, or 182 min of walking (average of 26 min per day) (MET is discussed below). The US Department of Health and Human Services (Citation2008) suggests twice as much exercise for Americans while highlighting that extra exercise can provide additional health benefits.
As referenced below, current evidence indicates that the built environment—as defined by Cairncross (Citation2016)—is as follows:
“The built environment encompasses the objective and perceived characteristics of the physical context in which people spend their time, including: The home, urban design, parks and amenities, crime and safety.
A well-designed built environment can enable older adults to carry out the activities of daily living and facilitate both physical and social activity. Equally, the built environment can create barriers and hazards which may deter or prevent older people from engaging actively at home or in their community.” is linked to health on three levels. First, the spatial distribution of land use may not afford sufficient opportunities for PA; second, urban design does not always provide safe and compelling environments to undertake PA; third, heavy reliance on private transportation increases the levels of air pollution generated by most motorized means of transportation.
Strategies to increase levels of PA generally imply an increase of the mode share of PA-based circulation. Such strategies might have limited scope in warm regions, where the weather may significantly limit the exertion of PA outdoors. This study measured, for the first time, the baseline levels of PA in the Kingdom of Bahrain exerted indoors and outdoors, considering its seasonal variability. Therefore, it accounted the role of the weather, which reveals an insight on the impact of the built environment itself, at the national level.
The tool used to measure the activity levels of the population was the International Physical Activity Questionnaire (IPAQ) (more below). According to IPAQ protocol, PA is classified into four intensity levels: 1) vigorous, such as fast cycling for training; 2) moderate, such as regular cycling for commuting; 3) walking; and 4) sitting. Particular focus is given to levels 2 and 3 as being where dependence on an environment to increase levels of PA can be significantly influenced.
1.1. Land use
The spatial distribution of land use is a known planning factor with major implications for health, as it affects travel behavior by altering the costs and convenience of each mode (M. Boarnet & R. Crane, Citation2001a; Cervero & Kockelman, Citation1997; Frank, Citation2004; Handy, Citation2005). Proximity between residence and jobs and services leads to more walking and cycling (Hanson & Schwab, Citation1987; Kockelman, Citation1997). The geographical separation between areas with different land use implies increased vehicle miles traveled (Marlon Boarnet & Randall Crane, Citation2001b; R. Ewing & Cervero, Citation2001; Holtzclaw, Clear, Dittmar, Goldstein, & Haas, Citation2002), which is associated with air pollution (Frank, Stone, & Bachman, Citation2000).
Destination prevalence and diversity represent measures of access and availability of services and, hence, are hypothesized to facilitate walking for transport (Van Cauwenberg et al., Citation2011).
1.2. Urban design
In addition to land use mix, other urban design features are related to PA. The presence of sidewalks forming a continuous network is associated with walking (Cervero & Kockelman, Citation1997; Hess, Moudon, Snyder, & Stanilov, Citation1999; Kitamura, Mokhtarian, & Laidet, Citation1997). Appropriate lighting is also related to levels of walking (Cervero & Kockelman, Citation1997; Fotios, Unwin, & Farrall, Citation2015). Design features have been directly linked to health indicators such as body mass index (BMI) (Frank et al., Citation2006). The quality of pedestrian facilities is crucial to encouraging walking, even when density and land use mix are favorable (Hess et al., Citation1999).
1.3. Vehicular impact
The choice of a mode of transportation, which relies heavily on comfort and a lack of a cohesive public transportation network, results in heavy use of private cars. These are vehicles with internal combustion engines, which release nitrogen oxides and volatile organic compounds (Frank et al., Citation2000), which react with sunlight to form harmful ground-level ozone (Boubel, Fox, Turner, & Stern, Citation1994). In high concentrations, ground-level ozone can trigger complications of the respiratory tract such as shortness of breath and asthma (Bell, McDermott, Zeger, Samet, & Dominici, Citation2004). The use of private vehicles is therefore associated with an increase in emissions, resulting in raised concentrations of air pollutants such as ozone, thus increasing exposure to the associated health hazards (Frank et al., Citation2006).
In summary, the evidence seems to suggest that physical activity such as walking or cycling for transportation (walking toward a destination as opposed to walking for recreation) has been designed out of our daily lives (Jackson, Citation2002). Density, diversity, and design seem to be the key elements in the built environment that in correct balance can promote and sustain mobility by walking (Cervero & Kockelman, Citation1997). As public health concerns have a major influence on planning and design agendas, based on evidence from research on transportation and land use, the promotion of walking as a means of transportation or for increasing accessibility has become the focus of interventions in the built environment.
Confidence in transportation findings is enhanced by the consistency of results (Reid Ewing & Cervero, Citation2010; Saelens, Sallis, & Frank, Citation2003). Concurrent research on planning and urban design also provides unambiguous evidence. These findings were absorbed by planning movements such as New Urbanism (Charter for the New Urbanism, Citation2000) and smart growth (American Planning Association [APA], Citation2002–2012). The Charter articulates the principles of New Urbanism, and the movement focuses on human-scale urban design with a strong sense of community. According to the Smart Growth Network (Citation2014), growth is considered smart when it results in great communities, with more choices and personal freedom, good return on public investment, greater opportunity across the community, a thriving natural environment, and a legacy we can be proud to leave our children and grandchildren.
Both New Urbanism and Smart Growth focus on a rich land use mix and the development of walking amenities to support active lifestyles. The core of this approach is the replacement of motorized means of transportation involving a mode-share increase of healthy forms such as walking or cycling in daily routines.
1.4. Smart growth and the climate of the Arabian Peninsula
The Arabian Peninsula, often described as Arabia, is located in western Asia, northeast of Africa, between the Red Sea to the west and the Arabian Gulf to the east. To the south, it is bound by the Indian Ocean and to the north by the Levant region. The peninsula consists of the countries of Bahrain, Kuwait, Oman, Qatar, Saudi Arabia, United Arab Emirates, and Yemen. With the exception of the southernmost areas (below the Tropic of Cancer), such as part of Oman and most of Yemen, there is infrequent and irregular rain and markedly warm weather during a large part of the year.
Construction methods and materials are continually improving the thermal comfort of buildings, thus providing more effective shelter from the climate (Sobal, Citation2002). The implications of added comfort are manifold. The exposure to an uncomfortable environment becomes less frequent and increasingly avoidable, as new comfort levels are sought, such as driving to work in an air-conditioned vehicle rather than walking while exposed to the weather.
According to Smart Growth Network (Citation2014), smart growth network includes:
“• Mix land uses • Take advantage of compact building design • Create a range of housing opportunities and choices • Create walkable neighborhoods • Foster distinctive, attractive communities with a strong sense of place • Preserve open space, farmland, natural beauty, and critical environmental areas • Strengthen and direct development towards existing communities • Provide a variety of transportation choices • Make development decisions predictable, fair, and cost effective • Encourage community and stakeholder collaboration in development decisions.”
When considering the application of New Urbanism and smart growth principles to the Arabian Peninsula, the solution of increasing activity levels by increasing the mode share of walking and cycling may be limited by the climate. In Alfonso’s (Citation2005) Pyramid of the Hierarchy of Walking Needs, feasibility constitutes the base, including factors such as age, health, and physical mobility. For some, high temperatures can be a limitation at this level, while for others it might be a matter of comfort, in any case compromising any investments at other levels of the pyramid, such as accessibility, safety, and pleasurability.
1.4.1. The impact of temperature on levels of physical activity
High ambient temperatures are known to have a physiological impact on the human body (Parkin, Carey, Zhao, & Febbraio, Citation1999), which is likely to influence performance and therefore activity levels. Ozgunen et al. (Citation2010) report a significant drop in the total distance run by football players in hot temperatures. In a study of objective measurements of physical activity and weather, Chan, Ryan, and Tudor-Locke (Citation2006) find “modest weather effects” on physical activity in the built environment context. However, such findings refer to exposure to a temperature range of −10°C to 20°C (monthly averages). In the context of the Middle East, Henry, Lightowler, and Al-Hourani (Citation2004) refer to high ambient temperature as one reason for the lack of physical activity among young females in the United Arab Emirates. This study does not objectively measure the effect of temperature, however, and instead presents it as empirically likely.
Advancements in biometeorology and urban climatology over the past decade have facilitated the growth of research on outdoor thermal comfort around the globe (Chen & Ng, Citation2012). Studies have focused mainly on two aspects: a) modeling and assessment methods from the thermo-physiological perspective and b) climatic parameters of thermal comfort (Chen & Ng, Citation2012). The Predicted Mean Vote-Predicted Percentage Dissatisfied (PMV-PPD) method, which forms the basis of regulatory standards for environmental conditions in the built environment such as ISO 7730 (Citation2015) and ASHARE55 (Ashrae, Citation2013), is a common method of evaluating thermal comfort outdoors (Chen & Ng, Citation2012). The Physiological Equivalent Temperature (PET) is another such method, which has shown stronger results than the PMV in outdoor environments (Chen & Ng, Citation2012). The PET method (output degrees Celsius) is more intuitive to interpret for non-experts in meteorology (Chen & Ng, Citation2012), making it suited to the context of planning and design of the built environment.
Research findings point to a yearly thermal acceptance range in Europe of 21.3–28.5°C (70.34–83.3°F) PET, which contrasts with the acceptable range for hot and humid climates of 18–23°C (64.4–73.4°F) PET (Chen & Ng, Citation2012). Parameters such as “naturalness” and “past experience,” which are elements of the model developed by Nikolopoulou and Steemers (Citation2003), are likely explanations for the difference in the magnitude of the ranges and the difference between the maximum values. The model consists of three levels of thermal adaptation: physical, physiological, and psychological. Therefore, PET values should be experimentally investigated locally. Consequently, the references mentioned are used as rough guides.
1.5. Case study—Kingdom of Bahrain
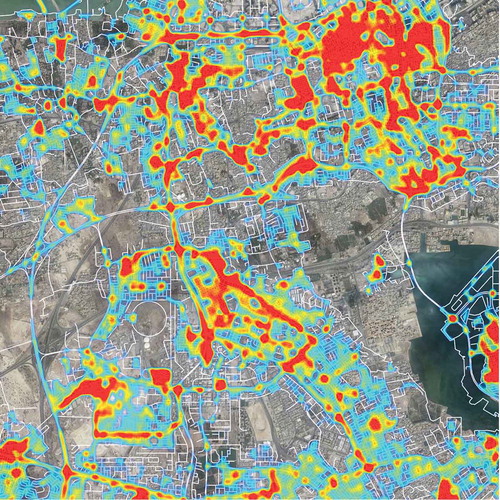
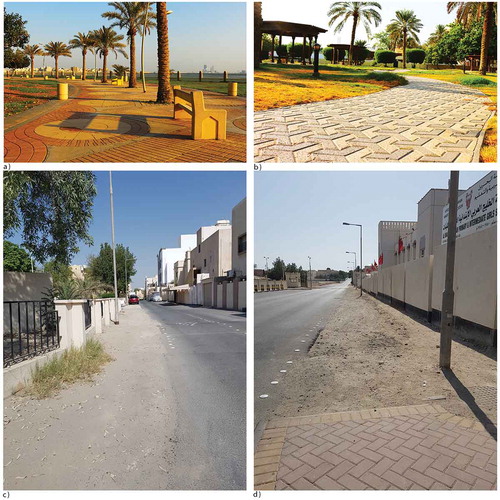
The Kingdom of Bahrain (Figure ) has been developing initiatives toward curbing inactivity levels. Examples are nutrition campaigns and built environment measures, such as the national network of public recreation areas (e.g., Al Hunainiya Public Park, Arad Bay Protected Area & Park, Arad Fort Walkway, Budaiya Walkway & Park, Khalifa Grand Park Riffa, Dohat Arad Park, Muharraq Corniche, among others) and the creation of outdoors walking/exercising facilities in neighborhoods (e.g., A’Ali, Safra, Madinat-Hamad). Dedicated outdoor walking facilities are built in new residential areas and progressively developed in older neighborhoods. Furthermore, the country has beautiful corniches and other quality outdoor public recreation areas (Figure a, b). Nonetheless, an indoor shopping mall is listed 4th among the best places to walk in the country (TimeoutBahrain, Citation2006). It seems likely that during approximately half of the year, the opportunity to pursue physical activity outdoors is limited, although more research is necessary to investigate the details of such limitations. It is common to find citizens walking outdoors in purpose-built and vacant areas around sunrise and sunset, even during the hot season. The oldest cities of Bahrain (Muharraq and Manama) have a dense road network, as illustrated in Figure . Under formation and growth is Riffa, which presents similar levels of street density. Nonetheless, Muharraq, with its irregular street geometry, is mostly composed of buildings with one to three floors. Manama has a rectangular street grid and buildings with five floors. Riffa, a combination of regular and irregular grids, is mostly made up of buildings with one to three floors (Figure c). Some streets lack sidewalks (Figure c, d), which implies a lack of continuity of the pedestrian network, and this makes it difficult to be mobile by walking.
Figure 1. Aerial view of mainland Bahrain with overlay of heat map of the street network. Red to blue representing higher to lower density of nodes, respectively. The population is largely concentrated on the north and west of the territory
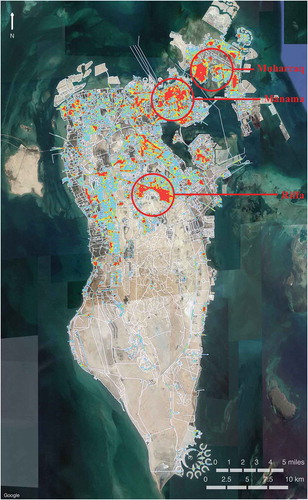
Figure 2. Parks and well maintained pedestrian areas (a, b) in Bahrain; Examples of lack of continuity of pedestrian network (c, d)
According to official records, during six months of the year, the monthly average temperature in Bahrain is ≥ 30°C (86°F) (April–October), as documented in Table . The monthly average high is ≥ 37°C (99°F) for five months (May–September), and the monthly average minimum is > 30°C for four months (June–September). Also note the relatively high relative humidity values throughout the year.
Table 1. Average monthly temperature, relative humidity and precipitation in Bahrain
The local PET reference has not yet been identified, and since as per Nikolopoulou and Steemers’ (Citation2003) model it includes adaptation by contextualization, it is hard to estimate. However, it is likely that its top range will not be very different from that of Europe (28.5°C), or even lower, as found in warm and humid climates (23°C). Therefore, reaching the desired levels of activity outdoors for six months (May through October) would represent an average of 52 min of walking per day in average monthly temperatures ≥ 30°C. These average values imply even higher temperatures between sunrise and sunset, which would be incompatible with a top PET range likely to be in the mid to high twenties.
It is possible to increase the thermal comfort of the pedestrian microclimate through the careful design of urban streets (Pinelo Silva, Citation2017). The manipulation of street orientation (in relation to the sun path) and the geometry (width/height aspect-ratio) are effective climate mitigation strategies (Ali-Toudert & Mayer, Citation2006; Mayer & Höppe, Citation1987). According to the authors, streets with a high aspect ratio (building height/street width) provide a more comfortable microclimate. Examples of these can be found in older Bahraini centers and in recent vertical housing estates. Research carried out locally may provide crucial planning and design guidelines to maximize the daily and seasonal comfort periods of outdoor areas, considering the local PET range.
Building design can enhance physical activity. Stair usage is recommended as a way to increase physical activity (Pate et al., Citation1995). Evidence shows that “skip-stop” lifts (which stop every fourth floor) and “skip-stop” stairs (which serve the floors not directly served by a lift) can increase stair usage by 33-fold (Nicoll & Zimring, Citation2009) while not increasing building costs. Encouraging signs (Andersen, Franckowiak, Snyder, Bartlett, & Fontaine, Citation1998; Blamey, Mutrie, & Aitchison, Citation1995; Kerr, Eves, & Carroll, Citation2001), as well as painting, coloring, and music (Kerr et al., Citation2001), can also be used to increase stair usage and, therefore, PA levels.
1.3.4. Other particulars of the Arabian Peninsula
Apart from the climate, the region shares other characteristics, such as large expatriate populations. According to the United Nations, the population of Bahrain was estimated at 1,344,000 (2014), with 54.8% of foreign origin in a majority urban population (89%) (United Nations World Statistics Pocketbook, Citation2016).
Arabs form the largest ethnic group in Bahrain with 50.7% of the total population, which is 70% Muslim (CIA: The World Factbook: Bahrain, Citation2014/15). Research has highlighted these characteristics as potentially influencing inactivity levels and life in the public realm. Mabry, Reeves, Eakin, and Owen (Citation2010) reported levels of inactivity to be as high as 61.0% and 73.7%, among males and females, respectively, in a review of the evidence on physical inactivity in five countries of the Arabian Gulf region, summarized in Table .
Table 2. Unweighted prevalence of physical inactivity in Gulf Cooperation Council countries. Adapted from Kahan (2015)
In a study of adolescents in seven Muslim countries, females faced more barriers to engaging in PA than males (Musaiger et al., Citation2013). An enabler of physical activity among women was the social support of having another woman to walk with (Ali, Baynouna, & Bernsen, Citation2010).
However, in a study involving 94 non-Muslim countries and 38 Muslim countries, of which half were Arab League members, Kahan (Citation2015) reported that non-Arab Muslim countries were as physically active as non-Muslim countries (Kahan, Citation2015, p. 74), both of which were more active than Arab countries. This study puts aside religion as a possible covariant for physical inactivity. Regional studies taking into account the comprehensive local context are paramount to understanding what are the best strategies to address inactivity in the region. According to the WHO, globally, the prevalence of physical inactivity rises with income (Alwan, Citation2011), which makes the region vulnerable. Inactivity-associated heart disease and stroke were two of the top five causes of death in Arab countries in 2010 (Rahim et al., Citation2014). Diabetes mellitus is already having a considerable economic impact in the region (Al-Rubeaan, Citation2014).
Under such climatic, cultural, and economic circumstances, it appears that the regional approach to mitigating physical inactivity via the built environment should include solutions beyond walking and cycling for mobility, for instance including PA in daily routines by way of leisure activities, although this may require culture-sensitive facilities in some countries. Such approach is being developed in Bahrain through the inclusion of dedicated outdoors leisure/walking areas in neighborhoods.
The existence of high inactivity levels in Bahrain has been diagnosed by the Ministry of Health of Bahrain within the WHO STEPS program (which studies the risk factors for national non-communicable diseases), based on a survey from 2007 published in 2009 (STEPS, Citation2009).
2. Method
2.1. Research questions
In the context of the application of smart growth principles such as the promotion of physical activity (PA) in daily transportation routines in the Arabic Peninsula, it becomes necessary to measure how the design of the built environment contributes to PA. Considering that the climate might have an effect on the amount of PA carried outdoors, two questions need answering:
How much health-inducing exercise is performed outdoors?
Is there a seasonal variation in the amount of exercise carried outdoors?
The answer to the first question reveals the current dependence on indoor environments for carrying out PA. The answer to the second question reveals the extent to which the weather may be responsible for the fluctuation in PA carried outdoors.
The present study also aims at establishing a baseline relationship between PA and the built environment in the sense of the reliance of individuals on indoors to be physically active. The proportion of activity carried outdoors and indoors during the cool season was appraised with a standardized instrument for measuring PA, complemented by questions that placed activity in their indoors/outdoors context. The data collection of the STEPS program (conducted in Bahrain in 2009) took over one year to complete and did not account for possible seasonal variation. To account for this, it is necessary to take repeated measurements on a seasonal basis. This is crucial to measure the possible role of the climate in the dependence on indoor environments. Therefore, one goal was to find a method that could prove reliable and practical for monitoring on a seasonal basis. A useful classification of activity performed indoors versus outdoors relies on a reliable classification of activities, which implied a standardized approach. Finally, to ensure the quality of the monitoring data, it is necessary to use an instrument with proven test-retest reliability.
2.2. The instrument
Numerous instruments can be used to measure physical activity, including self-reporting questionnaires, heart rate telemetry, direct observation, indirect calorimetry and movement sensors (Montoye, Citation1996). None of the methods are perfect (Terwee et al., Citation2010), and their limitations have been documented by Shephard (Citation2003). In spite of the desired objectivity and unobtrusiveness of contemporary accelerometers (Freedson & Miller, Citation2000), their upfront cost influenced the decision to use questionnaires in this exploratory study. From the several available choices, the International Physical Activity Questionnaire (IPAQ) was selected. Created as a tool for assessing physical activity based on a global standard (Craig et al., Citation2003), the IPAQ has international validity, which rests on its ability to be utilized in cross-cultural contexts. Cross-cultural validity is relevant due to two aspects: first, the cultural diversity of the population of Bahrain, where expatriates make up almost 55% of the population (CIA, Citation2014/15); second, it opens the possibility for cross-border studies, which can be particularly interesting within the region.
The IPAQ is a standardized self-reporting measure of normal levels of physical activity of a population. It has been found to have a positive 0.30 Spearman correlationFootnote1 with accelerometer-measured activity (Craig et al., Citation2003). It was initially evaluated in 14 studies and found to have good test-retest reliability (Frank et al., Citation2006). The IPAQ has since become the most widely used PA questionnaire (van Poppel, Chinapaw, Mokkink, van Mechelen, & Terwee, Citation2010).
The IPAQ has two versions: a long form with 31 questions and a short form (IPAQ-SF) with nine questions. The IPAQ-SF was chosen for this pilot study to ease the burden on participants and increase the likelihood of successful data collection in a time-sensitive context, in particular given that the comprehensive STEPS study (STEPS, Citation2009) has been conducted previously, providing a strong national-scale view of the problem. The ability to measure activity levels in a time-sensitive manner is critical to allow weather-dependent follow-up. The IPAQ-SF records PA at four intensity levels: 1) vigorous, such as fast bicycling; 2) moderate, such as regular cycling; 3) walking; and 4) sitting.
Questions regarding the number of days and the daily amount of time spent on each activity category are answered based on the previous seven days, as recommended by the original authors. Only bursts of activity lasting longer than 10 min are reported. Participants also reported the average time spent sitting per day. The IPAQ Research Committee recommends a three-level categorical classification (high, moderate, low) resulting from the numerical analysis of METS. To measure what proportion of the activity takes place indoors versus outdoors, a second set of questions was added to the otherwise non-altered IPAQ-SF, asking the subjects to declare the proportion of exercise performed outdoors for each of the IPAQ-reported activities.
In this study, the following sampling methodology was used: participants were selected at random (e.g., third person appearing around the corner), by trained graduates, from a preselected list of locations (indoors and outdoors), with data being collected at different hours. Since one aim of the study was to measure the national baseline of PA, the locations were chosen to ensure national coverage, rather than tie up participants to their residential areas. Therefore, the locations were in popular national-level non-residential areas, in particular around and in the largest malls and parks and the central market. Because of the geographical dimensions of the mainland, in Bahrain, many places of frequent weekly use have a national catchment area. The survey was run a total of four times, during the winter, between December and February, and in the summer, between June and middle of September, during 2015–17, therefore including two winters and two summers. The questionnaire was prepared in Google forms and presented on a tablet that was handed over to the subjects, after a brief explanation of the study. The survey was never carried out during, or the week leading to or following, Ramadan.
2.3. Data analysis
Data were processed according to the IPAQ scoring protocol as designated by the IPAQ Research Committee (Citation2005) and included data cleaning, excluding bouts of less than 10 min, excluding outliers, data truncation, and computing MET minutes per week (MET-min/w) scores. The latter involves weighing the total weekly time spent per activity according to each activity’s energy requirements as defined by MET, which is a measure of the energetic cost of an activity. The IPAQ scoring protocol assigns the following MET values to vigorous exercise, moderate exercise and walking: 8.0 MET, 4.0 MET, and 3.3 MET, respectively (IPAQ Research Committee, Citation2005). BMI was computed by dividing a subject’s self-declared weight in kilograms by the square of his/her height in meters. Therefore, the BMI reporting unit is kg/m2.
According to the IPAQ-SF protocol, the data for the 1748 participants was cleaned during the preliminary analysis, resulting in the removal of 389 outliers (n = 389, 22%—defined as individuals with weekly activity over 960 min). The data for the actual subjects (n = 1359) was truncated at 180 min per week for each activity intensity (vigorous, moderate, walking). Because of their non-normal distribution, the median and interquartile range (IQR) are used to report both body mass index and MET-min/w, as recommended by the IPAQ Research Committee (Citation2005). The full analysis was performed on 1359 subjects, half of which are female (n = 678, 50%). According to IPAQ protocol, the age range is 15–69 with a mean of 35 (SD = 13). The mean height is 1.67m (SD = 0.09), and the mean weight is 68 kg (SD = 17). The median body mass index (BMI) is 23.89 kgm2 (IQR = 5.27) (mean = 24.76, SD = 4.89).
3. Results
3.1. Findings
The survey revealed that the total contribution of outdoor PA considering MET-min/w was approximately 39%, as shown in Table . Of the 39% of activity carried out outdoors, 25% was carried out during the winter, nearly twice as much as the contribution from summer at 14%. As for the dominant type of exercise outdoors, walking accounts for 20% of the total of 39%. Males carry out a larger percentage of Vigorous and Moderate activities outdoors. The same happens with walking in the summer, while in the winter males and females report similar levels of walking outdoors.
Table 3. Percentage of physical activity (MET-min/week) that took place outdoors grouped by season, gender, and intensity of activity
While comparatively modest proportions of Vigorous (34%) and Moderate (27%) activities were reported to have taken place outdoors, walking did take place outdoors over half of the time (55%) (Table ). The winter dominates exercise outdoors in all three categories, though the difference in walking is less accentuated, with 42% of walking taking place outdoors in the summer and 67% in winter. Males tend to carry out more exercise outdoors both across seasons and activity types. The largest behavioral difference between genders is on moderate activity, with males performing over four times the amount of female exercise outdoors during the summer.
Table 4. Percentage of time spent outdoors per season, gender, and intensity of activity
Participants reported a median of 754 MET-min/w and an interquartile range (IQR) of 720 for all activity. The median MET-min/w for the various activities was 0 min/w of vigorous activity (IQR = 640), 0 min/w of moderate-intensity activity (IQR = 600), and 396 min/w for walking (IQR = 495). Inferring reported activity to the population without assumption on the population standard deviation, the estimated values of the population means at 95% confidence level are within the following confidence intervals:
BMI: 24.06 ≥ M ≤ 24.67; t test(t = 155.55, df = 1358, p < .001).
Vigorous Activity per Week (minutes): 38.17 ≥ M ≤ 45.43; t test(t = 22.61, df = 1358, p < .001).
Moderate Activity per Week (minutes): 59.77 ≥ M ≤ 67.94; t test(t = 30.67, df = 1358, p < .001).
Walking per Week (minutes): 99.65 ≥ M ≤ 107.46; t test(t = 52.02, df = 1358, p < .001).
Sitting per Week (minutes): 3690.09 ≥ M ≤ 3806.01; t test(t = 126.85, df = 1358, p < .001).
3.2. Summer versus winter
Mean BMI
Summer: 24.31
23.86 ≥ M ≤ 24.76; t test(t = 106.22, df = 770, p < .001).
Winter: 24.42
24.03 ≥ M ≤ 24.82; t test(t = 120.6, df = 587, p < .001).
Mean Vigorous Activity per Week (minutes)
Summer: 46.55
41.39 ≥ M ≤ 51.71; t test(t = 17.73, df = 770, p < .001).
Winter: 35.57
30.64 ≥ M ≤ 40.49; t test(t = 14.18, df = 587, p < .001).
Mean Moderate Activity per Week (minutes)
Summer: 58.48
53.00 ≥ M ≤ 63.97; t test(t = 20.93, df = 770, p < .001).
Winter: 70.89
64.80 ≥ M ≤ 76.99; t test(t = 22.87, df = 587, p < .001).
Mean Walking Time per Week (minutes)
Summer: 83.24
77.84 ≥ M ≤ 88.64; t test(t = 30.26, df = 770, p < .001).
Winter: 130.18
125.35 ≥ M ≤ 135.01; t test(t = 52.95, df = 587, p < .001).
Mean Sitting Time per Week (minutes)
Summer: 3808 (IQR = 840)
3736.49 ≥ M ≤ 3879.64; t test(t = 104.44, df = 770, p < .001).
Winter: 3669 (IQR = 1260)
3573.89 ≥ M ≤ 3764.82; t test(t = 75.49, df = 578, p < .001).
The results show high levels of inactivity. According to the IPAQ categorical classification (IPAQ Research Committee, Citation2005), a considerable percentage of the sample (52%, n = 707) presents low activity levels (less than the minimum recommended), while 38% (n = 516) engage in a moderate degree of exercise, and 10% (n = 136) in high measures of physical activity. Seasonality seems to have a mild role in terms of the fluctuation of population between categories. The percentage of population below the minimum recommended levels of activity in the summer is 57% and 44% in the winter. The categorical classification of the population follows the IPAQ cut-off points (IPAQ Research Committee, Citation2005, p. 5):
High: a) vigorous intensity on at least 3 days achieving a minimum total physical activity of at least 1500 MET-min/week; or b) 7 or more days of any combination of walking, moderate-intensity or vigorous-intensity activities achieving a minimum total physical activity of at least 3000 MET-min/week.
Moderate: a) 3 or more days of vigorous-intensity of at least 20 min per day; or b) 5 or more days of moderate-intensity activity and/or walking for at least 30 min per day; or c) 5 or more days of any combination of walking, moderate-intensity or vigorous-intensity activities achieving a minimum of at least 600 MET-min/week.
All individuals whose activity is below the minimum criteria for the Moderate classification shall be classified as Low.
The percentage of population who engage in a moderate level of exercise is 31% during the summer and 46% during the winter. The percentage of population who engage in high levels of exercise is 12% in the summer and 9% in the winter. Gender differentiation reveals 57% of the female population and 47% of male population below the minimum recommended levels of activity. Of females, 36% perform moderate levels of activity, to 39% of males. Of the female population, 7% perform high levels of activity, to 15% of male population.
The results also show relatively high levels of BMI, which often relate to high levels of inactivity. According to the WHO cut-off points, 55%(n = 752) of the sample has normal weight, while 39% (n = 526) is overweight (BMI ≥ 25 kg/m2), and 11% (n = 146) of individuals were obese (BMI ≥ 30 kg/m2) (Appendix Table 2). There were not marked differences in terms of BMI across genders, with the exception of underweight, with 10% (67) females to 2% (14) males.
3.3. Study limitations
Despite being recommended and widely used, the IPAQ-SF is not without limitations, most of which are rooted in its self-reporting nature. On a systematic review of 23 validation studies of the IPAQ-SF, Lee, Macfarlane, Lam, and Stewart (Citation2011) conclude that although typically the correlations between overall activity reported and objectively measured activity are low, correlations between walking and vigorous activity are consistently within an acceptable range. Furthermore, the authors argue that although the overall magnitude of activity levels might not be accurate, the proven test-retest reliability of the IPAQ-SF makes it adequate for repeated measures studies (P. H. Lee et al., Citation2011). Because the central aim of this study was to gauge the amount of walking in a standardized manner allowing for time-sensitive repeated measures, the instrument is adequate. In addition, the ability to compare results internationally makes it truly useful for comparisons across cultural milieus. Moreover, the potential misrepresentation of the magnitude of activity declared is typically unidirectional, leading to an overestimation of activity levels by a cross-study mean of 106% (P. H. Lee et al., Citation2011, p. 9).
Although the method for the recruitment of participants used and described above would not be ideal for measuring inactivity levels, it serves the objective of this study, which is to measure the level of PA carried outdoors and indoors. Since the questionnaires have only been served in public spaces (and not at home), the presence of a bias due to the sampling method would imply over reporting of activity, which implies that the levels of inactivity would be higher than reported. Furthermore, because the IPAQ protocol makes use of outlier removal and data truncations, as described in the appendix, the risk of active subjects biasing the sample is limited. Nonetheless, the self-reporting bias associated with the possible bias of surveying subjects who are not at home is likely to influence results in one direction: under-reporting inactivity levels. Therefore, the results regarding inactivity levels should not be taken as a follow up of the previous STEPS study (STEPS, Citation2009), and the latter should remain the reference for inactivity levels. The limitations arising from a bias in self-reported data regarding body measures are well known (Gorber, Tremblay, Moher, & Gorber, Citation2007), typically resulting in underestimates of BMI (Ward et al., Citation2016). Once more, the misrepresentation is unidirectional, and the real situation is therefore likely to be under-reported.
3.4. Discussion
Endemic levels of physical inactivity throughout the developed world constitute a threat to public health. However, the planning and design of the built environment can modify lifestyles to correct such trend. Typical strategies to achieve this goal focus on increasing walking as means of transportation. This study explores the challenges and opportunities of such approach in the region of the Arabian Peninsula, where the climate and cultural determinants influence the use of outdoor environments.
In the process of measuring the dependency on indoor environments to carry out physical activity and discuss smart growth strategies, this paper discusses the health of the general public and physical inactivity, including a summary review of the evidence linking physical activity (PA) to the built environment. The Kingdom of Bahrain, which is actively addressing such issues, is introduced as a regional case study, summarizing the generic climatic and socio-cultural context. An international standard survey is used to measure PA and the proportion of it that is performed outdoors and indoors in both summer and winter.
The context of the Arabian Peninsula presents a series of challenges and opportunities, as identified through this case study. The survey identified a high level of dependence on indoor environments for being physically active, reporting that 61% of the PA takes place indoors and only 37% of MET reported activity took place outdoors, even during the pleasant winter temperatures, and sporadic rain.
The difference between walking that takes place outdoors in the summer (42%) and in the winter (67%) suggests the role of the weather on outdoor activities. It should be stressed that such difference between winter and summer is smallest in walking, perhaps suggesting the utilitarian (likely for transportation) nature of some of the walking. The 67% of walking taking place outdoors in the winter suggests the extent to which the built environment supports walking. However, the outdoor walking reported does not differentiate types of walking, such as for circulation and for recreation, which would be useful for the purpose of better measuring the role of the weather on walking and therefore the support of the built environment for utilitarian walking. Recreational walking is supported by an increasing number of new dedicated facilities.
The study also reports high levels of inactivity (52%). The IPAQ component of the survey confirms high inactivity levels though more modest than the extremely high levels reported in the STEPS study (STEPS, Citation2009), as shown in Table . However, the studies should not be compared directly as they use different questionnaires and protocols. Furthermore, as the STEPS study presents a more robust sample size and method to measure inactivity levels, it should remain the reference concerning such values. Furthermore, as mentioned in the limitation of the study, the IPAQ was not served at home, but in public places, which can bias the sample toward more active subjects. Nonetheless, the IPAQ-SF baseline values can be used to monitor seasonal variations, which was not possible with the STEPS study, and a) eliminate the weather as variable of influence of PA outdoors and b) eventually measure the impact of changes in policy. A median BMI of 23.91 kgm2 (IQR = 5.85), with 41% of the sample being overweight and 15% being obese, validates high inactivity levels.
The pleasant climate from November to April presents ideal outdoor conditions with little rain and average temperatures ranging between 14°C and 26°C, as documented in Table . During this part of the year, the pedestrian could easily base daily transportation needs on walking outdoors, if the built environment supported this. Therefore, the creation of mixed land use and a continuous pedestrian network as advocated by the New Urbanism and Smart Growth is useful. However, walking for transportation during the warm part of the year might be challenging, suggesting that some level of PA might be pursued indoors. Nonetheless, even if walking outdoors is not sufficient to reach recommended levels of PA during the summer months, a microclimate-conscious design of the pedestrian domain should be a priority, complemented by the use of PA-promoting design features in buildings.
The reliance on indoor environments, particularly important during the warmer season, emphasizes the responsibility of architects as designers of buildings. Simultaneously, such accountability affords the designers the opportunity to create innovative health-promoting design features, such as skip-stop lifts and stairs. Feature-rich designs that promote PA could leverage activity levels throughout the year and help to achieve the minimum recommended 52 min of walking per day during the warmer part of the year. Opportunities for creativity extend throughout all types of workplaces, not only office buildings. Commercial areas, such as shopping centers, which tend to have good walking conditions, could be available during an extended period. This is current practice in several shopping centers in the Arabian Peninsula, which organize mall-walking periods. However, this solution does not constitute walking as means of transportation. Furthermore, the need for indoor environments to exercise could extend to the creation of a new building typology dedicated to such activities, and/or the development of corridors for circulation by walking/cycling, with commerce and other amenities typically found in outdoor areas.
3.5. Challenges and suggestions
Challenge: The design of pedestrian infrastructure should be optimized to create a comfortable microclimate, namely, by mitigating high temperatures and therefore maximizing the use of outdoor areas throughout the year and widening the daily time-span of use during the warm season.
Suggestion: A comfortable microclimate for the pedestrian can be achieved through urban planning and design, considering street orientation and aspect ratio (Ali-Toudert & Mayer, Citation2006) (Pinelo Silva 2017). However, it is not certain that such efforts can be sufficient for the provision of infrastructure (including microclimate) that can serve the population throughout the year. It seems likely that some degree of dependence on indoor facilities will remain, and therefore special attention should be given to the design of buildings.
(2) Challenge: The ongoing creation of leisure walking/exercise areas within neighborhoods that is taking place in Bahrain is supplementing a number of corniches and other quality public spaces developed since the 1980s. The results of the survey indicate no gender difference in terms of the percentage of walking outdoors, suggesting that in Bahrain, there is no need for gender-dedicated outdoor facilities. Though research discussed above suggests that this is not the case in the other countries of the Arabian Peninsula, such physical activity inducing areas are an important source of opportunity for leisurely exercise.
Suggestion: An interconnecting network could extend their role while reducing the stress on road traffic. Easing road traffic is being pursued through the current overhaul of the public transport system initiated by a comprehensive network of ultra-modern air-conditioned buses with Wi-Fi. Nonetheless, the emphasis on walking for circulation is relevant because it is double-edged: it reduces road traffic while increasing PA.
(3) Challenge: Reflecting “on the potential for health geography,” Andrews, Hall, Evans, and Colls (Citation2012) provide a framework to analyze relationships between health and the built environment, which has five components: 1) human-made physical features, such as land use and urban design features; 2) environmental features, such as topography, pollution, and climate; 3) socio-cultural features, such as the avoidance of areas of perceived danger or the existence of clubs promoting exercise; 4) socio-political features, such as the propensity of certain groups (e.g., cyclists) to exert pressure to develop dedicated infrastructure; 5) cognitive and perceptive concerns, such as creating a spiritual escape or a therapeutic experience, or building self-identity and confidence (Andrews et al., Citation2012, p. 1930).
Suggestion: Considering the potential of each of the five dimensions in the particular context of the region may be a powerful approach to identifying and prioritizing research questions that can inform the development of the built environment in pursuit of established public health goals.
(4) Challenge: Addressing the regional levels of physical inactivity through the built environment poses some challenges as well as significant opportunities. The region under consideration seems to have highly favorable climatic conditions that may comfortably enable the population to reach healthy levels of physical activity by walking for transportation (approximately 52 min per day on average) during the cool time of the year (October to April).
Suggestion: This period could potentially be extended through microclimate-conscious design of outdoor pedestrian environments. This implies a comprehensive pedestrian network and mixed land use. However, between May and September, with monthly average temperatures over 30°C, achieving such levels of activity would be uncomfortable. Careful street planning and design can assist in creating a favorable microclimate, but dependence on indoor environments is likely unavoidable. At this moment, this seems to be the case even during the cool season when 60% of declared activity took place indoors (86% during summer, and 75% during winter). The reliance on buildings requires architects to widen the palette of design features that promote PA, and their extensive use. A high BMI reflects higher calorie intake than expenditure. Nutrition counseling could also have a relevant role in addressing weight issues.
(5) Challenge: The least seasonal difference within activities is with walking (Table ), perhaps emphasizing its utilitarian nature, however, restricting the scope of urban planning for an active life to promoting walking for transportation might not be enough to reach recommended activity levels all year round.
Suggestion: Even though the creation of a comfortable microclimate outdoors might not be possible for some periods of the year due to the climate, prioritizing the optimization of thermal comfort at street level seems to be an obvious need.
(6) Challenge: Curbing inactivity exclusively through moderate PA and walking for transportation or for access seems to have limited potential in the Arabian Peninsula due to high temperatures and cultural milieu.
Suggestion: A microclimate conscious design of the pedestrian domain should be a priority, accompanied by the use of PA-promoting design features in buildings. Strategies to reverse this trend rely on policies and guidelines that focus on increasing the mode-share of physically active transportation, such as walking and cycling.
(7) Challenge: The dependence on the indoor built environment suggests that the region would benefit from:
Suggestion: a) creative indoor design solutions for encouraging PA. A sub-challenge here is that health-induced PA, as described by the IPAQ protocol, implies bouts of activity with a minimum duration of 10 min, which might be challenging to achieve in some office buildings; b) promoting mixed land use; c) developing a comprehensive transport and pedestrian network, and d) mitigating adverse climate at street level to create a favorable microclimate.
3.6. Future research
Further insight on the relationship between the built environment and physical activity in the region could focus on the effects of neighborhoods with distinct features. Such approach could be useful to the development of both policy and planning and design. The suggested dependency on outdoor environments and leisure for reaching recommended PA levels might put economically vulnerable segments of the population at higher risk. Including more demographics data such as household income could perhaps be useful to explore this possibility. A variation of the IPAQ designed to study adolescents could be used to target this population segment, as in Hagströmer et al. (Citation2008). Future research could include a longitudinal study of the relationship between objective measures of physical activity and weather as developed by Chan (Citation2006) in Canada. The regional study of heat mitigation strategies for pedestrian environments clearly requires further research. The physiological equivalent temperature range for each country in the region should be measured in order to offer objective goals to climate-mitigation during design. Because the thermoregulatory capacity of the human body decreases with age (Scremin & Kenney, Citation2004), an aging population is increasingly vulnerable when exposed to high temperatures. This could be studied through a different questionnaire targeting the population over 69 years old, which is the age limit for the IPAQ-SF. This is especially relevant as a recent comprehensive literature review providing a synthesis of the evidence between the relationship between the built environment and the elderly suggests that some built environment variables may impact on health of this group, emphasizing that there is need for further investigation. Finally, demand exists for new creative ideas to extend the palette of design features of PA-inducing design solutions. In conclusion, the region presents a wealth of opportunities for research and for creative design practice.
Supplemental Material
Download MS Word (539.8 KB)Supplemental material
The supplemental data for this article can be accessed here
Additional information
Funding
Notes on contributors
Joao Pinelo Silva
I study how the design of the built environment matters for its inhabitants. How do the built environment supports/influences individuals and organizations? How can architects and planners learn from evidence to develop increasingly responsive designs?
In this paper, we summarise the climate and cultural research regarding physical activity in public, to contextualise the built environment in the Arabian Peninsula. We do this with the objective of maximising the positive impact of the built environment on facilitating transportation and improving public health while reducing the dependence on indoor environments for performing physical activity
Notes
1. The correlation coefficient reflects the strength of the covariance between two variables, with 0 meaning no covariance and 1 absolute covariance. The Spearman correlation is used for non-normally distributed or ordered variables.
Related Research Data
References
- Alfonzo, M. A. (2005). To walk or not to walk? The hierarchy of walking needs. Environment and Behavior, 37(6), 808–836. doi:10.1177/0013916504274016
- Ali, H. I., Baynouna, L. M., & Bernsen, R. M. (2010). Barriers and facilitators of weight management: Perspectives of Arab women at risk for type 2 diabetes. Health & Social Care in the Community, 18(2), 219–228. doi:10.1111/j.1365-2524.2009.00896.x
- Ali-Toudert, F., & Mayer, H. (2006). Numerical study on the effects of aspect ratio and orientation of an urban street canyon on outdoor thermal comfort in hot and dry climate. Building and Environment, 41(2), 94–108. doi:10.1016/j.buildenv.2005.01.013
- Al-Rubeaan, K. (2014). The impact of diabetes mellitus on health and economy of Gulf cooperation council countries. Diabetes Management, 4(4), 381–390. doi:10.2217/dmt.14.28
- Alwan, A. (2011). Global status report on noncommunicable diseases 2010. World Health Organization.
- American Planning Association (APA) (2002–2012). Policy Guide on Smart Growth. Retrieved August, 2018, from: https://www.planning.org/policy/guides/adopted/smartgrowth.htm
- Andersen, R. E., Franckowiak, S. C., Snyder, J., Bartlett, S. J., & Fontaine, K. R. (1998). Can inexpensive signs encourage the use of stairs? results from a community intervention. Annals of Internal Medicine, 129(5), 363–369. doi:10.7326/0003-4819-129-5-199809010-00003
- Andrews, G. J., Hall, E., Evans, B., & Colls, R. (2012). Moving beyond walkability: On the potential of health geography. Social Science & Medicine, 75(11), 1925–1932. doi:10.1016/j.socscimed.2012.08.013
- Ashrae, A. (2013). Standard 55-2013, Thermal environmental conditions for human occupancy. Atlanta, GA: American Society of Heating, Refrigerating and Air-Conditioning Engineering.
- Bell, M. L., McDermott, A., Zeger, S. L., Samet, J. M., & Dominici, F. (2004). Ozone and short-term mortality in 95 US urban communities, 1987-2000. Jama, 292(19), 2372–2378. doi:10.1001/jama.292.19.2372
- Blamey, A., Mutrie, N., & Aitchison, T. (1995). Health promotion by encouraged use of stairs. BMJ: British Medical Journal, 311(7000), PMCID: PMC2550357 289–290. doi:10.1136/bmj.311.7000.289
- Boarnet, M., & Crane, R. (2001a). The influence of land use on travel behavior: Specification and estimation strategies. Transportation Research Part A: Policy and Practice, 35(9), 823–845. doi:10.1016/S0965-8564(00)00019-7
- Boarnet, M., & Crane, R. (2001b). Travel by design: The influence of urban form on travel. USA, New York: Oxford University Press.
- Boon, R. M., Hamlin, M. J., Steel, G. D., & Ross, J. J. (2010). Validation of the New Zealand Physical Activity Questionnaire (NZPAQ-LF) and the International Physical Activity Questionnaire (IPAQ-LF) with accelerometry. British Journal of Sports Medicine, 44(10), 741–746. doi:10.1136/bjsm.2008.052167
- Boubel, R. W., Fox, D. L., Turner, B. D., & Stern, A. C. (1994). Fundamentals of air pollution. San Diego, California: Academic Press.
- Cairncross, L. (2016). Active ageing and the built environment. UK: The Institute of Public Care, Oxford Brookes University, for the Housing Learning & Improvement Network. Retrieved February 19, 2018, from https://www.housinglin.org.uk/_assets/Resources/Housing/Support_materials/Practice_briefings/HLIN_PracticeBriefing_PHE_ActiveAgeing.pdf
- Cervero, R., & Kockelman, K. (1997). Travel demand and the 3Ds: Density, diversity, and design. Transportation Research D, 2(3), 199. doi:10.1016/S1361-9209(97)00009-6
- Chan, C. B., Ryan, D. A., & Tudor-Locke, C. (2006). Relationship between objective measures of physical activity and weather: A longitudinal study. International Journal of Behavioral Nutrition and Physical Activity, 3(1), 1–9. doi:10.1186/1479-5868-3-21
- Charter of the New Urbanism [Forum]. (2000). Places, 13(2), 74-75.
- Chen, L., & Ng, E. (2012). Outdoor thermal comfort and outdoor activities: A review of research in the past decade. Cities, 29(2), 118–125. doi:10.1016/j.cities.2011.08.006
- CIA. (2014/2015). Ministry of Information Affairs. Bahrain. Retrieved January, 2016, from: http://www.mia.gov.bh/en/Kingdom-of-Bahrain/Pages/Population-and-Demographic-Growth.aspx
- Craig, C. L., Marshall, A. L., Sjöström, M., Bauman, A. E., Booth, M. L., Ainsworth, B. E., … Oja, P. (2003). International physical activity questionnaire: 12-country reliability and validity. Medicine & Science in Sports & Exercise, 35, 1381–1395. doi:10.1249/01.mss.0000078924.61453.fb
- Ewing, R., & Cervero, R. (2001). Travel and the built environment - A synthesis. Journal of the Transportation Research Board, (1780), 87–114. doi:10.3141/1780-10
- Ewing, R., & Cervero, R. (2010). Travel and the built environment. Journal of the American Planning Association, 76(3), 265–294. doi:10.1080/01944361003766766
- Fotios, S., Unwin, J., & Farrall, S. (2015). Road lighting and pedestrian reassurance after dark: A review. Lighting Research and Technology, 47(4), 449–469. doi:10.1177/1477153514524587
- Frank, L. D. (2004). Economic determinants of urban form: Resulting trade-offs between active and sedentary forms of travel. American Journal of Preventive Medicine, 27(3 Suppl), 146–153. doi:10.1016/j.amepre.2004.06.018
- Frank, L. D., Sallis, J. F., Conway, T. L., Chapman, J. E., Saelens, B. E., & Bachman, W. (2006). Many pathways from land use to health: Associations between neighborhood walkability and active transportation, body mass index, and air quality. Journal of the American Planning Association, 72(1), 75–87. doi:10.1080/01944360608976725
- Frank, L. D., Stone, B., & Bachman, W. (2000). Linking land use with household vehicle emissions in the central Puget Sound: Methodological framework and findings. Transportation Research Part D: Transport and Environment, 5(3), 173–196. doi:10.1016/S1361-9209(99)00032-2
- Freedson, P. S., & Miller, K. (2000). Objective monitoring of physical activity using motion sensors and heart rate. Research Quarterly for Exercise and Sport, 71(2Suppl), S21-29. PMID: 10925821.
- Friedenreich, C. M. (2010). Physical activity and breast cancer: Review of the epidemiologic evidence and biologic mechanisms. Clinical Cancer Prevention, 125–139. Springer. doi:10.1007/978-3-642-10858-7_11
- Gorber, S. C., Tremblay, M., Moher, D., & Gorber, B. (2007). A comparison of direct vs. self‐report measures for assessing height, weight and body mass index: A systematic review. Obesity Reviews, 8(4), 307–326. doi:10.1111/j.1467-789X.2007.00347.x
- Hagströmer, M., Bergman, P., De Bourdeaudhuij, I., Ortega, F. B., Ruiz, J. R., Manios, Y., … Sjöström, M. (2008). Concurrent validity of a modified version of the International Physical Activity Questionnaire (IPAQ-A) in European adolescents: The HELENA Study. International Journal of Obesity, 32, S42–8. doi:10.1038/ijo.2008.182
- Handy, S. (2005). Critical assessment of the literature on the relationships among transportation, land use, and physical activity (Resource paper for TRB Special Report, 282). Washington D.C: Transportation Research Board and the Institute of Medicine Committee on Physical Activity, Health, Transportation, and Land Use.
- Hanson, S., & Schwab, M. (1987). Accessibility and Intraurban Travel. Environment and Planning A, 19(6), 735–748. doi:10.1068/a190735
- Henry, C. J. K., Lightowler, H. J., & Al-Hourani, H. M. (2004). Physical activity and levels of inactivity in adolescent females ages 11–16 years in the United Arab Emirates. American Journal of Human Biology, 16. doi:10.1002/ajhb.20022
- Hess, P. M., Moudon, A. V., Snyder, M. C., & Stanilov, K. (1999). Site design and pedestrian travel. Transportation Research Record, 1674, 9. doi:10.3141/1674-02
- Holtzclaw, J., Clear, R., Dittmar, H., Goldstein, D., & Haas, P. (2002). Location efficiency: Neighborhood and socio-economic characteristics determine auto ownership and Use - Studies in Chicago, Los Angeles and San Francisco. Transportation Planning and Technology, 25(1), 1. doi:10.1080/03081060290032033
- IPAQ Research Committee. (2005). Guidelines for data processing and analysis of the International Physical Activity Questionnaire (IPAQ)–Short and long forms.
- ISO 7730. (2015). Ergonomics of the thermal environment – Analytical determination and interpretation of thermal comfort using calculation of the PMV and PPD indices and local thermal comfort criteria.
- Jackson, R. J. K. C. (2002). Creating a healthy environment: The impact of the built environment on public health. Centers for Disease Control and Prevention. Retrieved from http://www.cdc.gov/healthyplaces/articles/CreatingAHealthyEnvironment.pdf. Accessed on 18 February 2016.
- Jeon, C. Y., Lokken, R. P., Hu, F. B., & van Dam, R. M. (2007). Physical activity of moderate intensity and risk of type 2 diabetes: A systematic review. Diabetes Care, 30(3), 744–752. doi:10.2337/dc06-1842
- Kahan, D. (2015). Adult physical inactivity prevalence in the Muslim world: Analysis of 38 countries. Preventive Medicine Reports, 2, 71–75. doi:10.1016/j.pmedr.2014.12.007
- Kerr, J., Eves, F., & Carroll, D. (2001). Encouraging stair use: Stair-riser banners are better than posters. American Journal of Public Health, 91(8), 1192–1193.
- Kitamura, R., Mokhtarian, P. L., & Laidet, L. (1997). A micro-analysis of land use and travel in five neighborhoods in the San Francisco bay area. Transportation, 24(2), 125. doi:10.1023/A:1017959825565
- Knuth, A. G., Bacchieri, G., Victora, C. G., & Hallal, P. C. (2009). Changes in physical activity among Brazilian adults over a 5-year period. Journal of Epidemiology and Community Health. doi:10.1136/jech.2009.088526
- Kockelman, K. (1997). Travel behavior as function of accessibility, land use mixing, and land use balance: Evidence from San Francisco Bay Area. Transportation Research Record: Journal of the Transportation Research Board, 1607, 116–125. doi:10.3141/1607-16
- Lee, I. M., Bauman, A. E., Blair, S. N., Heath, G. W., Kohl, H. W., 3rd, Pratt, M., & Hallal, P. C. (2013). Annual deaths attributable to physical inactivity: Whither the missing 2 million? The Lancet, 381(9871), 992–993. doi:10.1016/S0140-6736(13)60705-9
- Lee, I. M., Shiroma, E. J., Lobelo, F., Puska, P., Blair, S. N., & Katzmarzyk, P. T. (2012). Impact of physical inactivity on the world’s major non-communicable diseases. The Lancet, 380(9838), 219–229. doi:10.1016/S0140-6736(12)61031-9
- Lee, P. H., Macfarlane, D. J., Lam, T., & Stewart, S. M. (2011). Validity of the international physical activity questionnaire short form (IPAQ-SF): A systematic review. International Journal of Behavioral Nutrition and Physical Activity, 8(1), 1–11. doi:10.1186/1479-5868-8-115
- Mabry, R. M., Reeves, M. M., Eakin, E. G., & Owen, N. (2010). Evidence of physical activity participation among men and women in the countries of the Gulf Cooperation Council: A review. Obesity Reviews, 11(6), 457–464. doi:10.1111/j.1467-789X.2009.00655.x
- Mayer, H., & Höppe, P. (1987). Thermal comfort of man in different urban environments. Theoretical and Applied Climatology, 38(1), 43–49. doi:10.1007/bf00866252
- Montoye, H. J. (1996). Measuring physical activity and energy expenditure. Champaign, IL: Human Kinetics.
- Musaiger, A. O., Al-Mannai, M., Tayyem, R., Al-Lalla, O., Ali, E. Y. A., Kalam, F., … Chirane, M. (2013). Perceived barriers to healthy eating and physical activity among adolescents in seven Arab countries: A cross-cultural study. The Scientific World Journal, (2013, 11. doi:10.1155/2013/232164
- Nicoll, G., & Zimring, C. (2009). Effect of innovative building design on physical activity. Journal Public Health Pol, 30(S1), S111–S123. doi:10.1057/jphp.2008.55
- Nikolopoulou, M., & Steemers, K. (2003). Thermal comfort and psychological adaptation as a guide for designing urban spaces. Energy and Buildings, 35(1), 95–101. doi:10.1016/S0378-7788(02)00084-1
- Ozgunen, K. T., Kurdak, S. S., Maughan, R. J., Zeren, C., Korkmaz, S., Yazici, Z., … Dvorak, J. (2010). Effect of hot environmental conditions on physical activity patterns and temperature response of football players. Scand J Med Sci Sports, 20(Suppl 3), 140–147. doi:10.1111/j.1600-0838.2010.01219.x
- Parkin, J. C., Carey, M. F., Zhao, S., & Febbraio, M. A. (1999). Effect of ambient temperature on human skeletal muscle metabolism during fatiguing submaximal exercise. Journal of Applied Physiology 86(3), PMID: 10066703. doi:10.1152/jappl.1999.86.3.902
- Pate, R. R., Pratt, M., Blair, S. N., Haskell, W. L., Macera, C. A., Bouchard, C., ... Wilmore, J. H. (1995). Physical activity and public health: A recommendation from the centers for disease control and prevention and the American College of Sports Medicine. JAMA, 273(5), 402–407. doi:10.1001/jama.1995.03520290054029
- Pinelo Silva, J. (2017). Solar radiation and street temperature as function of street orientation. An analysis of the status quo and simulation of future scenarios towards sustainability in Bahrain. In World Renewable Energy Congress-17- E3S Web of Conferences - Bahrain, 2016 (p. 15). doi: 10.1051/e3sconf/20172302002.
- Rahim, H. F. A., Sibai, A., Khader, Y., Hwalla, N., Fadhil, I., Alsiyabi, H., … Husseini, A. (2014). Non-communicable diseases in the Arab world. The Lancet, 383(9914), 356–367. doi:10.1016/S0140-6736(13)62383-1
- Saelens, B. E., Sallis, J. F., & Frank, L. D. (2003). Environmental correlates of walking and cycling: Findings from the transportation, urban design, and planning literatures. Annals of Behavioral Medicine, 25(2), 80–91. doi:10.1207/S15324796ABM2502_03
- Sattelmair, J., Pertman, J., Ding, E. L., Kohl, H. W., Haskell, W., & Lee, I. M. (2011). Dose-response between physical activity and risk of coronary heart disease: A meta-analysis. Circulation, 124(7), 789–795. doi:10.1161/CIRCULATIONAHA.110.010710
- Scremin, G., & Kenney, W. L. (2004). Aging and the skin blood flow response to the unloading of baroreceptors during heat and cold stress. Journal of Applied Physiology, 96, 1019–1025. doi:10.1152/japplphysiol.00928.2003
- Shephard, R. J. (2003). Limits to the measurement of habitual physical activity by questionnaires. British Journal of Sports Medicine, 37(3), 197–206.
- Smart Growth Network. (2014). This is smart growth. Retrieved February 19, 2018, from. https://www.epa.gov/sites/production/files/2014-04/documents/this-is-smart-growth.pdf
- Sobal, J. (2002). Social and cultural influences on obesity international textbook of obesity (pp. 305–322). West Sussex, UK: John Wiley & Sons.
- STEPS. (2009). National non-communicable diseases risk factors survey 2007. Bahrain. Retrieved December 12, 2015, from http://www.who.int/chp/steps/reports/en/on.
- Terwee, C. B., Mokkink, L. B., van Poppel, M. N., Chinapaw, M. J., van Mechelen, W., & de Vet, H. C. (2010). Qualitative attributes and measurement properties of physical activity questionnaires: A checklist. Sports Med, 40(7), 525–537. doi:10.2165/11531370-000000000-00000
- TimeoutBahrain. (2016). Retrieved February 10, 2016, from http://www.timeoutbahrain.com/aroundtown/features/34592-10-to-try-great-bahrain-walks
- U.S. Department of Health and Human Services. D. o. H. a. H. (2008). Physical activity guidelines for Americans.
- United Nations World Statistics Pocketbook. (2016). United Nations Statistics Division. Retrieved March 16, 2016, from http://data.un.org/CountryProfile.aspx?crName=BAHRAIN#Social
- Van Cauwenberg, J., De Bourdeaudhuij, I., De Meester, F., Van Dyck, D., Salmon, J., Clarys, P., & Deforche, B. (2011). Relationship between the physical environment and physical activity in older adults: A systematic review. Health & Place, 17(2), 458–469.
- van Poppel, M. N., Chinapaw, M. J., Mokkink, L. B., van Mechelen, W., & Terwee, C. B. (2010). Physical activity questionnaires for adults: A systematic review of measurement properties. Sports Med, 40(7), 565–600. doi:10.2165/11531930-000000000-00000
- Ward, Z. J., Long, M. W., Resch, S. C., Gortmaker, S. L., Cradock, A. L., Giles, C., … Wang, Y. C. (2016). Redrawing the US obesity landscape: Bias-corrected estimates of state-specific adult obesity prevalence. PLoS One, 11(3), e0150735. doi:10.1371/journal.pone.0150735
- World Health Organization (WHO). (2013). Global action plan for the prevention and control of noncommunicable diseases 2013–2020. Geneva: WHO Press.