
 ?Mathematical formulae have been encoded as MathML and are displayed in this HTML version using MathJax in order to improve their display. Uncheck the box to turn MathJax off. This feature requires Javascript. Click on a formula to zoom.
Abstract
The socioeconomic and entrepreneurial characteristics of a group of 68 small (fewer than 120000 persons) U.S. counties exhibit extensive orderliness. There is a geographically-insensitive log-log (power law) relationship between the number of enterprises and enterprise richness (the number of enterprise types) in the counties. Enterprise richness is used as a proxy for productive knowledge, i.e., the explicit and tacit knowledge to produce and deliver things and services. Enterprise richness quantifies the number of times a new business idea is successfully introduced. The numbers of population, enterprises, employees in enterprises, total county employees, and higher-educated persons all scale super-linearly in relation to levels of productive knowledge. Thus, there are significant agglomeration effects associated with increases/decreases of productive knowledge. The ratios between two entrepreneurial types i.e., new and existing entrepreneurs, have been quantified in relation to the size of the counties. Smaller counties have a greater need for new entrepreneurs than for existing entrepreneurs, and the opposite is the case for larger counties. The notion that the level of poverty is related to the level of productive knowledge in countries, led to exploration of the relationship of various characteristics to poverty levels in the selected counties. Poverty is an important moderating factor in the entrepreneurial wellbeing of the 68 counties. The demographic-socioeconomic-entrepreneurial nexus of U.S. counties deserves further research attention.
PUBLIC INTEREST STATEMENT
Concerns about distressed communities in the U.S., requires investigation of the potential presence of statistically significant log-log (power law) relationships between their demographic, socioeconomic and entrepreneurial characteristics. Publicly-available data sets of a group of 68 smaller U.S. counties (fewer than 120000 residents) have been used to address this issue. Power laws are present and scaling based on population numbers and on levels of productive knowledge (i.e. the ability to successfully start enterprises of types not previously present) is a common feature. Counties with more productive knowledge have disproportionately fewer enterprises but also disproportionately more people, more employees, more people with higher degrees and also more officially poor people. Smaller counties face different development challenges than larger counties. The possibility that these findings could be generally true for U.S. counties, indicates that more of this type of research is needed to enhance efforts to assist distressed communities.
1. Introduction
Hausmann et al. (Citation2017) developed an atlas of the economic complexity of most countries of the world. The atlas provides estimates of the level of productive knowledge of each country. They stated: “The social accumulation of productive knowledge has not been a universal phenomenon. It has taken place in some parts of the world, but not in others. Where it has happened, it has underpinned an incredible increase in living standards. Where it has not, living standards resemble those of centuries past. The enormous income gaps between rich and poor nations are an expression of the vast differences in productive knowledge amassed by different nations. These differences are expressed in the diversity and sophistication of the things that each of them makes.”
Productive knowledge is not book learning but knowledge to manufacture products or deliver services stemming from practice and experience. There are two kinds of knowledge: explicit and tacit (Hausmann et al., Citation2017). Explicit knowledge can be transferred easily by reading a text or listening to a conversation. Tacit knowledge is hard to embed in people. It comes from years of experience more than from years of schooling. Tacit knowledge forms an important part of productive knowledge.
Increasing productive knowledge increases the economic complexity of societies. The mix of products that countries are able to make is important (Hausmann et al., Citation2017) and is reflected in countries’ business diversity. Producing new things is quite different from producing more of the same (Hausmann & Klinger, Citation2006, p. 1). Schumpeter (Citation1942, p. 83) states: “… the same process of industrial mutation—if I may use that biological term—that incessantly revolutionizes the economic structure from within, incessantly destroying the old one, incessantly creating a new one.” Innovation leading to new products and/or services expands business diversity and builds productive knowledge.
In biology, diversity is measured by recording the number of species, by describing their relative abundances or by using a measure that combines the two components (Magurran, Citation1988). Spellberg and Fedor (Citation2003) suggested that the term “species richness” should be used to refer to the number of natural species in a given area or in a given sample. Toerien and Seaman (Citation2014) adopted use of the term enterprise richness to express the diversity of or number of business types in geographic locations, e.g. in human settlements. (For simplicity’s sake in the rest of this contribution, the term enterprise includes the term [business] establishment, often used in U.S. statistical business data).
The abundances of enterprise types across U.S. metropolitan statistical areas (MSAs) (metropolitan cities with at least 50 000 residents) were investigated by Youn et al. (Citation2016). They reported that the number of enterprise types increases logarithmically with the number of enterprises but eventually levels off due to limits inherent to the North American Industry Classification Scheme to fully capture the true extent of economic diversity in megacities. Toerien and Seaman (Citation2014) studied the enterprise richness (i.e. the number of enterprise types) of South African towns. Enterprise types were identified with the help of a database of more than 600 examples of enterprise types. They recorded a statistically significant (p < 0.01) power law (log-log) relationship between total enterprises (a measure of town size) and the enterprise richness of the South African towns. This relationship is not geographically sensitive (Toerien & Seaman, Citation2014), has endured over some seventy years (Toerien, Citation2017) and allows calculation of the ratio between two entrepreneurial types as a function of the size of towns: entrepreneurs that develop products or services that have not been present before in a locality (i.e., “new entrepreneurs”), and, entrepreneurs that start additional enterprises of types already present (i.e., “existing entrepreneurs”) (Toerien, Citation2015, Citation2017).
Toerien (Citation2018a) argued that enterprise richness could be used as a proxy measurement of the productive knowledge in South African towns because it indicates the number of times entrepreneurs have been able to successfully conceive and implement new business opportunities involving enterprise types new to these towns. In other words, they have gone beyond “more of the same”. The quantification of the relationship between enterprise richness and total enterprises, therefore, provided insight into business diversity and successful innovation outcomes in South African towns (Toerien, Citation2017; Toerien & Seaman, Citation2014).
1.1. Productive knowledge, innovation and people
Productive knowledge obviously involves people. Moretti (Citation2017, p. 12) comments: “Fifty years ago, manufacturing was the driver of growth, the one sector responsible for raising the wages of American workers, including local service workers. Today the innovation sector is the driver.” Moretti (Citation2017, p. 56) explained: “[T]he vast majority of jobs in a modern society are in local services. People who work as waiters, plumbers, nurses, teachers, real estate agents, hairdressers, and personal trainers offer services that are produced and consumed locally. This sector exists only to serve the needs of a region’s residents and is largely insulated from national and international competition. Economists call this the non-traded sector. Such jobs are ‘non-tradable’ because they cannot be exported outside the region where they are produced: you need to consume them where you produce them”. Moretti (Citation2017, p. 57) added: “By contrast, most jobs in the innovative industries belong to the traded sector, together with jobs in traditional manufacturing, some services—parts of finance, advertising, publishing—and agricultural and extractive industries such as oil, gas, and timber.” He explained; “These jobs, which account for about a third of all jobs, are very different because they produce a good or service that is mostly sold outside the region and therefore needs to be competitive in the national and global marketplace”. Additionally, Moretti (Citation2017, p. 57) commented: “The paradox is that while the vast majority of jobs are in the non-traded sector, this sector is not the driver of our prosperity. Instead our prosperity mainly depends on the traded sector”. The application of productive knowledge that results in tradable products and/or services is important and should be considered in relation to human settlements.
Florida (Citation2002, p. xix) pointed out: “For most of human history, wealth came from a place’s endowment of natural resources, like fertile soil or raw materials. But today, the key resource, creative people, is highly mobile”. Creative people, innovation and employment are tightly linked. Cities are the greatest invention of humankind and are gateways for ideas (Glaeser, Citation2011). The relationship between human settlements and creative people needs consideration.
1.2. Scaling impacts in urban environments
According to a research group at the Santa Fe Institute, cities are extremely complex systems with many interdependent facets, e.g. social, economic, infrastructural, and spatial characteristics (Bettencourt, Lobo, Helbing, Kühnert, & West, Citation2007a, Bettencourt, Lobo, & Strumsky, Citation2007b; Bettencourt, Lobo, Strumsky, & West, Citation2010; Bettencourt & West, Citation2010; West, Citation2017). Cities have traditionally been compared on a per capita basis, which assumes implicitly that, on average, specific urban characteristics increase linearly with population size. This is true to an extent. For instance, Youn et al. (Citation2016) found that the total number of enterprises in each MSA in the U.S. is linearly proportional to its population size. Toerien and Seaman (Citation2012a, Citation2012b) reported the same for South African towns. In U.S. cities, there is approximately one enterprise for every 22 people per city, regardless of its size (Youn et al., Citation2016). The number of employees scales approximately linearly with enterprise numbers and there are approximately 7.9 employees per enterprise.
The per capita approach is, however, not suitable for the universal characterization and comparison of cities because it ignores the phenomenon of people-based agglomeration of characteristics (Bettencourt et al., Citation2010; Ortman, Cabaniss, Sturm, & Bettencourt, Citation2014). Cities are more than the linear sum of their individual components and larger cities with an agglomeration of creative people are disproportionally the centres of innovation, wealth and crime (Bettencourt et al., Citation2010). As the populations of cities grow, major innovation cycles must be generated at a continually accelerating rate to sustain growth and avoid stagnation or collapse (Bettencourt et al., Citation2007a). On the other hand, smaller cities require relatively more infrastructural development than larger cities (West, Citation2017).
The agglomeration characteristics of modern cities take a simple mathematical form (Bettencourt et al., Citation2007a). For example, based on population, N(t), as the measure of city size at time t, the scaling power law is:
Y can denote material resources (such as energy or infrastructure) or measures of social activity (such as wealth, patents, and pollution); Y0 is a normalization constant. The exponent, β, reflects general dynamic rules at play across the urban system.
Robust and commensurate scaling exponents have been recorded across different nations, economic systems, levels of development, and recent time periods for a wide variety of indicators (Bettencourt et al., Citation2007a). Measures of the physical extent of urban infrastructure increase more slowly than city population size, thus exhibiting economies of scale. They scale sub-linearly (West, Citation2017). Regardless of where a city is located and regardless of the specific metric used, only about 85% more material infrastructure is needed for every doubling of city populations. On the other hand, various socioeconomic outputs increase faster than population size and thus exhibit increasing returns to scale. They scale super-linearly (West, Citation2017), which is typical of open-ended complex systems (Ortman, Cabaniss, Sturm, & Bettencourt, Citation2015). The exponents of the latter power laws for cities are always in the order of 1.15 (West, Citation2017).
As mentioned before, Toerien and Seaman (Citation2014) and Toerien (Citation2017) recorded statistically significant power law relationships between total enterprises and the enterprise richness (productive knowledge) in South African towns. The coefficients of these power laws are all sub-linear indicating that the ratio of enterprise types to total enterprises is proportionally higher in smaller towns than in larger towns. Inverting the power law between enterprise richness and enterprise numbers, enables investigation of the scaling of enterprise numbers in comparison to changes in enterprise richness. The coefficients of such power laws recorded for South African towns (Toerien, Citation2018b) are super-linear (more than 1.35) and a strong scaling effect was recorded. It is unknown if this is also the case in smaller human settlements in developed countries.
Toerien (Citation2018a, Citation2018b) also demonstrated that a given level of enterprise richness (productive knowledge) could be associated with more than one level of population numbers in South African towns. The use of a community wealth/poverty measurement (the enterprise dependency index) enabled a demonstration that differences in the wealth/poverty states of towns play an important role in entrepreneurial dynamics (Toerien, Citation2018b). Poorer towns with the same level of enterprise richness (productive knowledge) than richer towns, have proportionally larger populations in step with their poverty levels.
1.3. Purpose and organization of this contribution
Bettencourt and West (Citation2010) stated: “At the start of the twenty-first century, cities emerged as the source of the greatest challenges that the planet has faced since humans became social.” Large cities manifest remarkably universal, quantifiable features (Bettencourt et al., Citation2007a). The South African research reviewed above extend the findings of the Santa Fe research group on large cities by revealing links in South African towns between demography, entrepreneurial dynamics, productive knowledge and poverty.
Are the links detected in South Africa (a developing country) also present in the towns of developed countries? Unfortunately, the necessary demographic, socioeconomic and entrepreneurial data to investigate this question is not publicly available for towns in the U.S., a developed country. The smallest human settlements for which such data is available are counties, which are used instead. The prime purpose of this contribution is accordingly to provide information about an initial quantitative exploration of the above links in a group of U.S. counties. In particular, the links between productive knowledge (enterprise richness) and other important socioeconomic characteristics of the selected counties, and, the impact of the wealth/poverty states on such links are explored.
The contribution is organized as follows: The methods are described in the following section and then the relationship between enterprise numbers and enterprise richness is examined. The resulting power law is inverted to examine entrepreneurial activities in relation to enterprise richness. The geographic sensitivity of this relationship is then examined. The enterprise numbers-enterprise richness power law is used to quantify the requirements of two different entrepreneurial types, i.e. “new” and “existing” entrepreneurs as functions of the total number of enterprises in counties. Thereafter the scaling impacts associated with increased/decreases of productive knowledge (enterprise richness) are examined: firstly, in terms of enterprises and jobs, and, secondly, in terms of other socioeconomic characteristics of the selected counties. This is followed by an analysis of the role of the wealth/poverty states (measured as enterprise dependency indices) of counties on their demographics-entrepreneurship nexuses. A discussion and conclusions then follow.
2. Methods
2.1. Selection of the group of counties
Only three criteria were used to select a group of 68 counties for the exploration. Firstly, to avoid the problem encountered by Youn et al. (Citation2016) that 6-digit NAICS data may be inadequate to fully quantify the number of enterprise types present in a county, use is only made of smaller counties (fewer than 120000 people). This reduces the risk that NAICS data contained in the County Business Pattern (CBP) datasets used (described later) would be inadequate for classification purposes. Secondly, to examine the geographic sensitivity of the results, counties were selected from seven states that roughly cover the geographic distribution of states in the U.S. (Table ). The states are: Alabama (the South), California (the West), Kansas and Missouri (the Mid-West), Maine (the North-East), Maryland (the Eastern Seaboard) and Minnesota (the North). Thirdly, the NAICS data for a selected state was used starting at the first county in its database. If the county met the criteria, its data was used, and then the second county followed, etc. No other considerations entered into the selection of counties. Groups of about 10 counties per state were selected (Table ) except Maine with only four counties with fewer than 120000 people. In broad terms, the selection process of the group of counties was basically random and the group of 68 is large enough to serve the purposes of the exploration.
Table 1. The U.S. states and counties selected for analysis
For each county, the total number of enterprises and the number of their employees were extracted from the datasets. The number of separate 6-digit enterprise classifications in the dataset of each county provided the quantification of its enterprise types (enterprise richness).
2.2. Business pattern datasets
The County Business Pattern (CBP) datasets (U.S. Census Bureau, Citation2018a) provide essential information for this analysis. CBP is an annual series that provides U.S. subnational economic data by industry. The datasets contain information about all U.S. counties, including the numbers of their enterprises. The NAICS system used in CBP analyses uses a 6-digit system to classify the enterprises in the datasets into different business types and to enumerate the number of enterprises. The CBP 2016 basic dataset is used in this exploration.
Quick Facts (U.S. Census Bureau, Citation2018b) provides further socioeconomic information on U.S. counties. Information used in this exploration includes: 1. estimated population in 2016, 2. total employment per county (which is more than the number of employees associated with enterprises), 3. total personal income (average personal income for a county multiplied by its population number), 4. the number of poor people per county (the percentage of poor people multiplied by the population number), and 5. number of people with bachelor degrees or higher per county (the percentage of population with such degrees multiplied by the population number).
2.3. Normalization of parameters
A meaningful comparison between cities should rely on relative quantities rather than on their absolute values (Bettencourt et al., Citation2007b). Consequently, the characteristics of the 68 counties were first normalized by division with their average values before being subjected to log-log regression analyses to determine if power laws are present.
2.4. Relationships between enterprise richness and total enterprises
Normalized enterprise numbers and normalized enterprise richness values were subjected to log-log power law analyses. After a statistically significant power law was demonstrated between total enterprise numbers and enterprise richness, the inverse power law between enterprise richness and total enterprise numbers was investigated.
2.5. Geographic sensitivity of the enterprise richness—enterprise numbers power law
The geographic sensitivity of the relationship between normalized enterprise richness and normalized enterprise numbers is investigated by plotting the data of all counties in a single graph.
2.6. County enterprise richness, entrepreneurial spaces and impacts of enterprise richness
The power law between enterprise richness and enterprises is used to plot the number of enterprise types against total enterprise numbers (see Toerien, Citation2015, Citation2017 for applications). This enables quantification of the ratio of “new entrepreneurs” relative to “existing entrepreneurs” for differently-sized urban settlements. New entrepreneurs are represented by the number of enterprise types, which indicates how many times a specific enterprise type has been successfully started and has endured in a specific county. Existing entrepreneurs represent the difference between total enterprise numbers and the number of enterprise types for a specific county.
Two relationships are used to assess the impacts of changes in enterprise richness (i.e. productive knowledge) on enterprise numbers and employment numbers: 1. the enterprise richness-enterprise numbers power law, and, 2. a linear enterprise numbers-total employment relationship. At different levels of urban size (measured as total enterprises) the impact of a single additional new enterprise type is firstly calculated in terms of additional enterprises and then in terms of additional jobs.
2.7. Per capita-based linear regularities
Linear per capita indicators are often used to characterize and rank cities (Bettencourt et al., Citation2010). Ordinary least squares regression analyses of per capita data are used where appropriate in this exploration.
2.8. Scaling in relation to enterprise richness (productive knowledge)
Scaling impacts associated with increases in enterprise richness (productive knowledge) of South African towns (Toerien, Citation2017, Citation2018a, Citation2018b; Toerien & Seaman, Citation2014) necessitated exploration of the scaling of socioeconomic characteristics relative to enterprise richness in the group of counties. Characteristics investigated are: total populations of counties, employee numbers of enterprises in counties, total income in counties, total employment in counties, numbers of (officially) poor persons in counties, and numbers of people with bachelor of higher degrees in counties. The data was derived from Quick Facts (U.S. Census Bureau, Citation2018b).
Normalized enterprise richness values and normalized values of the selected characteristics were subjected to log-log regression analyses. When power laws were recorded, it was noted if their coefficients are super-linear (exponent > 1), linear (exponent ~ 1) or sub-linear (exponent < 1).
2.9. The impact of wealth/poverty on the demographic and entrepreneurial nexus
The enterprise dependency indices of the counties were calculated from their population numbers and the number of their total enterprises. The total enterprise numbers of the selected counties were sourced from the CBP 2016 dataset (U.S. Census Bureau, Citation2018a) and together with population numbers for 2016 sourced from Quick Facts (U.S. Census Bureau, Citation2018b) allowed calculation of enterprise dependency indices. Lower values are indicative of more wealth and higher values of more poverty.
For determination of the impacts of wealth/poverty, the enterprise dependency indices of the 68 counties were ranked and the counties were then binned into three groups: 1. low enterprise dependency indices (<40), i.e. the richer group; 2. intermediate enterprise dependency indices (40–60), i.e. the intermediate group; and 3. high enterprise dependency indices (>60), i.e. the poorer group. Each group of counties contains a range of population sizes that enables separate calculation of their enterprise richness-population number power laws. The different power laws allow assessment of the influence of the wealth/poverty states on the demographic, socioeconomic and entrepreneurial nexuses of the selected U.S. counties.
3. Results
3.1. The relationship between enterprise numbers and enterprise richness
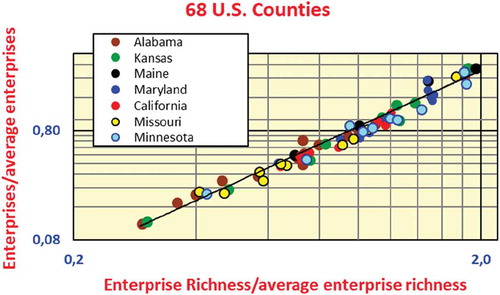
The enterprise numbers of the 68 counties ranged from 103 to 2698 and their enterprise richness ranged from 68 to about 450. The wide ranges of both characteristics enabled an investigation of the relationship between enterprise numbers and enterprise richness. The normalized enterprise numbers and normalized enterprise richness are linked in a statistically significant (p < 0.01) power law (Figure ) with a sub-linear exponent of 0.57. Every doubling of the normalized enterprise numbers of the counties corresponds to an increase of 48,2% in the value of the normalized enterprise richness. A statistically significant power law between enterprise numbers and enterprise richness was also reported for South African towns (Toerien & Seaman, Citation2014). Its coefficient was also sub-linear.
Figure 1. The power law relationships between normalized enterprise richness and the normalized number of enterprises of 68 U.S. counties. Normalization was done by division with the averages of the characteristics
The inverse of the above relationship:
is also a power law with R2 = 0.9674 and n = 68. Increases in normalized enterprise richness (or productive knowledge) corresponds to proportionally larger increases of normalized enterprise numbers. Scaling in relation to enterprise richness is strongly super-linear (coefficient = 1.7038). For every doubling of the normalized enterprise richness the value of normalized enterprise numbers more than triples (3.26 times). Innovation leading to additional productive knowledge (i.e. the ability to identify and exploit new business opportunities) should have large spill-over effects as suggested by Moretti (Citation2017). Large spill-over effects are typical of open-ended complex systems (Ortmann et al., Citation2015; West, Citation2017).
The normalized enterprise richness-normalized enterprise numbers relationship is not geographically sensitive. It holds for counties from widely differing geographic areas in the U.S (Figure ). The same was reported for regions in South Africa (Toerien & Seaman, Citation2014). It is possible that this relationship might be generally true for small U.S. counties, but this suggestion needs further research confirmation.
Figure 2. The geographic insensitivity of the relationship between enterprise richness and the number of enterprises of 68 U.S. counties. The line represents the power law for 68 counties from different parts of the United States
3.2. New versus existing entrepreneurship
The fraction (deduced from EquationEquation (2)(2)
(2) ) that the number of enterprise types forms of the total enterprises of the different counties, indicates how entrepreneurial space for new enterprise types and existing enterprise types increases/decreases with increases/decreases of size of counties (full and broken lines in Figure ). The fraction closely corresponds with the actual ratios observed in the counties (dots and triangles in Figure ). It illustrates how innovative new entrepreneurship (i.e. the ability to identify possibilities of new enterprise types that could be successfully launched) as opposed to existing entrepreneurship (i.e., launching just more of the enterprise types already present), contributes to the expansion of the total number of enterprises. On the other hand, conditions leading to a loss of enterprises in a county, should result in a loss of some enterprise types.
Figure 3. Entrepreneurial spaces for new (full line) and existing (broken line) enterprise types predicted from EquationEquation (1)(1)
(1) and compared to observed values (triangles and diamonds) for the 68 counties
For economic growth in small counties, there is a high requirement for new enterprise types (Figure ). This requirement is progressively lowered as counties grow. At about 250 enterprises there still is a requirement for 50% new versus 50% existing enterprise types. A pareto distribution of 20% new to 80% existing enterprise types is reached by about 2200 enterprises. Importantly, expansion of total enterprise numbers in the 68 counties is always associated with the founding of new enterprise types and is, therefore, associated with the expansion of productive knowledge. This is in step with the views of Bettencourt et al. (Citation2010), Moretti (Citation2017), West (Citation2017) and others about innovation as a driver of prosperity in the U.S. On the other hand, a loss of productive knowledge in counties, should result in fewer enterprises.
3.3. Spill-over impacts associated with increases/decreases of productive knowledge
EquationEquation (2)(2)
(2) allows calculation of increases/decreases of enterprise richness of the counties in relation to their total enterprise numbers (Table ). In addition, the total number of enterprises and total employment numbers of the 68 counties are linearly correlated (p < 0.01):
Table 2. The impact of the addition or loss of a single enterprise richness unit on enterprise and employment numbers of counties with different enterprise richness and enterprise levels
with r = 0.94 and n = 68. The proportionality coefficient of this equation is used to express the number of additional/fewer enterprises that would result from an increase/decrease of a single unit of enterprise richness (i.e. productive knowledge) at different county sizes. The number of additional enterprises is then related to additional employment opportunities (Table ).
The impacts on total enterprise numbers and total employment numbers that correspond with increases/decreases in enterprise richness are large (Table ). For instance, in a small county (enterprise richness of 100 and 181 enterprises), the addition or loss of one enterprise type will be associated with three additional enterprises and 45 additional jobs. In a larger county (~ 2800 enterprises), the addition or loss of one enterprise type will be associated with the addition or loss of nine additional enterprises and more than 130 jobs. This provides further quantitative proof of the large impact of additional or reduced innovation in U.S. urban settlements (e.g. Bettencourt et al., Citation2010; Moretti, Citation2017; West, Citation2017).
3.4. Further scaling impacts associated with changes in productive knowledge
Statistically significant (p < 0.01) power laws have been recorded in all comparisons based on enterprise richness (Table ). All coefficients of these power laws are strongly super-linear, ranging from 1.32 (the number of people in poverty) to 1.95 (for total employment and number of degree holders) and are indicative of open-ended systems (Ortman et al., Citation2015). They also reflect the large impacts from additional or reduced innovation and the benefits/detriments of attracting/not attracting highly qualified people (Bettencourt et al., Citation2010; Moretti, Citation2017). The R2-value (0.57) of the power law between enterprise richness and the number of poor people explains less of the variation than those of the other power laws, which range from 0.82 to 0.97 (Table ). However, it still serves as a further indication that agglomeration of poor people corresponds with higher levels of productive knowledge.
Table 3. Power laws observed between normalized enterprise richness and other normalized characteristics of 68 U.S. counties. All relationships are statistically significant (p < 0.01, n = 68)
3.5. Poverty as a mitigating influence
There is a statistically significant power law relationship between enterprise richness and population in the 68 counties (Figure ). However, only 82% of the variation is explained by the power law (Figure ) and the data points of the relationship are not as densely concentrated as those for the enterprise numbers-enterprise richness relationship (Figure ).
Figure 4. The power law relationship between enterprise richness and populations of 68 counties
In a study of small towns in South Africa, Toerien (Citation2018b) showed that the wealth/poverty states (measured as enterprise dependency indices) of these towns influenced the relationship between enterprise richness and town populations. Binning the selected counties into three wealth/poverty groups in this exploration: (1. enterprise dependency index < 40; 2. enterprise dependency index 40–60; 3. enterprise dependency index > 60) enabled calculation of the power law of each of the binned group (Figure ). The binning reduced the spread of data within the power laws. R2-values for the binned groups range from 0.91 to 0.97, whilst the R2-value of all counties is 0.82. The super-linear exponents of the power laws increase from 1.43 (poorer counties) through 1.59 (intermediate counties) to 1.86 (richer counties). Increasing wealth levels (i.e. increasing ability to buy from local enterprises) were proportionally in step with enhanced magnitudes of the power law exponents (Figure ). Increasing wealth in a community apparently increases spill-over impacts whilst increasing poverty decreases them.
Figure 5. The moderating influence of wealth/poverty on the power law relationships between county enterprise richness and county populations. Three groups are used: enterprise dependency index < 40 (wealthier group), enterprise dependency index 40–60 (intermediate group) and enterprise dependency index > 60 (poorer group)
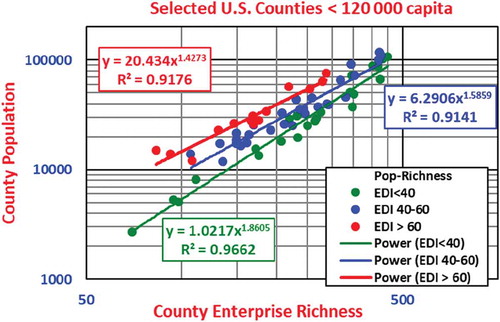
The constants of the equations also changed progressively from 1.02 (richer counties) through 6.29 (intermediate counties) to 20.43 (poorer counties). Increasing poverty was associated with positional shifts of the power laws in Figure .
Are the wealth/poverty impacts important? Table shows that they are, especially in smaller counties. An enterprise richness of 100 corresponds with 181 enterprises in the selected counties. Approximately 2.72 times more people (i.e. 14620 versus 5374 persons) would be needed to “carry” the 181 enterprises at an enterprise dependency index larger than 60 than at an enterprise dependency index of less than 40. This ratio diminishes steadily as enterprise richness and enterprise numbers increase, but at an enterprise richness of 500 and just more than 1920 enterprises, the ratio is still 1.36 (145410 versus 107339 persons) (Table ). Wealth/poverty levels appear to be important influencers of the local economic dynamics in the 68 counties.
Table 4. The influence of the wealth/poverty states (enterprise dependency indices) on the number of people needed in the 68 counties to carry the enterprises related to different enterprise richness values
3.6. Validity of enterprise dependency index
One can ask if the enterprise dependency index provides a valid measurement of the wealth/poverty states of counties. For an answer it is necessary to examine the relationship between the normalized number of poor people (according to official U.S. norms) and the normalized number of enterprises in the counties. This comparison reveals a statistically significant (P < 0.01) power law relationship (Figure ). The exponent (0.759) is sub-linear, indicating that the rate of increase in enterprise numbers does not match the rate of increase in poverty. In other words, as the number of poor people increases, the population apparently becomes less able to “carry” the same number of enterprises, indicative of a negative impact of poverty. Since enterprise dependency indices are partly based on the number of enterprises and the latter is related to the number of poor people in a county (Figure ), the enterprise dependency index should be a valid measure of the wealth/poverty state of U.S. counties.
Figure 6. The power law relationship between the normalized number of poor people and the normalized number of enterprises in the 68 U.S. counties
4. Discussion
The socioeconomic characteristics of a group of small U.S. counties exhibit extensive orderliness, manifested by a range of statistically significant and mostly log-log regression analyses (power laws). This is generally similar to what was recorded by the Santa Fe group for cities in the U.S. and elsewhere (Bettencourt, Citation2013; Bettencourt et al., Citation2007a, Citation2007b, Citation2010; Bettencourt, Samaniego, & Youn, Citation2014; Bettencourt & West, Citation2010; Ortman et al., Citation2015; West, Citation2017, Youn et al., Citation2016). This orderliness enabled the exploration of the links between productive knowledge, a driver of the economic fates of nations (Hausmann et al., Citation2017), and a number of socioeconomic characteristics of the group of U.S. counties.
The positive correlations that were recorded do not necessarily imply causality between the various characteristics, but merely that the variation patterns are similar when two characteristics are analysed in a regression analysis. However, Mayer-Schönberger and Cukier (Citation2014, p. 14) state: “In a big data world one does not have to be fixated on causality. Instead one can discover patterns and correlations in data that offer novel and invaluable insights. The correlations may not tell one precisely why something is happening, but they alert one to the fact that it is happening.” The orderliness detected in this exploration, therefore, alerts to what is happening in the group of small U.S. counties and not necessarily why it is happening. The latter needs further research.
Toerien and Seaman (Citation2014) and Toerien (Citation2017) reported a power law relationship between total enterprise numbers and enterprise diversity (i.e., enterprise richness) in South African towns. To avoid the limitations of the six-digit NAICS system (United States, Citation2017) to define enterprise types adequately as experienced by Youn et al. (Citation2016), the present exploratory analysis of a group of U.S. counties focused on counties with fewer than 120 000 residents (Table ). This strategy succeeded and a power law relationship between enterprise numbers and enterprise richness was detected (Figure ). The South African power laws had sub-linear coefficients. This is also the case for the group of selected U.S. counties (Figure ).
The relationship between enterprise richness and the enterprise numbers of the 68 selected counties is not geographically sensitive (Figure ). This was also observed for South African towns (Toerien & Seaman, Citation2014). This phenomenon should be investigated in more counties and if the relationship is indeed geographically insensitive, it would add substantial predictive power about the enterprise dynamics in U.S. counties. However, the limitations of classification systems such as NAICS to adequately identify all business types (Youn et al., Citation2016) would have to be overcome to assess if the relationship also holds for large counties.
Producing new things is quite different from producing more of the same (Hausmann & Klinger, Citation2006). Enterprise richness measures the entrepreneurial ability to produce products and services that are not yet present in human settlements. Enterprise richness can, therefore, serve as a proxy measurement of the levels of productive knowledge in human settlements (Toerien, Citation2018a, Citation2018b). Inverting the power law in Figure produces EquationEquation (2)(2)
(2) , which links the concept of productive knowledge (Hausmann et al., Citation2017) (as enterprise richness) to entrepreneurial activities in human settlements (as total number of enterprises). The recorded power law has a strong super-linear coefficient: scaling is present and larger counties have disproportional higher numbers of enterprises. This supports the suggestion that inventive activity is an important attribute of larger human settlements (e.g. Bettencourt et al., Citation2007a, Citation2007b; Bettencourt & West, Citation2010). This power law is also typical of open-ended complex systems (Ortman et al., Citation2015; West, Citation2017).
The approach described above, enabled further exploration of the scaling of socioeconomic characteristics of the selected counties in relation to changes in the level of productive knowledge. Increases in productive knowledge of the counties are associated with disproportionate and sizeable increases (i.e. scaling) in some socioeconomic characteristics because the exponents of the statistically significant applicable power laws are in the order of 1.5 or higher (Table ). The numbers of people, enterprises, jobs in enterprises, total jobs in counties, and numbers of highly educated persons agglomerate disproportionally in counties with higher productive knowledge. Total county income and the number of officially poor people also scale super-linearly when compared to increases in enterprise richness. These results seem to be in step with the following ideas: growth is not simply having an economy with a large number of people but rather how their capabilities are integrated by the environment they create and live in (Romer, Citation1990). Knowledge spill-overs among individuals and firms supply the underpinnings of growth (Romer, Citation1986) and larger cities are environments that support and sustain more social interactions per unit time (Florida, Citation2002; Ortmann et al., Citation2014; West, Citation2017). The creation and repositioning of knowledge in the selected counties apparently increase their attraction for educated, highly skilled, entrepreneurial and creative individuals.
The power law in EquationEquation (2)(2)
(2) was used to predict the impacts associated with the addition/reduction of a single additional enterprise richness unit to the enterprise richness pools of differently-sized counties on enterprise and employment numbers of the counties (Table ). The spill-over impacts on the total number of enterprises and total employment numbers are large and increase/decrease in step with size increases/decreases of counties. This analysis also quantitatively confirms that innovation is enhanced when counties grow larger as has previously been suggested for cities (Bettencourt et al., Citation2007a, Citation2007b; Citation2010; Florida, Citation2002; Glaeser, Citation2011; Moretti, Citation2017; West, Citation2017). Conversely, when cities regress, there is a los of innovative capacity.
In the small selected counties (< 250 enterprises), the majority of entrepreneurs must be able to conceive and start businesses of types not yet present (Figure ). Similar results were reported for South African towns (Toerien, Citation2017; Toerien & Seaman, Citation2014). The need for new entrepreneurs in smaller human settlements is a daunting challenge because entrepreneurs in these settlements have limited or no role models to copy or learn from. However, even in the largest selected counties the requirement for entrepreneurs who can conceive and start enterprises of types not yet present, remains part of a growth challenge. This emphasises the importance of being able to produce new things (Hausmann & Klinger, Citation2006) that are tradable (Moretti, Citation2017). On the other hand, reduction of enterprise numbers in the selected counties should result in losses of some enterprise types.
A question can be raised about the reason why there is such a distinct relationship between enterprise richness and the number of enterprises of South African towns as well as in the selected group of U.S. counties. There is no clear answer to this question yet. This situation is, however, not unknown in geographic economics. Krugman (Citation1996) remarked about the agglomeration phenomenon of people in cities (referred to as Zipf’s law): “At this point we are in the frustrating position of having a striking empirical regularity with no good theory to account for it.” This is presently also the case for the relationships between enterprise numbers and enterprise richness.
However, West (Citation2017) remarked that scaling analysis, which quantifies how characteristics agglomerate in response to changes in the size of systems, has been a powerful tool across a broad spectrum of science and technology research. Its analytical punch stems from the observation that this response is often a simple, regular, and systematic function over a wide range of sizes, indicating that there are underlying generic constraints at work on the system as it develops (Lobo, Bettencourt, Strumsky, & West, Citation2013). The number of scaling phenomena when compared to increases/decreases in enterprise richness (productive knowledge) in the selected counties (Table ) suggests that the generic constraints observed for cities (Lobo et al., Citation2013) might also play a role in U.S. counties.
A lack of productive knowledge is associated with poverty in countries (Hausmann et al., Citation2017). Increased poverty should, therefore, equate with lower levels of productive knowledge, which has been demonstrated for a group of South African towns (Toerien, Citation2018a). The present exploration indicates that increased poverty in the selected U.S. counties is associated with fewer enterprises (Figure ), which corresponds with a lower enterprise richness (less productive knowledge) (Figure ). An enterprise dependency index was used as an indicator of the wealth/poverty states of the selected counties (e.g. Figure ). Enterprise numbers scale sub-linearly relative to increases/decreases of the numbers of officially poor persons in the selected counties (Figure ). This observation justifies the use of the enterprise dependency index in this comparison because the index relates the number of enterprises in a county to the number of people in the county. Counties with proportionally more poor people “carry” fewer enterprises. It was also shown that increased poverty (shown by higher enterprise dependency indices) alters the power law relationship between enterprise richness and county populations (Figure ). The exponents and the proportionality constants of the power laws increase/decrease in relation to changes in the wealth/poverty states of the counties. The wealth/poverty states of the selected counties, therefore, has a strong moderating influence on their entrepreneurial success (Table ) and this might be generally true for all U.S. counties.
Why do poor people agglomerate in larger cities? Large cities are not full of poor people because cities make people poor, but because cities attract poor people with the prospect of improving their lot in life (Glaeser, Citation2011). They come for jobs (Glaeser, Citation2011; West, Citation2017). The migration of rural people to urban settlements, wherever it occurs, is linked to people seeking better opportunities. This also seems to be the case in the group of counties.
5. Conclusions
The socioeconomic and entrepreneurial characteristics of 68 small U.S. counties exhibit extensive orderliness. This is similar to findings about South African towns. A power law with a sub-linear coefficient quantified the relationship between enterprise richness and total enterprise numbers of these counties. Larger counties have fewer enterprise types relative to total enterprise numbers compared to smaller counties. This power law is not geographically sensitive, which suggests that it might apply widely to U.S. counties.
The inverse of the former power law enables linking of the concept of productive knowledge (Hausmann et al., Citation2017) with entrepreneurial activities in the 68 counties. In the selected counties, some socioeconomic characteristics scale disproportionally in comparison to increases/decreases of productive knowledge (measured as enterprise richness). These socioeconomic characteristics are: population numbers, enterprise numbers, number of employees associated with the enterprises, total county employment, the number of higher-educated people and the number of officially poor persons. These characteristics scale super-linearly in comparison to increases/decreases in productive knowledge. Counties with more productive knowledge have proportionally more of these characteristics than counties with lesser productive knowledge, and vice versa. The level of productive knowledge in U.S. counties might be an important driver of their entrepreneurial dynamics.
Two entrepreneurial types were identified in the group of counties: new and existing entrepreneurs. In smaller counties there is a greater need for new entrepreneurs that start enterprises of types not yet present than for existing entrepreneurs that start more enterprises of types already present. The need for new entrepreneurs in smaller human settlements is a daunting challenge due to a lack of role models. There is a greater need for existing entrepreneurs than for new entrepreneurs in larger counties. However, new entrepreneurs are still needed in larger counties for demographic and entrepreneurial growth.
Enterprise numbers scale sub-linearly in relation to increases/decreases in the number of officially poor persons in the selected counties. Poorer counties with a specific population number are less able to carry the same number of enterprises than richer counties with the same population number. Poverty in the group of counties moderates the relationship between productive knowledge and county population numbers and probably is an important factor in their entrepreneurial wellbeing.
This exploration has opened a window on regularities in the demographic-socioeconomic-entrepreneurial interlinkages of smaller human settlements in a developed country. The demographic-socioeconomic-entrepreneurial nexus of U.S. counties clearly deserves further research attention. The County Business Pattern (CBP) datasets are also available for longitudinal studies of the relationships between productive knowledge and important socioeconomic characteristics of U.S. counties.
Acknowledgements
The Centre for Environmental Management, University of the Free State, provided administrative and research support. Alumnus services of the Massachusetts Institute of Technology provided online scholarly journal access.
Additional information
Funding
Notes on contributors
Danie Francois Toerien
Danie Francois Toerien The past decade has been dedicated to studies of the enterprise structures and their relationships with demographic and socioeconomic characteristics of South African towns. Inordinate orderliness was detected, expressed in many different regularities/proportionalities. In particular, an enduring and geographically insensitive log-log (power law) relationship was detected between the total number of enterprises and the number of different enterprise types. This relationship, which has been used as a proxy for productive knowledge (i.e. the ability to successfully start enterprises of types not yet present), has provided a platform for investigations of the nexus between demographic, socioeconomic and entrepreneurial characteristics and has yielded much predictability. This research was extended to the demographic, socioeconomic and entrepreneurial domains of smaller (<120000 people) counties of the U.S., a developed country. This study reveals that a seemingly geographically insensitive log-log relationship is present and could well be characteristic of all smaller human settlements in the U.S.
Related Research Data
References
- Bettencourt, L., & West, G. (2010). A unified theory of urban living. Nature, 467, 912–913. doi:10.1038/467912a
- Bettencourt, L. M. A. (2013). The origins of scaling in cities. Science, 340, 1438–1441. doi:10.1126/science.1235823
- Bettencourt, L. M. A., Lobo, J., Helbing, D., Kühnert, C., & West, G. B. (2007a). Growth, innovation, scaling, and the pace of life in cities. Pnas, 104(17), 7301–7306. doi:10.1073/pnas.0610172104
- Bettencourt, L. M. A., Lobo, J., & Strumsky, D. (2007b). Invention in the city: Increasing returns to patenting as a scaling function of metropolitan size. Research Policy, 36, 107–120. doi:10.1016/j.respol.2006.09.026
- Bettencourt, L. M. A., Lobo, J., Strumsky, D., & West, G. B. (2010). Urban scaling and its deviations: Revealing the structure of wealth, innovation and crime across cities. PloS one, 5, e13541. doi:10.1371/journal.pone.0013541
- Bettencourt, L. M. A., Samaniego, H., & Youn, H. (2014). Professional diversity and the productivity of cities. Scientific Reports, 4, 5393. doi:10.1038/srep05393
- Florida, R. (2002). The rise of the creative class. New York, NY: Basic Books.
- Glaeser, E. (2011). Triumph of the city. New York, NY: Penguin.
- Hausmann, R., Hidalgo, C. A., Bustos, S., Coscia, M., Chung, S., Jimenez, J., … Yıldırım, M. A. (2017). The atlas of economic complexity: Mapping paths to prosperity. Cambridge: Center for International Development, Harvard University.
- Hausmann, R., & Klinger, B. (2006). Structural transformation and patterns of comparative advantage in the product space (Faculty Research Working Papers Series). Cambridge: John F. Kennedy School of Government, Harvard University.
- Krugman, P. (1996). Confronting the mystery of urban hierarchy. Journal of Japanese and International Economies, 10(4), 399–418. doi:10.1006/jjie.1996.0023
- Lobo, J., Bettencourt, L. M. A., Strumsky, D., & West, G. B. (2013). Urban scaling and the production function for cities. PloS One, 8, e58407. doi:10.1371/journal.pone.0058407
- Magurran, A. (1988). Ecological diversity and its measurement. London: Crown Helm.
- Mayer-Schönberger, V., & Cukier, K. (2014). Big data: A revolution that will transform how we live, work and think. London: John Murray Publishers, London.
- Moretti, E. (2017). The new geography of jobs. Boston, MA: Mariner Books.
- Ortman, S. G., Cabaniss, A. H. F., Sturm, J. O., & Bettencourt, L. M. A. (2014). The pre-history of urban scaling. PloS One, 9, e87902. doi:10.1371/journal.pone.0087902
- Ortman, S. G., Cabaniss, A. H. F., Sturm, J. O., & Bettencourt, L. M. A. (2015). Settlement scaling and increasing returns in an ancient society. Science Advances, 1, e1400066. doi:10.1126/sciadv.1400066
- Romer, P. M. (1986). Increasing returns and long run growth. Journal of Political Economy, 94, 1002–1037. doi:10.1086/261420
- Romer, P. M. (1990). Endogenous technological change. Journal of Political Economy, 98, 71–102. doi:10.1086/261725
- Schumpeter, J. A. (1942). Capitalism, socialism and democracy (3rd ed.). New York, NY: Harper Colophon.
- Spellberg, I. F., & Fedor, P. J. (2003). A tribute to Claude Shannon (1916–2001) and a plea for more rigorous use of species richness, species diversity and the ‘Shannon–Wiener’ index. Global Ecology and Biogeography, 12, 177–179. doi:10.1046/j.1466-822X.2003.00015.x
- Toerien, D. (2018b). Productive knowledge, poverty and the entrepreneurial challenges of South African towns. South African Journal of Science, 114(11/12), 8. Art.#4765. doi:10.17159/sajs.2018/4765
- Toerien, D. F. (2015). New utilization/conservation dilemmas in the Karoo, South Africa: Potential economic, demographic and entrepreneurial consequences. In G. Ferguson (Ed.), Arid and semi-arid environments: Biogeodiversity, impacts and environmental challenges (pp. 79-123). New York, NY: Nova Science Publishers.
- Toerien, D. F. (2017). The enduring and spatial nature of the enterprise richness of South African towns. South African Journal of Science, 113(3/4), 8. Art. #2016-0190. doi:10.17159/sajs.2017/20160190
- Toerien, D. F. (2018a). The ‘Small Town Paradox’ and towns of the Eastern Cape Karoo, South Africa. Journal of Arid Environments, 154, 89–98. doi:10.1016/j.jaridenv.2018.04.001
- Toerien, D. F., & Seaman, M. T. (2012a). Proportionality in enterprise development of South African towns. South African Journal of Science, 108(5/6), 38–47. doi:10.4102/sajs.v108i5/6.588
- Toerien, D. F., & Seaman, M. T. (2012b). Regional order in the enterprise structures of selected Eastern Cape Karoo towns. South African Geographic Journal, 94, 1–15. doi:10.1080/03736245.2012.742782
- Toerien, D. F., & Seaman, M. T. (2014). Enterprise richness as an important characteristic of South African towns. South African Journal of Science, 110(11/12), 9. Art. #2014-0018. doi:10.1590/sajs.2014/20140018
- U.S. Census Bureau. (2018a). County business patterns (CBP). Retrieved June 23, 2018, from www.census.gov/programs-surveys/cbp/data/datasets.html
- U.S. Census Bureau. (2018b). Quick Facts. Retrieved May 15–18, 2018, from www.census.gov/quickfacts/fact/table/US/PST045217
- United States. (2017). North American industry classification system. Washington: Executive Office of The President.
- West, G. (2017). Scale: The universal laws of life and death in organisms, cities and companies. London: Weidenfeld & Nicolson.
- Youn, H., Bettencourt, L. M. A., Lobo, J., Strumsky, D., Samaniego, H., & West, G. B. (2016). Scaling and universality in urban economic diversification. Journal of the Royal Society Interface, 13, 20150937. doi:10.1098/rsif.2015.0937