
 ?Mathematical formulae have been encoded as MathML and are displayed in this HTML version using MathJax in order to improve their display. Uncheck the box to turn MathJax off. This feature requires Javascript. Click on a formula to zoom.
Abstract
The literature on the concept and measurement of poverty has significantly improved from the traditional unidimensional (income/expenditure) analysis to the multidimensional concept of poverty and well-being. Following the Multidimensional Poverty Assessment Tool (MPAT), the study explored the potential of combining counting and participatory approaches in determining levels of deprivations and well-being in an upland farming community in the Philippines. Data from a random sample of 153 farming households and analyzed following Alkire and the Foster’s methodology revealed that 3 out of 4 households are multidimensionally poor. Results of the study also show that farming households’ ability to generate farm- and non-farm income in addition to the high degree of exposure to idiosyncratic and covariate shocks contribute to the high multidimensional poverty index. Further, the study presents implications of these results for antipoverty policy in the rural context.
PUBLIC INTEREST STATEMENT
Poverty is multidimensional and mostly a rural phenomenon. Hence, this study assessed the level of deprivations and wellbeing of upland farming households in the Philippines using the Multidimensional Poverty Assessment Tool (MPAT) following the Alkire and Foster methodology. The study also explores the potential of employing counting approach while considering the voice of the poor in identifying the weights and deprivation cutoffs. The study revealed that 3 out of 4 households are multidimensionally poor. Most of the deprivations are associated with their ability to generate farm- and non-farm income in addition to the high degree of exposure to idiosyncratic and covariate shocks. The study suggests strengthening the Crop Insurance Program to provide a safety net among the farming household in case their livelihood was barely affected by extreme weather conditions.
1. Introduction
Eradicating poverty is one of the most critical issues in many parts of the world and remains the central goal and top priority of the international development agenda. Veritably, “Ending poverty in all its forms everywhere” was framed as the first among the 17 Sustainable Development Goals (SDGs) which was adopted by the United Nation General Assembly on 25 September 2015 (CitationUnited Nation [UN], 2015, p. 15).
Poverty in most developing countries is largely a rural phenomenon (Aguilar & Sumner, Citation2019; Alkire & Fang, Citation2018; Castañeda et al., Citation2018; Ozughalu & Ogwumike, Citation2019). Rural poor depend mainly on common-pool resources and engage primarily in agriculture, fishing, mining, forestry, and other related small-scale industries and services (Kapur, Citation2019; Khan, Citation2001; Ogutu & Qaim, Citation2019). They often lack productive assets needed to maximize their income and are constrained with the access to land, labor, inputs, irrigation and financial services (Food and Agriculture Organization, Citation2019; International Fund for Agricultural Development [IFAD], Citation2018; Sabates-Wheeler, Devereux, Mitchell, Tanner, & Davies, Citation2008).
Poverty is also recognized as multifaceted (Alkire & Foster, Citation2007; Anand & Sen, Citation1997; Atkinson, Citation2003; Bourguignon & Chakravarty, Citation2003). Disagreement, however, among poverty scholars exists on what methodology to use in multidimensional poverty measurement. Methods such as the factor analysis, multiple correspondence analysis, and principal component analysis have evolved (Fransman & Yu, Citation2018) but the Alkire and Foster’s (Citation2011) multidimensional poverty index (MPI) has gained general acceptance among scholars. According to its MPI assessment in 103 countries across the globe, a total of 1.45 billion individuals are multidimensionally poor (Oxford Poverty and Human Development Initiative, 2017). This estimate is far higher than the reported more than 800 million uni-dimensionally poor of the UN.
Poverty, however, as in the case of the UN data in 2015, used the monetary measure of poverty which discriminates other dimensions of wellbeing. Nonetheless, there is a broad consensus among scholars and institutions that acknowledge the limitation of monetary poverty measure (Chen, Leu, & Wang, Citation2019; Espinoza-Delgado & Klasen, Citation2019; Page & Pande, Citation2018). Although the monetary measure is a strong predictor of individual’s wellbeing (Alkire, Kanagaratnam, & Suppa, Citation2018; Waggle, Citation2005) and provides beneficial information (Calderon & Kovacevic, Citation2015), it does not capture the holistic view such as the basic needs and the capability of the people as a basis for poverty identification (Chakravarty & Lugo, Citation2016; Sen, Citation2001).
In the Philippines, almost a quarter of the population is considered poor (Philippine Statistics Authority, Citation2019), and poverty is still predominantly a rural phenomenon (Sta Romana, Citation2017; World Bank, Citation2018). Among the basic sectors, the marginalized farmers remain the poorest with a reported poverty incidence of 38.3% according to the 2015 poverty estimate of the PSA (Citation2017). Among the rural population in the Philippines, indigenous peoples (IPs) and upland settlers are the poorest (Espiritu, Casin, & Camacho, Citation2010; Fortenbacher & Alave, Citation2014).
7However, the country is still dominantly using monetary poverty measures despite the multidimensional recognition of poverty (Albert & Vizmanos, Citation2018; Datt, Citation2017). Moreover, most of the studies in the country use the OPHI’s dimensions and relative values (e.g. Alkire et al., Citation2018; Balisacan, Citation2015; Bautista, Citation2018). This study, nonetheless, aims to contribute to the body of knowledge related to multidimensional poverty such as the use of the 10-dimensional rural poverty framework; the use of the counting approach, AF methodology and dual cut-off approach in poverty identification; the use of participatory approaches in defining the deprivation cut-off, weights (or relative values) and poverty cut-off; and the use of axiomatic approach in poverty aggregation.
In the intended communities, this study was designed to measure the multidimensionality of poverty of upland farming households as there has been no published study which assesses the communities’ well-being using multiple dimensions. Also, the study analyzed the relationship of the 10 dimensions of well-being and evaluate the factors affecting the multidimensional poverty of upland farming households.
2. Literature review
Amartya Sen, in his 1976 seminal paper “Poverty: An Ordinal Approach to Measurement,” identified two steps that poverty measurement must address: (1) the identification of the poor among the population and (2) the aggregation of poverty data into an overall index. “Identification starts at the level of individual households or people while aggregation creates society-wide poverty measures” (Alkire, Citation2018, p. 4).
Identification of the poor is one of the critical issues in multidimensional poverty measurement. According to Alkire et al. (Citation2015), the first step in multidimensional poverty requires defining the threshold in each indicator. They called it the dimensional deprivation cutoff. When a person ‘s achievement is below the cutoff, he/she is considered deprived. The “counting approach” is one of the censored achievement approaches which identify the poor according to the number (count) of deprivations they experience (Alkire et al., Citation2015).
In counting identification methods, the criterion for identifying the poor can range from “union” to “intersection.” Substantially, intermediate approach or also known as the “dual cut-off” is considered better than the two other approaches because it contains the union (deprived of at least one dimension) and the intersection (deprived of all the dimensions) approach (Alkire & Foster, Citation2011; Bossert, Chakravarty, & D’Ambrosio, Citation2009; Bruck & Kebede, Citation2013).
Another important issue in the identification process is the question of who will identify the deprivation cutoff, weights, and poverty cutoff (Abdu & Delamonica, Citation2017; Pasha, Citation2017; Ravallion, Citation2012). This study, however, favored the use of participatory approach. As Narayan (Citation1998) claimed, “The poor are the true poverty experts.” Hence, the development discourse should be based on the experiences, priorities, reflections, and recommendations of poor itself and not from the dominated perspectives and expertise of those who are not deprived—professionals, politicians and agency officials (Narayan, Patel, Schafft, Rademacher, & Koch-Schulte, Citation2000).
The second concern in multidimensional poverty assessment is the process of aggregation. There are many approaches in poverty aggregation such as the dashboard approach (Ravallion, Citation2011), composite indices approach ((Anand & Sen, Citation1994, Citation1997; United Nations Development Programme, Citation1995), Venn diagrams (Ferreira & Lugo, Citation2013), dominance approach (Kabubo-Mariara, Araar, & Duclos, Citation2013), statistical approach, fuzzy set approach (Bastos & Machado, Citation2009; Oyekale, Okunmadewa, Omonona, & Oni, Citation2009), and axiomatic approach (Alkire et al., Citation2015). This study used the axiomatic approach which articulately satisfies some of the properties for multidimensional poverty measurement. Actions that specify the axioms or properties they satisfy enable the analyst to comprehend the ethical principles they represent and to be aware of the track of change they will exhibit under specific conversions (Alkire et al., Citation2015).
Further, poverty scholars must decide on what and how many dimensions should be used in poverty assessment. This study used the multidimensional poverty assessment tool (MPAT) which was developed, tested and piloted by the United Nation’s International Fund for Agricultural Development (IFAD) for local-level rural poverty assessment (Saisana & Saltelli, Citation2010). The dimensions of MPAT were based on the Basic Needs Theory (Streeten & Burki, Citation1978; Streeten, Burki, Haq, Hicks, & Stewart, Citation1981), approach to social justice that gives priority to meeting people’s basic needs, and the concept of New Rurality (Rauch, Citation2009) which recognizes the recent reality of many rural people lives now.
3. Methodology
This study employed multi-phased mixed-method design to assess the multidimensional poverty using the 10-dimensions of rural poverty and the modified Multidimensional Poverty Assessment Tool (MPAT) among the farming households of the upland communities in Goa, Camarines Sur Philippines from January to March 2018. Figure shows the map of the study area. MPAT v.6 has been tested for its validity regarding structure and robustness. According to the study of Saisana and Saltelli (Citation2010, p. 5–6), “MPAT v.6 reveals no particular shortcomings in the conceptual structure, internally consistent, is not double-counting information, has a well-balanced structure, and is robust.”
Figure 1. Map showing the location of the study area.
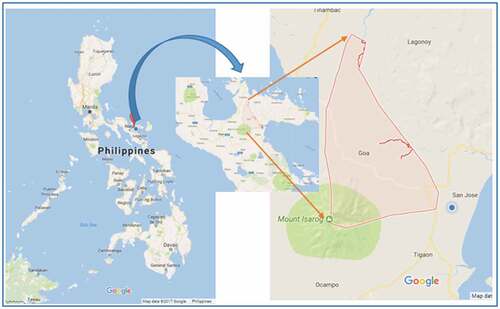
The researcher-administered survey was conducted to 153 respondents which was generated using Cochran (1977) formula and identified through the multi-stage random sampling. The first stage was a random sampling of villages or barangays in the upland communities of Goa. The dominant crops planted in the community such as palay, corn, and vegetables served as the basis for the clustering of the villages. Hence, the upland communities were divided into three clusters—palay (Cluster A), corn (Cluster B), and vegetables (Cluster C). Random selection draws Barangay San Pedro for Cluster A, Barangay Lamon for Cluster B, and Barangay Payatan for Cluster C. The last stage of the sampling, on the other hand, was a random sampling of the households within the randomly selected barangays. Moreover, a focus group discussion was conducted to 10 poor participants representing various crops being planted in identifying the deprivation cut-off, relative values and poverty cut-off.
The study applied multiple data analytical tools to extract the necessary findings that answered the objectives of this study. Specifically, the study used the percentage technique to describe the socio-demographic profile of the respondents; AF methodology to come up with a multidimensional poverty index; Pearson Correlation Coefficient to analyze the correlation between and among the dimensions of rural poverty or well-being; and Binary Logistic Regression analysis to evaluate the factors affecting the multidimensional poverty. The data were analyzed using a Spreadsheet and SPSS v20 software. The study applied counting, axiomatic and participatory approach to poverty measurement following AF methodology where eight steps were followed as presented in Figure .
Figure 2. Eight-steps involved in multidimensional poverty measurement as adopted from Alkire and Foster (Citation2007, p. 2011).
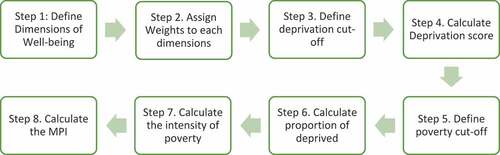
The first step of AF methodology is to define the dimensions of well-being. The study used the 10 dimensions of rural poverty based on MPAT v.6. Table presents the 10 dimensions and their subdimensions. The second and third steps involve assigning weights and deprivation cut-off for each dimension and indicator. In this case, a participatory approach using focus group discussion was employed to decide on the weights and deprivation cutoff. Likewise, the relative values (weights) per dimension were identified through FGD. On the other hand, the study used the User Guide of MPAT as the basis for weights per subdimension (IFAD, Citation2014). Table presents the weight per dimension and subdimension.
Table 1. Weights of dimensions and subdimensions
The fourth step calculates the deprivation score for each household using this mathematical formula:
Where: is the deprivation score of ith household
is the ith dimension of well-being (poverty)
is the weight assign to ith dimension
The fifth step is to define the cut-off on household deprivation score or the poverty cut-off. In this case, the participants of the FGD decided the poverty cut-off or the weight needed to be considered poor. The agreed poverty cut-off is 33.33, meaning if the deprivation score is higher than 33.33, the household is considered multidimensionally poor. This poverty cut-off is similar to the UNDP and OPHI poverty cut-off of 1/3 of the dimensions. Consequently, those who are below the poverty cut-off are considered non-poor and are assigned by “0” and those who are above the poverty cut-off are considered poor and are assigned by “1”.
In the sixth step, the proportion of deprived households or headcount index (H) takes place. It was done by dividing the number of households that are multidimensionally poor at the given poverty cutoff by the total numbers of households. Sequentially, the intensity of poverty or average deprivation (A) can be calculated using the mathematical equation below:
Where: A is the average deprivation
is the weighted deprivation
q is the number of households that are multidimensionally poor
Finally, the product of the poverty headcount ratio (H) and average deprivation (A) was obtained to come up with the multidimensional poverty index (MPI).
4. Results and discussion
4.1. Profile of the farming household-heads
The study collected the profile of the 153 randomly selected heads of the farming households in the upland communities of Goa, Camarines Sur according to age, sex, number of children, highest educational attainment, marital status, and crops planted.
The result shows that the average age of the farming household-heads is 46; 24 being the youngest and 84 being the oldest. The heads of the farming households are male-dominated (73). Female-headed households account for only 27% of the respondents who are mostly widows and single mothers. The average number of children of the respondents is five, with 14 dependents as the largest. Two-thirds of the respondents have 4 or more dependents. Elementary level is the highest educational attainment for the majority of the respondents (54%) while only a quarter (25%) have graduated from the secondary level and 5% have reached or graduated tertiary level. Most of the respondents (85%) are married. However, 14% of them are on the live-in relationship or common-law marriage.
Half the respondents sow or plant palay (50%) followed by vegetables (35%), coconut (30%), corn (20%) and root crops (17%). More than half of the respondents have at least two crops planted while 48% are dependent to only one crop such as rice (25% of the respondents), vegetables (14%), and corn (5%). A great majority of the respondents (71%) are dedicated only to temporary crops (such as rice, corn, etc.) while 1% of them are dedicated only to permanent crops (such as coconut, fruit-bearing trees). The rest (28%) have both permanent and temporary crops. It implies that almost half of the respondents do not practice crop diversification and most of them are dependent on temporary crops.
4.2. Multidimensional poverty index
Using the data gathered through the modified MPAT and the application of the dual cut-off method, the study found a high incidence of multidimensional poverty among the three Clusters or the upland communities of Goa as a whole as shown in Table . The study found that three out of four farming households are multidimensionally poor. Hence, the incidence of multidimensional poverty among the farming households in the upland communities in Goa, Camarines Sur is twice the unidimensional poverty of 38.3% for the farmers as a basic sector in the Philippines. The incidence is higher because it measures 10 dimensions of poverty compared to monetary measures and is focused on upland communities which are poorer than of the farmers in the lowland communities (IFAD, Citation2014). Similarly, in the global scale, the United Nations has reported a more than 800 million poor but the OPHI has reported 1.45 billion multidimensional poor.
Table 2. The multidimensional poverty index by cluster
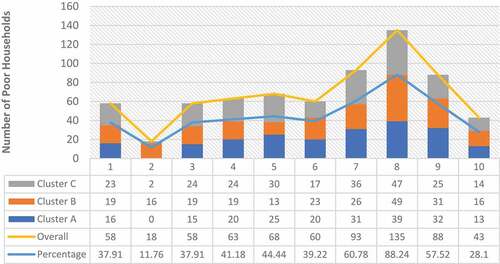
Moreover, Figure shows that among the 10 dimensions, Farm Assets [7], Non-Farm Assets [8], and Exposure and Resilience to Shocks [9] appeared to have a high incidence of deprivations. That is, more than half of the farming households are deprived of Farm Assets (66.28%), Non-Farm Assets (88.24%) and Exposure and Resilience to Shocks (57.52%). The deprivation to these three “enabling environment” dimensions imply that the main problem of the farming households is on their livelihood—that is, the ability of the household to produce food and create agriculture-based income, and the ability to generate non-agricultural income, access to credit and household wealth. Additionally, exposure of the households to shocks worsens the ability of the household to generate income.
Figure 3. Number of poor farming households per dimension.
Cluster B has the most number of multidimensionally poor farming households with 42 or 82%. In contrast, it has the lowest intensity of 4.67 compared to the other two clusters. It means that the magnitude of deprivation in Cluster B is less than the other two clusters. Cluster C has the highest intensity of 5.50 which means that each multidimensionally poor household is deprived of four to seven of the dimensions. Collectively, the farming households in upland communities of Goa have a poverty intensity of 4.95 which means that each multidimensional household is deprived of four to six of the dimensions. Comparing the three clusters, Cluster A is the least multidimensionally poor with a multidimensional poverty index (MPI) of 3.30, a 0.54 and 1.01 less than Cluster B and C, respectively.
4.3. Relationship between and among the 10 dimensions of poverty
Pearson’s r data analysis revealed that a weak to moderate positive and negative correlation exists among the 10 dimensions. Table shows the Pearson’s correlation coefficients between and among the 10 dimensions of rural poverty.
Table 3. Pearson’s correlation coefficient between the 10 dimensions of poverty/wellbeing
The dimension of Food and Nutrition Security [1] has weak positive correlation to Health and Health Care [3] (r = 0.243), Sanitation and Hygiene [4] (r = 0.281), Housing and Energy [5] (r = 0.251), Farm Assets [7] (r = 0.172) and Exposure and Resilience to Shocks [9] (r = 0.213). This means that the more the household is food and nutrition secure the higher the quality of healthcare; the higher the quality of household sanitation, food waste management and personal hygiene; the higher the general construction quality of the home and energy sources; the higher the ability to produce food/and or create agriculture-based income; and the higher the ability to cope and recover despite the exposure to natural and socio-economic shocks or vice versa.
The result suggests that food and nutrition security is vital to the health of the farming households. The Food and Agriculture Organization [FAO] (Citation2012) highlights that an individual’s access to sufficient, safe and good quality of food is needed to be well-nourished. The PlanH (Citation2016) also claimed that healthy eating promotes and supports physical, social and mental well-being and contributes to the overall health of the households.
Proper sanitation, hygiene, housing, and energy have a significant link to food and nutrition security. The United States Agency for International Development [USAID] (Citation2013) considered water, sanitation, and hygiene (WASH) as an essential component for food security as it addresses its two components: availability of food and utilization of food. Accordingly, USAID advocates changing behaviors related to feeding and childcare and providing access to and proper usage of safe drinking water, hygiene and sanitation services to ensure good nutrition. Poor WASH condition leads to undernutrition due to infectious diseases (Mabhaudhi, Chibarabada, & Modi, Citation2016) which affects childhood growth and development (Cumming & Cairncross, Citation2016).
The ability of the household to generate agricultural income and produce food and their less exposure and resilience to shocks contributed to the food and nutrition security of the households. The correlation verified the profound role of agriculture in food security. According to the World Bank (Citation2008), agriculture plays a crucial role in sustaining the availability of food, providing sources of income to purchase food and offering high nutritional food. Also, exposure to shocks worsens food insecurity. In the study of Dornan, Oragndo Portela, and Pells (Citation2014) in Peru and Vietnam, they found a significant relationship between experiencing floods and worsening food insecurity.
Further, Domestic Water Supply [2] has a weak positive correlation to Health and Health Care [3] (r = 0.280) and Non-Farm Assets [8] (r = 0.169) and weak negative correlation to Housing and Energy [5] (r = −0.219). It means that the higher the quality, stability, and accessibility to the water supply of the household the higher the quality of health; and the lower the construction quality of the home and energy sources or vice versa. It suggests that the quality and accessibility to domestic water supply are attributable to the quality of health of the households. The WHO (Citation2008) estimates that half of the malnutrition is associated with repeated diarrhea or intestinal worm infections because of poor water, sanitation, and hygiene practices. Hence, “a safe, reliable, affordable, and easily accessible water supply is essential for good health” (Hunter, MacDonald, & Carter, Citation2010, p. 1).
Furthermore, aside from its correlation to Food and Nutrition Security [1], Sanitation and Hygiene [3] has a moderate positive correlation to Housing and Energy [5] (r = 0.323); and weak positive correlation to Farm Assets [7] (r = 0.244) and Non-Farm Assets [8] (r = 0.164). It means that the higher the quality of household sanitation, food waste management and personal hygiene the higher the general construction quality of home and energy sources; the higher the household’s ability to produce food and/or create agriculture-based income; and the higher the household non-agricultural income-generating ability, access to credit and household wealth or vice versa. It suggests that the construction of better sanitation and hygiene facility is attributable to a household with sufficient income source. This result supports the findings of Abubakar (Citation2017) and Mahama (Citation2013) which claims that poverty is significantly related to using an unimproved facility or open defecation. The result also implies that the poor households with no stable source of income cannot build a modern sanitation facility.
Also, the result suggests that when a household has a good quality of home and energy sources, it also has a better toilet facility, and proper personal hygiene and waste management. Abubakar (Citation2017) also found out that the number of rooms and access to electricity is significantly associated with the type of sanitation facility. Hence, the result implies that a good quality of home comes with modern sanitation facilities and hygiene practices.
Moreover, Housing and Energy [5] also has a weak positive correlation to Farm Assets [7] (r = 0.29), aside from its correlation with the other three dimensions. It means that the higher the general construction quality of the home and energy sources, the higher the household’s ability to produce food and create agriculture-based income or vice versa. It suggests that the households with high agricultural income can construct a good quality home and can access modern energy services and clean cooking facilities. Similar to the studies of Barnes and Binswanger (Citation1986), Llanto (Citation2012), Narayanamoorthy and Hanjra (Citation2006), it implies that electrification has a direct impact on agricultural productivity.
Lastly, Farm Assets [7], aside from its correlation with three other dimensions, also has a weak positive correlation with Non-Farm Assets [8] (r = 0.165). It means that the higher the household’s ability to produce food and create agriculture-based income the higher the household non-agricultural income-generating ability, access to credit and household wealth or vice versa. The result may be attributable to the farm/holdings of the farmers as it is used as collateral to access formal credit facility. Accordingly, farm size has a positive effect on farmers’ access to credit (Asogwa, Abu, & Ochoche, Citation2014; Chandio, Jiang, Wei, Rehman, & Liu, Citation2017; Saqib, Kuwornu, Panezia, & Ali, Citation2017).
4.4. Factors affecting multidimensional poverty
The last objective of this study is to evaluate the factors that affect multidimensional poverty among the farming households in upland communities in Goa, Camarines Sur. To materialize, the study employed the Binary Logistic regression analysis due to the dichotomous dependent variable—0 for non-poor and 1 for poor. The odds ratios measure the ratio of a chance when one moves from the reference modality to another modality within the same variable. If it is higher than 1, this movement leads to an increase in the risk of falling into multidimensional poverty. If the probability (p > z) is <5%, then the risk is significant.
The regression result in Table revealed that there is a significant association between multidimensional poverty and live-in marital status (p = 0.045), distance to the town center (p = 0.016), permanent crops (0.02); and diversified crops (p = 0.001). The odds ratio also revealed that a live-in status is 15 times a predictor that a person may fall into multidimensional poverty than being single. Similarly, the farther the residence to the town center is 1.32 times more likely that a household may fall into multidimensional poverty. Distance as a factor of multidimensional poverty also reflected on the study of Maity and Buysse (Citation2017) in Udalguri district, Bodoland. They observed that the farthest the village from the town, the residents are not able to enjoy the facilities such as hospitals and schools which contributes to multidimensional poverty.
Table 4. Binary logistic regression analysis of the factors affecting multidimensional poverty among the upland farming households
Further, the study revealed that sowing/planting diversified crops are less likely to be a predictor that the household will fall into multidimensional poverty than having temporary crops. Although having temporary crops (e.g., rice, corn, vegetables) is a strong predictor of multidimensional poverty. The study also revealed that age, sex, number of children, educational attainment, number of crops planted, and the informal ex-ante social risk mechanisms in place has no significant association with multidimensional poverty.
This model is significant χ2 (5, N = 153) = 33.734, p = 0.001 with between 19.8 and 30 percent of the variance in the dependent variables is explained by the independent variables. Additionally, Hosmer–Lemeshow Test (p = 0.464) is greater than the significance level of 0.05 which indicate that there is not enough evidence to conclude that the model does not fit the data. Further, the percentage accuracy classification (PAC) of the model is 80.4 which means that 80.4% of doing prediction using this model is correct.
5. Conclusion
Combining counting and participatory approaches in poverty identification is useful in measuring the reality of multidimensional poverty in rural areas. Participatory approach is useful in identifying deprivation and poverty cut-off and the weights of the dimensions. In this way, the residents who are in poverty were given the voice to identify and define the reality of poverty per dimension in their own locality.
Significantly, the study revealed that the upland farming households’ inadequate capacity to produce food and agricultural income as measured by their farm holdings, land tenure, and farm inputs, and their inadequate ability to generate non-agricultural income, and household wealth and their low access to formal credit facility have contributed a lot of on higher intensity of poverty. Their exposure to idiosyncratic and covariate shocks also contributed to worsening their ability to generate farm and non-farm income. Hence, three of 4 farming households are poor because they have no stable and other source income and are dependent on subsistence farming.
In general, the study recommends that the social protection program of the government should not only be limited to addressing the inadequacy of the basic needs. The government should focus more on livelihood or income generation of the upland farmers to make the program more sustainable. Three important dimensions—farm assets, non-farm assets and exposure and resilience to shocks—should also be emphasized to ease the intensity of deprivation among the farming households. These dimensions are the source of food and income for the upland farmers. Hence, their inability to produce food and income may affect other dimensions. Specifically, the study suggests strengthening the Crop Insurance Program to provide a safety net among the farming household in case their livelihood was barely affected by extreme weather conditions. Institutionalizing sustainable livelihood program to capacitate the farming households so that in time they are waiting for the harvest time or period when they were not able to sow/plant crops due to weather condition, they still have another source of income. Enhance the farmer’s access to a credit facility with minimal requirements and reasonable interest rates to encourage the upland farmers to invest in high-value crops. Mina and Reyes (Citation2017) claimed that an accessible and comfortable credit facility could be done by expanding the access of the farmers to microfinance and encouraging the private banks to relax their lending requirements. Similarly, the importance of organizing or solidifying farmer’s organization or membership to the agricultural cooperative is vital to strengthen social capital and to access funding from the government collectively.
The results of the study, however, have to be seen in light of some limitations. The study focuses only to the upland farming communities of one municipality of the Philippines which suggests exploring other rural populace in a wider scope.
Additional information
Funding
Notes on contributors
Calyd T. Cerio
Mr. Calyd T. Cerio is an Instructor and the Director of the Center for Bioresource-based Enterprise Development of Partido State University in the Philippines. He earned his Master of Science in Rural Sociology at the University of the Philippines Los Baños.
Filma C. Calalo
Dr. Filma C. Calalo is an Assistant Professor in the Agricultural Systems Institute, College of Agriculture and Food Science, University of the Philippines, Los Baños and the Director of the University of the Philippines Professional School for Agriculture and the Environment, an off-campus sub-unit of the UPLB Graduate School in Mindanao, Philippines.
Sherry B. Marasigan
Dr. Sherry B. Marasigan is an Assistant Professor in the Agricultural Systems Institute, College of Agriculture and Food Science, University of the Philippines, Los Baños.
Josefina T. Dizon
Dr. Josefina T. Dizon is a Professor of Community Development in the Institute for Governance and Rural Development, College of Public Affairs and Development, University of the Philippines Los Baños.
Related Research Data
References
- Abdu, M., & Delamonica, E. (2017). Multidimensional child poverty: From complex weighting to simple representation. Social Indicators Research, 136, 881. doi:10.1007/s11205-017-1620-6
- Abubakar, I. (2017). Access to sanitation facilities among Nigerian households: Determinants and sustainability implications. Sustainability, 9(547). doi:10.3390/su9040547
- Aguilar, G. R., & Sumner, A., (2019). Who are the world’s poor? A new profile of global multidimensional poverty (CGD Working Paper 499). Washington, DC: Center for Global Development. https://www.cgdev.org/publication/who-are-worldspoor-new-profile-global-multidimensional-poverty
- Albert, J. R., & Vizmanos, J. F. (2018). Poverty is multidimensional: But do we really need a multidimensional poverty index? (PIDS Discussion Paper Series No, 2018-26).
- Alkire, S. (2018). Multidimensional poverty measures as relevant policy tools (OPHI Working Paper 118). University of Oxford.
- Alkire, S., & Fang, Y. (2018). Dynamics of multidimensional poverty and uni-dimensional income poverty: An evidence of stability analysis from China. Social Indicators Research. doi:10.1007/s11205-018-1895-2
- Alkire, S., & Foster, J. (2007). Counting and multidimensional poverty measurement (OPHI working paper).
- Alkire, S., & Foster, J. E. (2011). Counting and multidimensional poverty measurement. Journal of Public Economics, 95(7–8), 476–17. doi:10.1016/j.jpubeco.2010.11.006
- Alkire, S., Foster, J. E., Seth, S., Santos, M. E., Roche, J. M., & Ballon, P. (2015). Multidimensional poverty measurement and analysis: A counting approach. Oxford: Oxford University Press.
- Alkire, S., Kanagaratnam, U., & Suppa, N. (2018). The global multidimensional poverty index (MPI): 2018 revision (OPHI MPI Methodological Notes 46). Oxford Poverty and Human Development Initiative, University of Oxford.
- Anand, S., & Sen, A. (1994). Human development index: Methodology and measurement (Human Development Report Office Occasional Paper). UNDP.
- Anand, S., & Sen, A. (1997). Concepts of human development and poverty: A multidimensional perspective (pp. 1–20). United Nations Development Programme, Poverty and human development: Human development papers 1997. New York: United Nations.
- Asogwa, B., Abu, O., & Ochoche, G. (2014). Analysis of peasant farmers’ access to agricultural credit in Benue State, Nigeria. British Journal of Economics, Management & Trade, 4(10), 1525–1543. doi:10.9734/BJEMT/2014/3883
- Atkinson, A. B. (2003). Multidimensional deprivation: Contrasting social welfare and counting approaches. Journal of Economic Inequality, 1(1), 51–65. doi:10.1023/A:1023903525276
- Authority, P. S. (2019). Proportion of Poorer Filipinos registered at 21.0 percent in the First Semester of 2018. Retrieved from https://psa.gov.ph/poverty-press-releases/nid/138411
- Balisacan, A. (2015). Chapter 24 – The growth-poverty nexus: Multidimensional poverty in the Philippines. Sustainable Economic Development: Resources, Environment and Institutions, 445–468. doi:10.1016/B978-0-12-800347-3.00024-8
- Barnes, D., & Binswanger, H. (1986). Impact of rural electrification and infrastructure on agricultural changes, 1966-1980. Economic and Political Weekly, 21(1), 26–34.
- Bastos, A., & Machado, C. (2009). Child poverty: A multidimensional measurement. International Journal of Social Economics, 36(3), 237–251. doi:10.1108/03068290910932738
- Bautista, C. C. (2018). Explaining multidimensional poverty: A household-level analysis. Asian Economic Papers, 17, 183–210. doi:10.1162/asep_a_00648
- Bossert, W., Chakravarty, S., & D’Ambrosio, C. (2009, Feb 23). Measuring multidimensional poverty: The generalized counting approach. Retrieved from http://www.ecineq.org/ecineq_ba/papers/dambrosio.pdf
- Bourguignon, F., & Chakravarty, S. R. (2003). The measurement of multidimensional poverty. Journal of Economic Inequality, 1(1), 25–49. doi:10.1023/A:1023913831342
- Bruck, T., & Kebede, S. (2013). Dynamics and drivers of consumption and multidimensional poverty: Evidence from rural Ethiopia. DIW Berlin Discussion Paper No. 1287. doi: 10.2139/ssrn.2248670.
- Calderon, C., & Kovacevic, M. (2015). MPI: Construction & analysis. UNDP. Retrieved from http://hdr.undp.org/sites/default/files/mpi_trainingmaterial_mcc_mk_clean_june_2015.pdf
- Castañeda, A., Doan, D., Newhouse, D., Nguyen, M. C., Uematsu, H., & Azevedo, J. P.; World Bank Data for Goals Group. (2018). A new profile of the global poor. World Development, 101, 250–267. doi:10.1016/j.worlddev.2017.08.002
- Chakravarty, S. R., & Lugo, M. A. (2016). Multidimensional indicators of inequality and poverty. In M. Adler & M. Fleurbaey (Eds.), The Oxford handbook of well-being and public policy (pp. 246–285). Oxford: Oxford University Press.
- Chandio, A., Jiang, Y., Wei, F., Rehman, A., & Liu, D. (2017). Famers’ access to credit: Does collateral matter or cash flow matter?—Evidence from Sindh, Pakistan. Cogent Economics & Finance, 5, 1–13. doi:10.1080/23322039.2017.1369383
- Chen, K., Leu, C., & Wang, T. (2019). Measurement and determinants of multidimensional poverty: Evidence from Taiwan. Social Indicators Research. doi:10.1007/s11205-019-02118-8
- Cumming, O., & Cairncross, S. (2016). Can water, sanitation and hygiene help eliminate stunting? Current evidence and policy implications. Maternal and Child Nutrition, 12, 91–105. doi:10.1111/mcn.12258
- Datt, G. (2017). Multidimensional poverty in the Philippines, 2004–13 do choices for weighting, identification and aggregation matter? Washington: World Bank. Retrieved from http://documents.worldbank.org/curated/en/478951497014709315/pdf/WPS8099.pdf
- Dornan, P., Oragndo Portela, M., & Pells, K. (2014). Climate shocks, food and nutrition security: Evidence from the young lives cohor study. Oxford: Oxfam International. Retrieved from http://citeseerx.ist.psu.edu/viewdoc/download?doi=10.1.1.702.8416&rep=rep1&type=pdf
- Espinoza-Delgado, J., & Klasen, S. (2019). Gender and multidimensional poverty in Nicaragua: An individual based approach. World Development., 110, 466–491. doi:10.1016/j.worlddev.2018.06.016
- Espiritu, N., Casin, M., & Camacho, S. (2010). Development pathways in the Philippine uplands: Impacts and influences on forest resource management and human well-being. Asian Journal of Agriculture and Development, 7(2), 27–47.
- Ferreira, F., & Lugo, M. (2013). Multidimensional poverty analysis: looking for a middle ground. World Bank Research Observer, 28(2), 220–235. doi:10.1093/wbro/lks013
- Food and Agricultural Organization. (2012). The state of food insecurity in the world: Economic growth is necessary but not sufficient to accelerate reduction of hunger and malnutrition. Rome, Italy: FAO. Retrieved from http://www.fao.org/fileadmin/user_upload/red-icean/docs/Nutrition%20Education_FAO_Concept%20note.pdf
- Food and Agriculture Organization. (2019). The role of agriculture and rural development in achieving SDG 1.1. Retrieved from https://www.un.org/development/desa/dspd/wp-content/uploads/sites/22/2019/03/FAO-ending-extreme-rural-poverty-1.pdf
- Fortenbacher, D., & Alave, K. (2014). Upland Agriculture in the Philippines: Potentials and Challenges. (E. Dolatre, J. Schade, & C. Staiss, Eds.) Manila, Philippines: Deutsche Gesellschaft für Internationale Zusammenarbeit (GIZ) GmbH. Retrieved from http://enrdph.org/wp-content/uploads/2014/08/Upland-Agirculture-in-the-Philippines_final-version_web1.pdf
- Fransman, T., & Yu, D. (2018). Multidimensional poverty in South Africa in 2001–16. Development Southern Africa, 1–30. https://doi.org/10.1080/0376835X.2018.1469971
- Hunter, P., MacDonald, A., & Carter, R. (2010). Water Supply and Health. PLoS Med, 7(11). doi:10.1371/journal.pmed.1000361
- IFAD. (2014). The multidimensional poverty assessment tool: User’s guide. Rome: International Fund for Agricultural Development.
- IFAD. (2018, 2-3 May). Rural Inequalities: Evaluating approaches to overcome disparities. Conference Concept Note. Rome, Italy. Retrieved from https://webapps.ifad.org/members/events/2018-4-26/docs/Concept-Note.pdf
- Kabubo-Mariara, J., Araar, A., & Duclos, J. Y. (2013). Multidimensional poverty and child well-being in Kenya. The Journal of Developing Areas, 47(2), 109–137. doi:10.1353/jda.2013.0024
- Kapur, R. (2019). Resource use and management of livelihood context in rural households in India. Acta Scientific Agriculture., 3(4), 150–160.
- Khan, M. H. (2001, March). Rural poverty in developing countries: Implications for public policy. Retrieved from International Monetary Fund http://www.imf.org/external/pubs/ft/issues/issues26/
- Llanto, G. (2012). The impact of infrastructure on agricultural productivity (PIDS Discussion Paper Series No. 2012-12). Retrieved from https://dirp4.pids.gov.ph/ris/dps/pidsdps1212.pdf
- Mabhaudhi, T., Chibarabada, T., & Modi, A. (2016). Water-food-nutrition-health nexus: linking water to improving food, nutrition and health in Sub-Saharan Africa. International Journal of Environmental Research and Public Health, 1–19. doi:10.3390/ijerph13010107
- Mahama, A. (2013). Determinants of factors influencing householders’ access to improved water and sanitation facilities in selected low-income urban areas of accra (Thesis (MPHIL)). University of Ghana.
- Maity, S., & Buysse, J. (2017). Multidimensional poverty and the factors influencing the multidimensional poverty status of Bodos: A case study of Udalguri district, Bodoland. International Journal of Education Economics and Development, 8(4), 266–285. doi:10.1504/IJEED.2017.088820
- Mina, C., & Reyes, C. (2017). Estimating Filipinos’ vulnerability to poverty. PIDS policy notes no. 2017-14. Makati City, Philippines: Phippine Institute for Development Studies.
- Narayan, D. (1998, July). Voices of the Poor to Inform the WDR 2000. World Bank, Poverty Group, internal memorandum.
- Narayan, D., Patel, R., Schafft, K., Rademacher, A., & Koch-Schulte, S. (2000). Voices of the poor : Can anyone hear us ? (English). New York: Oxford University Press. Retrieved from http://documents.worldbank.org/curated/en/131441468779067441/Voices-of-the-poor-can-anyone-hear-us
- Narayanamoorthy, A., & Hanjra, M. (2006, July-Sept). Rural Infrastructure and agricultural output linkage: A study of 226 Indian District. Indian Journal of Agricultural Economics, 61(3), 444–459. Retrieved from https://ageconsearch.umn.edu/bitstream/204476/2/13-Narayanamoorthy.pdf
- Ogutu, S. O., & Qaim, M. (2019). Commercialization of the small farm sector and multidimensional poverty. World Development., 114, 281–293. doi:10.1016/j.worlddev.2018.10.012
- Oyekale, T. O., Okunmadewa, F. Y., Omonona, B. T., & Oni, O. A. (2009). Fuzzy set approach to multidimensional poverty decomposition in rural Nigeria. The IUP Journal of Agricultural Economics, (3–4), 7–44.
- Ozughalu, U. M., & Ogwumike, F. O. (2019). Extreme energy poverty incidence and determinants in nigeria: a multidimensional approach. Social Indicators Research, 142, 997. doi:10.1007/s11205-018-1954-8
- Page, L., & Pande, R. (2018). Ending global poverty: Why money isn’t enough. Journal of Economic Perspectives, 32(4), 173–200. doi:10.1257/jep.32.4.173
- Pasha, A. (2017). Regional perspectives on the multidimensional poverty index. World Development, 94, 268–285. doi:10.1016/j.worlddev.2017.01.013
- Plan, H. (2016). Healthy eating & food security: Local government action guides for healthy communities. Australia: Ministry of Health. Retrieved from https://planh.ca/sites/default/files/planh_healthy_eating_action_guide.pdf
- PSA. (2017, June 30). Farmers, fishermen and children consistently posted the highest poverty incidence among basic sectors - PSA. Retrieved from PSA https://psa.gov.ph/content/farmers-fishermen-and-children-consistently-posted-highest-poverty-incidence-among-basic
- Rauch, T. (2009). The new rurality: Its implications for a new, pro-poor agricultural water strategy. InnoWat. Rome: IFAD.
- Ravallion, M. (2011). On multidimensional Indices of poverty. Journal of Economic Inequality, 9, 235–248. doi:10.1007/s10888-011-9173-4
- Ravallion, M. (2012). Troubling tradeoffs in the human development index. Journal of Development Economics, 99(2), 201–209. doi:10.1016/j.jdeveco.2012.01.003
- Sabates-Wheeler, R., Devereux, S., Mitchell, T., Tanner, T., & Davies, M. (2008). Rural disaster risk - poverty interface (Global Assessment Report on Disaster Reduction). Brighton: University of Sussex, Institute of Development Studies. Retrieved from https://www.ids.ac.uk/files//RuralDisasterRiskPovertyInterfaceSeptember15th.doc
- Saisana, M., & Saltelli, A. (2010). The Multidimensional Poverty Assessment Tool (MPAT): Robustness issues and critical assessment. In In EUR Report 24310 EN. Luxenbourg, Italy: European Commission, JRC-IPSC.
- Saqib, S. E., Kuwornu, J. K., Panezia, S., & Ali, U. (2017). Factors determining subsistence farmers’ access to agricultural credit in flood-prone areas of Pakistan. Kasetsart Journal of Social Sciences, 1–7. doi:10.1016/j.kjss.2017.06.001
- Sen, A. (2001). Development as freedom. Oxford: Oxford University Press.
- Sta Romana, L. (2017). Trade and poverty issues: A case study of the Philippines (MPRA Paper No. 78432). Retrieved FROM https://mpra.ub.uni-muenchen.de/78432/1/MPRA_paper_78432.pdf
- Streeten, P., & Burki, S. (1978). Basic needs: Some issues. World Development, 6, 411–421. doi:10.1016/0305-750X(78)90116-X
- Streeten, P., Burki, S., Haq, M., Hicks, N., & Stewart, F. (1981). First things first: Meeting basic human needs in developing countries. London: Oxford University Press.
- UN. (2015). Resolution adopted by the general assembly on 25 September 2015. United Nations General Assembly A/RES/70/1, Seventieth Session, Agenda items 15 and 116. Retrieved from http://www.un.org/ga/search/view_doc.asp?symbol=A/RES/70/1&Lang=E.
- UNDP. (1995). Human development report 1995. Gender and Human Development OUP
- USAID. (2013). Water, sanitation and hygiene: Essential components for food security. USAID. Retrieved from http://www.washplus.org/sites/default/files/resource_files/washplus-food_security2013.pdf
- Waggle, U. (2005). Multidimensional poverty measurement with economic well-being, capability, and social inclusion: A case from Kathmandu, Nepal. Journal of Human Development, 6, 301–328. doi:10.1080/14649880500287621
- World Bank. (2008). Word development report 2008: Agriculture for development. Word Bank. doi:10.1596/978-0-8213-6807-7
- World Bank. (2018). Making growth work for the poor: A poverty assessment for the Philippines. Washington, DC: Author. https://hubs.worldbank.org/docs/imagebank/pages/docprofile.aspx?nodeid=29892868
- World Health Organization (WHO). (2008). Safer water, better health: Costs, benefits and sustainability of interventions to protect and promote health. WHO. Retrieved from http://whqlibdoc.who.int/publications/2008/9789241596435_eng.pdf