
Abstract
Contemporary urban literature addresses various dimensions of the urban space – from spatial reflective analysis of the urban landscape to its evolving human interactive changes. However, the spatio-temporal visibility of urban changes has been less attractive, perhaps due to the unnoticed connection of evolving patterns. Further, urban manifestation reviewed as a unitary system has poorly regarded the consideration for its growing complications. This makes it speciously difficult to significantly trace, track and transfer urban change information for policy guidance and effective decision-making. This paper attempts to address from a contextual study of urban Ghana, this disconnect by adopting a simulated systematic revision of literature. From a multi-diagnostic perspective, it assesses and reflects on the change indicator patterns over the country. Additionally, it reveals the spatial and social story behind the urban retrospect of Ghana and sets the pace of exploring the comprehensiveness of urban complexities using GIS. The paper underscores the significant challenges arising from the deficiency of data on empirical analysis of urban changes and the inefficient traditional monitoring methods affecting local decision-making. Conclusively, it supports the major contribution of advancing studies in the domain of geospatial technology as an organized strategy to make informed and effective urban multidimensional decisions.
PUBLIC INTEREST STATEMENT
This review contributes to the urban discussion through a cross-examination of the outlook of urban Ghana. It is stimulated out of the unmatched struggle within the local government sector who are constantly faced with the mandate to resolve urban change and its adverse manifestation. By identifying the verifiable indicators available, it discovers the multiplicity and cohesive nature of the urban terrain. The study observed through literature and practical cases, the complex nature of Ghana’s cities. Subsequently, the paper confronts the issues by picking and joining the isolated pieces of indicators/elements which can be modelled to better understand urban complexities in this contemporary era. It then proposed steps of addressing these complexities by adopting geospatial technology and relevant data for proper monitoring, modelling and visualization of change. This will facilitate governance and decision-making at the local and regional level thus promising an economic and efficient measure of ensuring sustainable urban management.
1. Background: the urban change complexities in the global south with emphasis on Ghana
Regional and global manifestation of urbanism has been astronomical in this millennia as the world is becoming progressively urbanized. For instance, by 2050, a predictable 60 percent of the global population will live in cities (Sova, Citation2016). This makes the urban change system an alarming concept especially in Africa with an intensifying population growth. From its exponential growth, the continent stands to experience a doubling effect in its urban population from about one billion to almost two billion by 2044 (United Nations, Citation2014). Additionally, Songsore (Citation2009) among others has situated the African urbanization process as solidly demographic driven especially due to its limited drive for radical revolutions in agricultural productivity and industrial development (Gould, Citation1998). However, from Satterthwaite, McGranahan, and Tacoli (Citation2010) perspective, the escalating rate of urbanization of African cities potentially rather attracts economic, infrastructural and socio-cultural benefits though coupled with adverse effects such as inordinate congestion, pollution, disease, crime, income disparity, poverty, hunger among others which cannot be overlooked (FAO, FAPDA. Citation2015)
Ghana’s urban demand keeps soaring with gross impact on the socio-spatial scale of its urban space affecting the functioning, management and performance of its complex existence. This is largely due to the ineffective and cost-intensive approaches adopted over the years to solve urban complex challenges (Burgess, Citation2000). Consequently, an instigated view for monitoring these complex change patterns has drawn critical attention from policymakers and academia towards the effective monitoring and modelling of complexities of urban settings (Tefft, Jonasova, Adjao, & Morgan, Citation2017). It is worthy to note that whereas cities develop, they become more complex to govern considering the associated multiple parameters such as density, growth, temporal patterns among others.
Ghana’s urban expansion rate needs proper monitoring to help assess and manage the organic and composite nature of its proliferation (FFG, Citation2014). Assessment practices of measuring urban changes have hitherto largely depended on population data and vegetative cover indicators limiting the other components such as density, timescale among others. These limiting indicators and methods, as observed by Hagai (Citation2014), often result in manually produced information. Also, statistical urban surveys coupled with metrological analyses have centred on estimated vegetation and environmental status from NDVI images derived from NOAA satellite images as well as Land use land cover changes (LULC). Eventually, these variables are mostly analyzed in isolation. Conversely, Darfour and Rosentrater (Citation2016), notes that these practices are restricted, due to their inconsistent predictions, unreliability and application of unfiltered isolated data. Again, its efficiency is questioned since it requires physical visits to location sites, districts and regions to collect ground data as well as wait on decadal censuses for population and growth data. This practice is not only expensive, but also demands more time for compilation and analysis, and also does not guarantee right results (Deep & Saklani, Citation2014). All these shortcomings can be addressed through automating the urban pattern assessment process using geospatial tools (Gad, Citation2007).
Another challenge with monitoring is addressing its nature. Urban change patterns have been multi-dimensionally observed in literature. For instance, Goodchild (Citation2001) describes urban areas as a heterogeneous space with spatial dependence and multiple points. Correspondingly, urban change issues have been widely evolving with critical elements that are not from population or growth studies and land use cover changes alone. Rather it has other reflective soft elements that contribute to its complexities but are unfortunately unattended to (Bhanjee & Zhang, Citation2018), perhaps due to difficulty in monitoring. In fact, Anselin (Citation1989) and Batty (Citation2008) observe that the urban space could be positioned as a living system with its spatial descriptions serving as its building cells for survival. Every potential outcome in an urban space is a result of the spatial changes and inter-activities that occur and this means that the earlier every indicator is considered better for easy monitoring and proper analysis. Hence, for a proper diagnosis of the rapid urban problems, a coherent scientific approach should be welcomed (Ilieva, Citation2017).
To record precise and timely information about urban space, its variations on urban areas are crucial for effective urban management and decision-making. Therefore, decision-makers and municipal assemblies must embrace the approach of geographic information systems for better monitoring and representation of urban expansion and its effects on local and national development (Coskun, Alganci, & Usta, Citation2008).
This research addresses the complex nature and missing links of urban change, building an argument from the case of Ghana where indicators other than population studies and land cover exist. Again, it questions the existing ideation of isolated analysis and supports the essence for multiscale assessments based on relevant technology to describe, distinguish and disseminate better responses by district and local authorities (Cobbinah & Aboagye, Citation2017). From an in-depth literature research approach involving a desktop search to retrieve literature from scientific databases; visits to identifiable organizations to collect available literature (such as reports) that is either unpublished or difficult to access; and systematic analysis of included studies, a comprehensive gap is drawn.
Furthermore, major literary attempts are made within the urban complexities of Ghana, to identify relevant technology like the geographic information system, where the multi-criteria analysis tool is considered as a concrete tool for priority assessments and measurements for future forecasts and effective decision-making.
2. Conceptualizing the urban change complexities
Urban change may be constructed as a complex system (Cheng, Citation2003). In fact, Batty and Torrens (Citation2001) have described the systems of urban change as a unification of varied agents and entities within the urban stream. Subsequently, this complex system is shaped by the heterogeneous nature of socio-economic occurrences which obviously translate into diverse spatial and temporal characteristics. Conversely, patterns are derived as a result of these complexities of natural and anthropogenic impact on the urban space. These patterns have received academic attention in urban analysis, precisely within habitation patterns (I-Shian, Citation1998), demographic and economic patterns (Ingram, Citation1998), land cover change patterns (Wu & Yeh, Citation1997), land use change patterns (Kiril, Citation1998), and mobility interaction patterns (Jun, Citation1999; Simmonds, Waddell, & Wegener, Citation2011) as described earlier. These studies have focused on the spatial patterns of physical and functional objects (Cheng, Citation2003; Wegener, Gnad, & Vannahme, Citation1986). Comparatively, despite the great attention given to urban change components, the spatial patterns interpretations and complexity modelling of urban change are still deficient, specifically from an urban planning perspective. Generally, urban change complexities are identified with various spatial outcomes (Bhatta, Citation2010) across diverse measures of social, economic and environmental tenets. This definitive attribute given to the urban space pattern is also described as urban dynamic systems. Parker, Manson, Janssen, Hoffmann, and Deadman (Citation2003) further regarded urban complex systems as dynamic systems that present distinguishable patterns of organization across spatial and temporal scales. This describes the multi-variability of urban change patterns posited by various scholars (Kok & Veldkamp, Citation2001; Stein, Riley, & Halberg, Citation2001). Therefore, the complexity of urban outcomes occurs from both the decision-making and the spatial features of the city environment (Parker et al., Citation2003). Besides, cities are complex bodies that a little change in one component considerably affects the states of the other components that are potentially connected (Li, Citation2014) [shown in Figure ]. The essence of urban change as a complex system to be regarded from a multi-dimensional point of view is critical. Presently, multi-scale analysis of the urban domain has attracted intense consideration in pattern modelling (Kok & Veldkamp, Citation2001). Urban change complexity theory is a modern innovative approach within the geoscientific setting essentially adopted for urban planning and decision modelling. It can be adopted as an investigative tool for configuring the relationships between urban collective components, its behavioural system as well as in diagnosing their spatial interactions. For instance, Batty (Citation2009) proposed that urban complex systems are characterized with “unexpected and unimagined or surprised behaviours although visible in patterns”. Consequently, these complexities express some level of change patterns that if well modelled could help address the dynamic nature of urban problems, make accurate future predictions to resolve future outcomes and inform better decision-making, as well as produce sustainable living spaces for human habitation. In that regard, for an effective urban decision-making, complexity modelling of urban change patterns is required to discover the collective and exclusive characteristics by way of exploring the spatial and temporal processes of spatial transitions.
Figure 1. Conceptual map of urban change complexities.
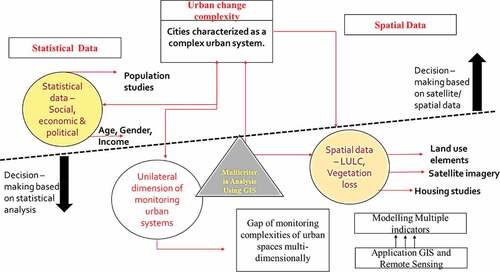
Geospatial inputs through GIS can thus provide quantitative evidence to aid decision-making in urban planning and sustainable urban management (Cheng, Citation2003). Besides, as indicated in [Figure ], adopting a multi-criteria approach “balances” the disparity of limited decision-making based on either statistical inputs or physical or satellite data.
3. Research materials and methodology
The study embraced a coherent approach through critical analysis of literature. Similar to Cohen (Citation2017), a qualitative study was conducted with available literary data gathered and examined across local and cross-national timelines. Following the study objectives, books, peer-reviewed articles and reports on urban change determinants and monitoring interventions were constructively analysed. After a thorough desk study, a content analysis was employed to classify themes and establish relevant data from the literature to better understand how urban change patterns have evolved over the years as well as its applicability in similar urban settings (Cohen, Citation2017).
The study was underpinned by the complexity theory (see Batty, Citation2007) which allowed for synthesizing the morphology of urban patterns through factual insights and real-world happenings.
Moreover, based on official publications and supplementary reports from second-sources; it presented useful data for evaluative study considering the issues identified and thus served as a basis for providing further guidelines in determining the research focus (Merriam, Citation1998). This technique was deemed appropriate in this research, as monitoring the complexities of cities involves some form of verifiable indicators. These are often documented in government reports (development plans and policies). Such documents provided useful information (Pawar, Citation2004). The approach further presented a comprehensive summary and an in-depth analysis of all elements of the phenomenon (Neuman, Citation2003).
An extensive desk-based review of urban change systems and complexities especially across Sub-Sahara Africa was conducted. Specifically, the authors reviewed all available Ghana related urban change scholarly literature published in English. The search engines used for the study were the Scopus database, Google Scholar, SAGE and SPRINGER Journals online, JSTOR, Sci-hub database, WorldCat and Google search. The Ghana-urban change complexity and indicators literature dated back to 2000 and included over 30 sources. The search for indicators such as population growth, density, land use land cover changes, was guided by search words such as population growth rate, land use changes in Ghana, urban complexity in Ghana, and urban transitions (Cohen, Citation2017). The other search words were housing census in Ghana, distribution of transport systems. The rest were existing urban monitoring systems, and factors that affect the monitoring and evaluation of emerging cities.
Also, varied methods concentrating on the use of official data sources and publications from Statistics in Ghana Statistical Service (GSS) and nongovernmental institutions on population size, housing and density were adopted. It also reviewed changes in annual urban housing to trace trends in urbanization. Population growth rates were computed using the natural growth model from demographic analysis (Ruhiiga, Citation2014). For example, Growth Rate GR = P (t2)-P (t1)/P (t1) where GR = growth rate; P = period, t1, t2 = are the two specified time periods for which the growth is computed (Ruhiiga, Citation2014). The change in population is commonly expressed as a percentage. Note that the GR value has imbedded within it (BD) + (I-E) where B, D, I, E stand for birth, death, immigration and emigration consecutively as growth determinants. Again, other institutional documents provided information on key principles of urban management, geospatial technology and planning while the annual reports of the municipalities were used to monitor the extent of spatial complexities in Ghana and Africa.
The authors used a grounded theory approach to evaluate the main content of each article and derive core themes and indicators that were the basis for synthesizing the literature.
4. Existing monitoring methods of urban change complexity
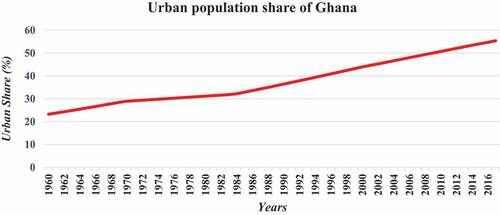
Monitoring urban changes have largely been limited to the determinants of population distribution and vegetation or environmental indicators with occasional reference to the land use land cover changes. The World Bank (Citation2013) and Statista (Citation2018) (shown in Figure ) have examined the urban patterns of Ghana on the basis of their population measure with less or no attention given to other indicators of urban change.
Figure 2. Urban Population Share of Ghana from 1960 to 2017.
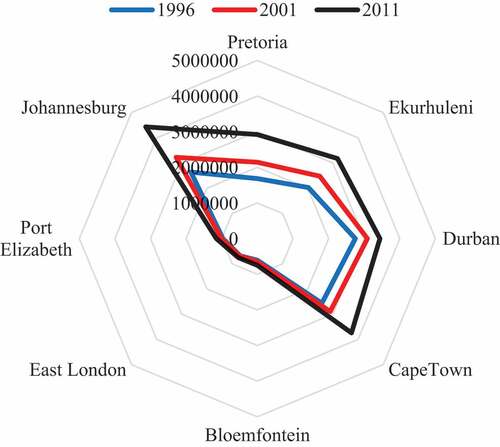
From South Africa, Ruhiiga (Citation2014) equally assessed the urban change pattern of eight (8) cities such as Johannesburg, Pretoria, Cape town, Durban, and others (shown in Figure ). However, like Songsore (Citation2009), the urban patterns of these cities were analyzed by Ruhiiga (Citation2014) based on their demographic and economic indicators. For instance, Figure indicates a spiral flow of population change between South African cities showing significant changes from 1996 to 2011. Although these change patterns differ from city to city, combining its growth indicator with other spatial metrics could facilitate a substantial viewpoint of the urban space. Nonetheless, like the case of Ghana, a more appreciable outlook could be revealed when this non-spatial data is merged with a spatial data.
Figure 3. Population distribution pattern in South Africa from 1996 to 2011.
In fact, Reis, Silva, and Pinho (Citation2014, p. 2015) discovered that urban change goes beyond its conceptual simplicity of demographic and physical evidence as it further describes an evolving dynamic process. Studying further, three varied concepts of urban change are discovered in the urban and regional planning literature. These relate to population change, economic features, as well as the spatial expansion of urban areas (Rieniets, Citation2009). Moreover, whereas the demographic measurement of urban change focuses on population trends and migration, other game changers come to play. An example is the processes of expansion and contraction parameters. These include timescales, landscape metrics and others which may also occur concurrently within the same urban system, resulting in cumulative geographic polarity among and within cities (Oswalt & Rieniets, Citation2006; Pallagst, Citation2005). These measurable and non-measurable units of indicators contribute to the complex nature of urban systems and therefore urban management theories and techniques should be equipped to measure, monitor and regulate these processes (Banzhaf, Kindler, & Haase, Citation2006). This request for an innovative perspective on the change of cities, that places assessable and non-assessable, complex and non-complex urban components side by side; as equally considerable and natural trails of urban change outcomes.
The Ghanaian case of urban change has been widely polarized with concentration on urban population studies and housing developments as the main focus for measuring and monitoring urban impact. For example, most institutions such as the Ghana Statistical Service, in their quest to measure the pattern of growth and change in the country mostly dwell on the demography and housing characteristics of urban areas, and thus conduct “Population and Housing Census”. Although these provide steps closer to the quantification and monitoring of the urban space, it inhibits the complexity domain which the urban pattern of Ghana possess.
On the other hand, various scholars have equally considered the change pattern based on Land use land cover changes (Addae, and Oppelt, Citation2019; Kleemann et al., Citation2017; Yeboah, Awotwi, Forkuo, & Kumi, Citation2017). In these instances, the vegetative cover, growth and use of urban and peri-urban spaces were measured over time. These measurements were fairly static and poorly recognized the continuous dynamic nature of urban areas. Nonetheless, it is worth noting that the urban scale has evolved to a multi-dimensional one and for that matter, the quest is now shifting to multi-analysis decision-making, particularly, to better connect the complex dots that exist in urban management. Accordingly, within the urban philosophy lies a varied harmony among researchers, policymakers, and planners, who believe that the future development and management of urban areas require detailed information about its continuous processes and patterns (Batty, Citation2009; Kotze, Donaldson, & Visser, Citation2014). These patterns can be scientifically mapped, monitored and precisely examined from satellite data along with traditional statistical data through RS and GIS techniques (Araya & Cabral, Citation2010). They could be used as efficient tools to identify, assess and map land use changes (Reis et al., Citation2014). Despite the potential of Geographic Information Systems and Remote Sensing techniques adopted for understanding urban patterns, dynamic processes, and their relationships, they have less been utilized within the cities in Ghana.
5. Urban change assemblage and change indicators
Residential, occupational and other human developments have altered the structural landscape of the surviving natural lands (Mertes, Citation2014). This process largely contributes to the change pattern of the urban background. As reiterated by Bhatta (Citation2010), the outlook of cities is measured through evolving physical features coupled with functional or economic characteristics. In emerging regional science, the urban philosophy is more concentrated with concepts of space and less with time. For instance, the location theory, to be precise coupled with the land-use rent theory (Alonso, Citation1964), is virtually exclusively based on the concepts of accessibility and balance of demand and supply. However, the urban discourse completely loses sight of the modification processes essential to achieve that stability (Pijanowski & Robinson, Citation2011; Wegener et al., Citation1986). In effect, addressing these complexities relies on solidly defining the components of urban change patterns vis-à-vis their measurement arrangements to make practical decisions. There are various ways of categorizing the urban space and its change patterns. For instance, just as there are many ways to define urban sprawl or growth, there exist variations in measuring the phenomenon of urban changes (Larson, Citation2006). Conversely, Bowyer (Citation2015) has suggested that urban changes and sprawl are a complex phenomenon with no single definition. This therefore allows for urban change to be defined per certain verified indicators in urban literature. Lambin, Rounsevell, and Geist (Citation2000) define urban changes per the attributes of land-use land cover changes and agricultural land depreciation. In the same urban discourse, scholars such as Bowyer (Citation2015); Galster et al. (Citation2001) describe urban change patterns based on an array of physical, social and economic factors such as density, accessibility and transportation, land use and land cover changes and population growth. These indicators are known to be recurring quantified processes that can be traced over time to provide information about continuity and change with respect to a particular phenomenon (Cheng, Citation2003). These indicators set the pace of practically assessing the growth and change patterns of urban systems (Chong, Citation2017).
Urban changes result from an evolution of a non-urbanized space into an urban space of complex uses, substantially and functionally (Cheng, Citation2003). Further, the physical representation of spatial changes, coupled with aspatial (human dimension) variations is important for its study. Descriptions of urban changes and urban expansion are a critical component of any urban mapping methodology as they help in displaying the spatial interactions between the natural and human systems (Mertes, Citation2014).
6. Results and findings in Ghana
6.1. Analyzing complex urban change systems in Ghana
The conception of the urban space phenomenon embraces the ideals of urbanization as a critical change system that contribute to the urban differentials of most developing countries (Hagai, Citation2014). Satterthwaite et al. (Citation2010) hypothesize urbanization into two perspectives thus: the level of urbanization and the rate of urbanization. Subsequently, the levels of urbanization are described as the share itself, and the rate of urbanization as the frequency or speed at which that share is occurring. This definition makes the implications of urbanization distinct from those of urban population growth or those of the physical expansion of urban areas, both of which are often treated as synonymous with urbanization. It rather identifies with the term “urban change” as a collective spatial and temporal difference that occurs in the urban setting.
In 2000, the expansion level of Ghana was nearly 44 percent whereas the value for Africa was 37.9 percent. It is now estimated to reach 55.41 percent by 2018 (GSS, Citation2014a, Statista, Citation2018). Also, the urban population of Africa alone is expected to swell from 297 million to 766 million by 2030 (UNFPA, Citation2007). This implies that the number of people living in cities will account for an augment from 1 billion to 4 billion individuals (Sova, Citation2016). This striking shift towards a more urban world calls for cross-institutional and stakeholder collaborations, pragmatic market synthesis, infrastructure and food reform policies as well as geospatial innovations to tackle the multi-dimensionality of modern urban complexities (Tokody & Mezei, Citation2017). Intensifying urban changes within the context of urbanization is a principal driving force, causing stresses in many African economies. With an average growth rate of 3.71 per cent, Africa is perhaps the fastest urbanizing region in the world (Oduro, Adamtey, & Ocloo, Citation2015).
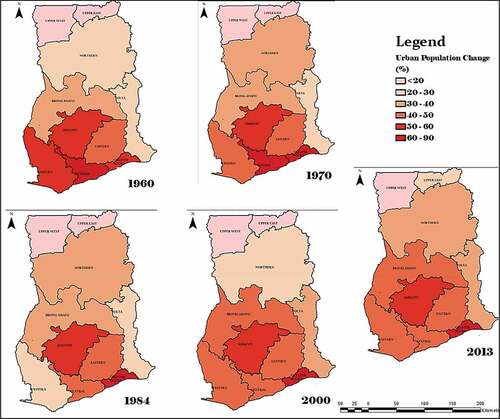
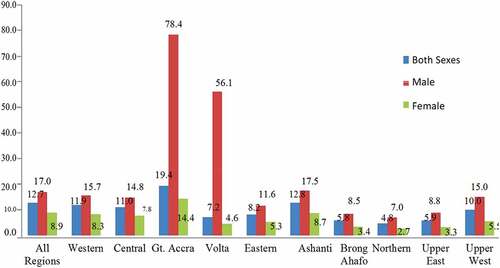
Accordingly, in reviewing the regional urban differential, Ghana’s urbanization process plays a key role as Ghana’s 2010 population and housing census disclose that more than half of the Ghanaian population (55.41%) reside in urban centers (GSS, Citation2013, Statista, Citation2018). Interestingly, urban changes in Ghana vary regionally particularly from as high as almost 91 percent in the Greater Accra Region to as low as 16 percent in Upper West Region (Kassanga, Cochrane, King, & Roth, Citation1996, GSS, Citation2013). Ashanti Region comes next to Greater Accra as the most urbanized with almost 61 percent of its population living in localities classified as urban in 2013 (Figure ). Prior to the country’s post-independence, central region recorded high urban concentrations due to its pre-historic fame where its capital cape-coast was a colonial city. However, the turn of events of moving the capital to Accra had a great impact on the urban record of the region till date. Realistically, Greater Accra’s high urban rank is expected, considering its position as the National capital city, whereas it also combines with Tema as the nation’s largest economic hub (GSS, Citation2005). Consequently, the trends of urban change in Ghana appears that the regions with the minimum urban proportion also doubles as regions that are noted for high volumes of out-migration (GSS, Citation2014a). This submits that migration plays a crucial role in the rate of urbanization in this particular geographic setting.
Figure 4. Urban growth evolution of Ghana (from 1960 to 2013).
As Ghana’s urban landscape increasingly developed over time, it allows it to experience economic transformations (such as constructional growth – good road access, better social service and health care, etc.) and these have impacted urban livelihoods of the citizenry (Ayerakwa, Citation2017). However, the conception of UN-Habitat (Citation2011) states otherwise. According to them, urban changes in Ghana have resulted in high unemployment rates, environmental deprivation, poor structural developments, crime inclination, poverty and food inequalities among others. It further argues that “the benefit from urbanization and urban changes are yet to materialize”; implying a strong deflation of the hype between urban relevance and urban living. Admittedly, the urban process is somewhat skewed to certain locations breeding over concentrations and accounting for the urban mess or imbalance between provision of commensurate social amenities and loss of environmental controlling. For instance, there is an ill distribution across the national territory of Ghana with its four leading cities alone accounting for over 50 percent of the national total urban population. Besides, though the country is now classed as middle income, its cities are growing rapidly particularly at 1.6 million and 1.2 million, respectively, within the dominating cities of Accra and Kumasi. Consequently, sprawling effects, collective pressure on urban resources, sporadic disaster events as well as disruptive urban food systems have become quite alarming (Charreire et al., Citation2010).
Eventually, as Ghana’s urban areas continue to gain great prominence (for both the good and bad), the appropriate tools of identifying, recording and effectively managing its large problems prove to be a herculean task for researchers (Devereux et al., Citation2004). The challenge likewise consists of selecting valid and reliable sets of manifest indicators from urban trends such as population influx, housing variances, resource pressure, sanitation and waste management, food insecurity among others; and further transforms these data sets into a one-dimensional scale of analysis (Bhatta, Citation2010). Although various techniques exist (such as statistical and theoretical analysis tools), the adoption of Geographic Information Systems (GIS) for inferring urban measurement scales from the list of urban management indicators discussed below (section 5.1–5.6) could be useful for determining the complexity of urban Ghana.
6.2. Urban change growth rates
The unparalleled population growth combined with the unplanned developmental activities in Ghana leads to gross changes in the urban landscapes.
Ghana’s urban history is traced as far back as 1960 where urban population growth was less than 20 percent in many regions (Table ). Subsequently, it has grown to an outstanding 51 percent in 2010 and keeps expanding year by year. Urban change growth rates are one of the key metering systems for describing the relative change of any given human space. Accordingly, it compares the proportion of variation visible in an urban area in relation to its residents (Jat, Garg, & Khare, Citation2008; Pijanowski & Robinson, Citation2011). Urban change growth is fairly connected to population growth (Songsore, Citation2009) and abstracted as one of the significant urban indicators. In fact, GSS (Citation2014a) in their urbanization report defines urban growth as “increases in the population of an urban locality or area between two points in time”. Besides, in Ghana, an area qualifies to reach urban status if its population growth reaches 5000 inhabitants (Adarkwa, Citation2012). However, it is agreed with GSS (Citation2014b) that this background of measuring the population size alone is not enough to classify an area as an urban locality. As a result, rapid population growth without its corresponding structural developments and sufficient supply of essential services with its direct economic opportunities are conducive for urban disorders (Hegazy & Kaloop, Citation2015). Thus, a spatially balanced system that creates manageable population concentrations with monitored and harmonized urban needs promises a more complete definition (Bowyer, Citation2015).
Table 1. Regional distribution of urban share in Ghana (1960 to 2010)
6.3. Urban density
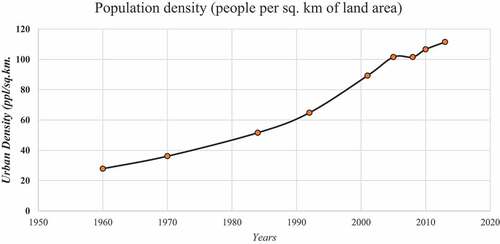
This is also one of the popular indicators as part of urban growth that measures the definition of the ratio between the expanse of a certain urban activity (e.g., residential units) relative to the area in which it takes place (Knaap, Song, & Nedovic-Budic, Citation2005; Lowry & Lowry, Citation2014). It helps to aggregate the number of people or unit per land area to appreciate the growth or decline trend of the area. Urban densities determine the concentration of the built-up area as well as the intensity of detailed land uses within the urban setting (Galster et al., Citation2001). What defines the urban scene and makes it different from other natural terrain is the high proportion of man-made functions and high variation of surface constituents (Mosammam, Citation2017). Murcko (Citation2017) describes these agglomeration of artificial impervious surfaces coupled with human activities as built-up areas. He further defines urban built-up areas as regions which contain structural information about the urban domain, including buildings and open spaces, such as roads or parking lots. Usually, urban densities are calculated using ratios of population, number of activities or residential units per sub-area of development. Urban densities are gross or net, where its gross density is calculated per the total area whereas the net density is calculated per the unit area (Frenkel & Ashkenazi, Citation2008). Some schools of thought arguably note that urban densities take many forms and therefore have different imports (Meenar, Citation2017; Wray & Cheruiyot, Citation2015). Yet, Galster et al. (Citation2001) among others suggest that the most popular and widely represented means of measure are population and housing densities (Meenar, Citation2017; Wu & Yeh, Citation1997). Population density measures the proportion of residents per unit area of land whereas housing density describes the ratio of occupied houses/structures per unit area. These density indicators remain significant determinants for measuring urban status of districts, sprawl and levels of visible complexities of the identified within built-up areas ((Frenkel & Ashkenazi, Citation2008). Research findings from a number of case studies like Ghana indicate that high population density (concentration levels) may possibly lead to gross decline of agricultural production, urban congestion, poor mobility and traffic generation, environmental degradation among others (Ngie, Abutaleb, Ahmed, & Taiwo, Citation2013; GSS, Citation2014b). According to FAO (Citation2014), statistics shown in Figure reveal that Ghana’s urban densities are mounting beyond its capacities, no wonder its notable rise in the sporadic incidence of disasters especially flood events (Twum & Abubakari, Citation2019) among other epidemics. This has deprived the country too much resources. If urban densities are not carefully measured and monitored in Ghana regarding its urban change complexities; it equally stands the risks alongside the inclination of food insecurities, economic inequalities, unemployment, waste and poor sanitation.
Figure 5. Urban density of Ghana from 2001 to 2013.
Among other pointers, urban density commands an exclusive area of the urban literature as it critically examines the relationships and dynamics within the urban scale. It is sometimes used as a metric to determine sprawl and informality in a given urban area. It is therefore an obvious indicator for measuring urban change visibility. Additionally, the adoption of Geospatial technologies promises an effective observation of this pattern over time especially when multi-dimensionally assessed with other indicators.
6.4. Urban land use and land cover changes (ULULC)
Every urban form is shaped in space. This means that the relativity of its changes is directly guided by the change pattern of its use. As indicated by Reis et al. (Citation2014), urban change can easily be experimented through the observation of conversion forms from non-urban into urban land use over time or by assessing the coverage change of green areas or pervious surfaces. Currently, the ecological characteristics and the socio-economic dynamics are modelling the land use structure of many cities (Frenkel & Ashkenazi, Citation2008; Ngie et al., Citation2013). Conversely, it must be noted that these elements are not in isolation within space and time, they co-dependently illustrate the spatial structure of urban change (Potere & Schneider, Citation2007). The expressions of land use and land cover have gained popularity and often used interchangeably in geospatial literature (Li, Citation2014), though they represent different things. Notably, the term land cover refers to the physical cover of the land. It is defined by Murcko (Citation2017) as the bio-tangible state of the internal and external face of the earth including vegetation, soil, topography, water and human developments (Turner, Citation2009).
On the other hand, urban land use could be described as the human dimension of the land cover type (Kiril, Citation1998). It is precisely explained as a social purpose and not a set of physical quantities (Cheng, Masser, & Ottens, Citation2017). Foody (Citation2002) reveals that whereas land cover is an essential variable that influences and links many parts of the human and physical environments, Land use is a more complicated term. Therefore, he defines land use as the human modification and management of a land cover. Principally, it is seen as the culture of land exploitation to meet human demands (Meyer & Turner, Citation1996). Typical land uses are industrial, commercial, residential purposes among others (Li, Citation2014). Land use land cover diversity metrics measure whether an urban settlement is more mixed or mono-functional, normally calculating the number of different land uses present (Yeboah et al., Citation2017). It also addresses by combining other variables, the monitoring of the trend of urban change contributing to better policies and projections in future. Tappan et al. (Citation2016) highlighted the evolving complex nature of Ghana and West Africa. Figure shows the physical variation of the land cover patterns of Ghana with revelations between the 38-year period of 1975 and 2013.
Figure 6. Land use land cover map of Ghana, 1975 to 2013.
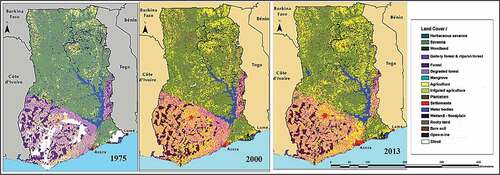
Ghana’s rapid population growth is mirrored in the fast urban expansion of the urban land cover change patterns. Tappan et al. (Citation2016) determine that at a coverage of 1,460 sq km in 1975, urban change had extended to 2,560 sq km in 2000 and 3,830 sq km in 2013. Subsequently, about 161 percent of urban change has occurred within the 38-year period in Ghana. According to (GSS, Citation2013), the national metropolis of Accra area alone accounts for about 4 million urban share with Kumasi over 2 million, and Tamale about 370,000. With LULCs, the expansion of urban changes to natural areas such as forests is evidently assessed. A typical land cover change in Ghana is the degradation of forest. The forest class (represented primarily by Ghana’s dense evergreen rain forest and moist deciduous forest) (Figure ) displays a little area reduction from about 16,400 sq km in 1975 to 15,500 sq km in 2000, recording a 5 percent change. However, due to urban changes, this decline rapidly accelerated between 2000 and 2013, where forest reserves have reduced by an additional 20 percent, with 12,400 sq km in 2013 (Tappan et al., Citation2016). Successively, the degraded forests represent a derivative from the dense vegetation that has experienced human modifications. Ghana’s land use and cover remains unsustainable, principally due to the less attention given to associated indicators, change monitoring and complexities within the urban space.
The application of Remote Sensing and Geospatial Techniques would cause quantitative detection of urban changes with LULC indicators, which will help identify visibly how and how much different urban land cover patterns have changed over time. However, merely describing different urban land cover pattern change cannot identify urban expansion dynamics clearly (Zhang, Citation2016). This suggests the essence for a multiscale spatial system to monitor this complex discourse if practical decisions are to be made.
6.5. Urban footprints (accessibility/mobility)
This urban indicator determines the arranged and non-arranged movements that shape urban forms. The level of accessibility determines the rate and level of urbanization (Lowry & Lowry, Citation2014; Simmonds et al., Citation2011). In instances of road transport networks, areas that are highly motorable are well placed for attracting higher populations and uses. Subsequently, a good transport system increases land accessibility for cultural development (Reilly et al., Citation2009). Urban residents through mobility, access public facilities, utilize their occupation (commercial) areas to satisfy needs (Wray, Musango, & Damon, Citation2013). Typically, in cities, transport and mobility do not only connect lives and uses but also transforms the landscape of urban footprints considering its varied strengths of impact and potential to attract people and development (Knaap et al., Citation2005). Urban accessibility development therefore plays an important role in molding the urban growth pattern and are the most unpredictable manifestations of urban change, but at the same time, the most easily observable (Batty, Citation2008).
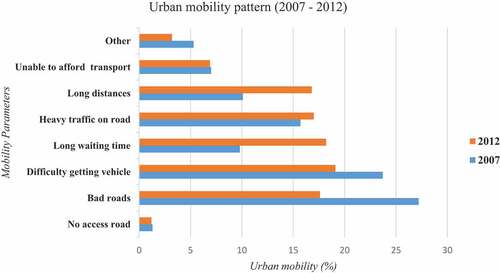
However, one major challenge associated with accessibility is mobility and its management. This pattern of urban change aggravates concerns with traffic congestion including automobile dependency, increased water demand, and increased energy demand. This is common in developing cities and the urban communities of Ghana are no exception. Figure shows the pattern of urban mobility in Ghana indicating a swift transition of movement patterns advancing from 2007 and 2012 despite the infrastructural limitations. As population rises and land uses incline especially towards economic uses, congestion and overcrowding occur breeding sprawl, slums and informality. Such informal urban systems have become one canker that has gained notoriety as places of poor sanitation and congestion—a major concern for city authorities. Thus, with a systematic urban change monitoring, urban decision-makers could be well informed to plan ahead of time to capture projected outcomes when designing future plans and frameworks.
Figure 7. Urban mobility pattern of Ghana in 2007 and 2012.
6.6. Urban timescale/spatial geometry
The formation and assembling of cities are directly influenced by its rate and time factors (Reis et al., Citation2014). The expansion and contraction rates of the urban place are determined liberally by its changes over time. Therefore, in the discussions of monitoring the urban complex system and change determination possibilities, the element of time is essentially required. It voluntarily narrows down the scope of urban theory as it remarkably contrasts the interest in temporal patterns taken by related disciplines (Galster et al., Citation2001; Torrens & Alberti, Citation2000). This urban dimension strategically measures the direct arrangement and composition of elements in urban areas. Whereas some scholars define this criterion to be isolated but discrete and uneven, with a composition for predictability (Knaap et al., Citation2005), others interpret it as a process which is viewed in three successions or tempos, thus slow, medium-speed, and fast processes. (Wegener et al., Citation1986).These underscore the urban assemblage to also assume a temporal state that could be measurable upon its degree of configuration (Lowry & Lowry, Citation2014). These urban timescale forms are loosely defined as the spatial-temporal heterogeneity of land changes and allow for the identification of fast and slow areas. Urban areas are regions with a high level of spatial dynamism where their size is rapidly increasing. Therefore, a set of descriptive dimensions of urban change processes has been developed based on a stimulus-response scheme (Frenkel & Ashkenazi, Citation2008). Further, this urban change complexity indicator situates cities in stages.
The first urban timescale component is the slow process and this involves the construction stage, where the physical construction of cities displays a significant stability over time dominating even after major destructions such as wars, natural or human-induced disasters such as fires, floods, etc., have occurred (Batty & Longley, Citation1994). The first dimension identifies the process itself or the stimulus (Simmonds et al., Citation2011; Wegener et al., Citation1986). The second one identifies which stock is affected by the change (Kok & Veldkamp, Citation2001). This change usually rises with slow times. Subsequently, there are constructional changes concerned with capital-operative arrangements which have an average lifetime of over 50 years (Batty, Citation2008). The next stage is the medium speed of change characterized by economic, social and technological change for which the urban variation is more rapid and less predictive. These changes principally reflect the material transition of the production system from primary and secondary to tertiary industries caused by technological innovation and changing consumption patterns (Bretagnolle, Daudé, & Pumain, Citation2006). Again, they reflect global phases of prosperity and decline, exports and imports, resources and prices. Additionally, this phase of urban change has regional features that try to respond to externally imposed economic variation, even if local resistances form the labour market (in the growth case) or union power and government controls (in the recession case) delaying the urban adjustment process (Batty, Citation2008). This affects various aspects of the urban fabric particularly the economy, the social composition of the population, the communication systems, among others [see Figure ]. When urban settings advance to this stage, it exhibits various forms of complexities other than population and land change configurations (Adarkwa, Citation2012). The final stage is the fast speed urban scale which is mainly characterized by mobility. They comprise the mobility of people, goods, and information within particular buildings and communication facilities such as internet and technology advancement. In the case of Ghana, many regions are yet to reach this stage of complexities. However, from Figure , the Greater Accra region known for its urban primacy records high volumes of urban internet communication which is also a sub-indicator of urban change complexities within the urban spatial geometry.
Figure 8. Population of urban localities 12 years and above using internet by sex and region.
The complex changes also range from job relocations and move to the daily pattern of trips and communication (See Figure ). For instance, companies relocate from a particular zone for vacant building space, workers decide to accept jobs more conveniently located to their place of residence, households move into vacant dwellings which largely leads to sprawl and informality in the cities. These types of mobility involve substantial costs and effort and are therefore normally undertaken every five (5) or more years to monitor (Batty, Citation2007; Wegener et al., Citation1986). This urban level does not necessarily involve structural change of cities like the distribution of activities, but the intangible outcomes like the composition of vacant and occupied stock, that is, workplace and housing occupancy among others. Conversely, average regular trips have no impacts at all on any distributions in the urban system, since they start and end at the same place (Simmonds et al., Citation2011). However, their linkages, daily occupational and social trips have a vague temporal arrangement: since they form habitual patterns that do not change much faster than workplace and household locations. Therefore, they are clearly less influenced in urban decisions in the short term, but in the long term, they play an essential role for location decisions through the accessibility they generate. Over the years, attempts to reconstruct the urban fabric from a space-time range of activities have received less attention and gained low followers for discussions. However, for a coherent achievement of a better urban decision model, it is imperative to track the urban changes from the timescale perspective. Urban complexity monitoring as a process of dotting the differences in the urban state by remotely observing it at different times will aid in observing results from anthropogenic forces that have resulted in modification of the environment. This requires the relevant temporal dimensions of the urban environment to be considered (Hegazy & Kaloop, Citation2015).
6.7. Urban beauty/aesthetics
Urban literature has narrowed patterns of the urban change to the physical expanse that loosely describes the rate of change in its appearance and aesthetic form. Many urban schools of thought have focused on the green landscape with traces that makes reference to the depletion and frequency of green destruction. Incidentally, the position of the urban outlook reflects various dimensions of the visible urban space which conforms to the structural, environmental and the attractiveness that simulate economic benefits as well. Besides, the urban fabric is woven in a way that creates in itself a pattern and level of acceptable look. It has been widely assessed and observed that although occupant surveys and landscape (change) evaluations define models of urban change patterns (for example; Torrens & Alberti, Citation2000) nonetheless, to measure, quantify and track the pattern or change of the urban system, it is imperative for its aesthetical component to be considered (Frenkel & Ashkenazi, Citation2008). Realistically, its complication of monitoring and assessing requires high subjectivities since beauty has an individualistic view-point. Nevertheless, steps can be taken to harmonize traditions and conventions related to the cultural and social relevance to help address the challenge. In effect, the most important thing and an objective of this study is to focus largely on attempts that can help in decision-making by adopting a multi-purpose framework or tool for assessments and monitoring. This approach promises endless possibilities of multiple analysis and synergy of related urban indicators that can be predicted through time and space.
7. Linking complexities with GIS—the relevance of MCDAs
Many local authorities require information ahead of time in order to take preemptive and adaptive strategies for human settlement development, particularly in urban communities where trends are complex (Shoko & Smit, Citation2013). The rapid development and integration of spatial technologies such as Geographic Information Systems (GIS), the Global Positioning System (GPS), remote sensing and drones have led to the creation of an endless range of possibilities for smart urban planning and decision-making (Wray & Cheruiyot, Citation2015). Accordingly, with the advent of geospatial technologies and satellite data operation, experts and governments are shifting their perspective to the wide range of utilizing their potentials for effective spatial management (Crush, Hovorka, & Tevera, Citation2011). GIS is a modern-day innovation that allows professionals to acquire, store, manipulate, analyze, manage, and present spatial or geographic data in various ways that are applicable for better spatial modelling (Belal & Moghanm, Citation2011). One of the key methodologies that has received less popularity in developing countries is the Multi-criteria Decision Analysis (MCDA) model approach.
MCDA methods are adopted to make complex decision within the urban domain (Pavan & Todeschini, Citation2009). It is often used to highlight the option of analysis and supports local authorities in making the best decision (Bowyer, Citation2015). MCDA methods are adopted to make complex decision within the urban domain (Pavan & Todeschini, Citation2009) and would often highlight the option of analysis for supporting local authorities in making the best decision (Bowyer, Citation2015). It uses the set of variable indicators that guides urban change complexities. In fact, the urban spectrum is characterized with evolving change indicators and for that matter requires a modern and systematic system of measuring its changes (Bowyer, Citation2015). Consequently, the principal aim of MCDA is to help City authorities and urban policymakers to synthesize information and make well-informed decision. Essentially, Pavan and Todeschini (Citation2009) describe the MCDA as a prospective tool that integrates spatial measurable dimensions with subjective non-spatial variables to describe urban change complexity patterns. Whereas Youssef, Pourghasemi, Pourtaghi, and Al-Katheeri (Citation2016) recommends, Chandio et al. (Citation2012) confirm that the GIS-based multi-criterion analysis approach is the best way of assessing land suitability of urban development in different environments.
Indeed, the MCDA allows for flexibility and innovation within the urban framework to effectively predict the implication of change patterns for present and future decision-making. It is worth noting that urban management decisions do not only demand the selection of best alternatives but also consider prioritization of algorithms using MCDAs to facilitate resource allocations, identify areas of interest for immediate interventions, control haphazard growth among others. Additionally, the system breaks the complex issues of cities into its smaller components (indicators) and institutes a way of weighing and ranking the indicators vis a vis available alternatives to arrive at a scientific conclusion. Identifying the array of indicators is however a central task. Accordingly, urban variations are grouped into explicit and implicit MCDA theories. The explicit indicators are clearly defined and listed called “multi-attributes” whereas those that are implicitly defined are mathematically programmed known as multi-objective optimization theory (Pavan & Todeschini, Citation2009). In essence, the approach attempts to represent the fix and loose ends of the urban space phenomenon based on individual criterion (Department for Communities and Local Government, Citation2009).
7.1. Application of GIS in monitoring urban change—case of other cities in Africa
Monitoring urban expansion and growth is a growing concern across all emerging economies in Africa (Heppenstall, Malleson, & Crooks, Citation2016). This has therefore called a lot of city authorities adopt GIS as a spatial technique to monitor and control urban complexities. For instance, referring to Hagai (Citation2014), city authorities adopted GIS to control urban complexities in relation to its effect on food insecurity. GIS enhances the choice of and predict potential hotspots that indicate insecurity, hunger and poverty. This among others is shown in Table below.
Table 2. GIS Applications in selected cities in Africa
8. Conclusion
Urban change is a complex phenomenon with a wide range of definitions and connected measurement methods. In this study, urban change forms were described on merits of available indicators within the complexity position of urban Ghana. With a unique urban history, the country’s built-up transition pre-dates the colonial era, where urban patterns were shaped by political decisions. However, in the last two decades, it has become one of the most urbanized countries within the African sub-region as a result of its multiple cause of urban growth. Its spatial pattern like other countries possesses some degree of complexities and keeps emerging with associated problems.
From the evidence presented using the case of Ghana (where the pattern of urban change is skewed with traces of urban primacy), indicators of this complex change tendencies are determined. In examining the existing methods of measuring and monitoring urban patterns, the study revealed other relevant pointers that contribute to urban change systems.
It is noted that the complex urban forms of cities in the global south are shaped by uniform and non-uniform patterns which require consistent monitoring tactics. The study identified the plurality of complexities and changes in urban spatial units and further argued for a possible approach that embraces a multi-dimensional perspective in analyzing spatial and non-spatial data.
It appreciates the importance of diagnosing and monitoring urban change complexities using GIS techniques, as it promises a relatively faster and convenient approach. Again, it observes the need for effective and rational predictions through GIS modeling which is highly scalable and guarantees prospects for integration of other related datasets, e.g., from emerging satellite images. Thus, the approach connected all urban indicative phenomena such as urban growth, density, land use land cover changes, among others to make a significant contribution towards the literature of urban development and management.
The study concludes that strengthening local decision-making and mitigating Ghana’s numerous urban problems essentially require a system which practically addresses the complex and dynamic nature of urban change. It proposes the use of MCDA and GIS as a tool for city authorities to fundamentally address urban challenges better as well as control growth and predict future outcomes.
Additional information
Funding
Notes on contributors
Kwaku Owusu Twum
Kwaku Owusu Twum is a Geospatial technologist and research consultant with academic and professional experience in Ghana. He holds a Bachelor degree (Bsc.) in Human Settlement Planning and Master of Philosophy (Mphil.) In Geographic Information Systems (GIS) all from the Kwame Nkrumah University of Science and Technology, (KNUST) Kumasi, Ghana. He is the Co-founder of Huts and Cities Ltd. a Start-up research consultancy and IGITECH Spatial Solutions Ltd. Kwaku’s interest lies within but not limited to spatial modelling and analytics, smart city development, natural resource governance, sustainable urban management and development, food security and water resource management. He seeks to continuously influence the local and global space with practical knowledge and technology. His key objective is to use spatial technology and planning dynamics to leverage the data gap as well as balance the environmental disconnect in Africa and other developing economies.
Related Research Data
References
- Adarkwa, K. K. (2012). The changing face of Ghanaian towns. African Review of Economics and Finance, 4(1), 1–29. Published by Print Services, Rhodes University, P.O. Box 94, Grahamstown, South Africa.
- Addae, B., & Oppelt, N. (2019). Land-use/land-cover change analysis and urban growth modelling in the Greater Accra Metropolitan Area (GAMA), Ghana. Urban Science, 2019(3), 26. doi:10.3390/urbansci3010026
- Alonso, W. (1964). Location and land use. Cambridge, Massachusetts: Harvard University Press.
- Anselin, L. (1989): What is special about spatial data? Alternative perspectives on spatial data analysis (Technical Report) 89–4
- Araya, Y. H., & Cabral, P. (2010). Analysis and modeling of urban land cover change in Setúbal and Sesimbra, Portugal. Remote Sensing, 2, 1549–21. doi:10.3390/rs2061549
- Ayerakwa, H. M. (2017). Planting to feed the city? Agricultural production, food security and multi- spatial livelihoods among urban households in Ghana Lund. Sweden: Lund University.
- Banzhaf, E., Kindler, A., & Haase, D. (2006). Monitoring and Modelling Indicators for Urban Shrinkage - The City of Leipzig Germany. Paper presented at the 2nd Workshop of the EARSeL SIG on Land Use and Land Cover, Bonn, Germany.
- Batty, M. (2007). Complexity in city systems: Understanding, evolution and design. CASA Working Paper Series, Paper 117, Centre for Advanced Spatial Analysis (CASA), London: Universtiy College London.
- Batty, M. (2008). The size, scale, and shape of cities. Science, 319(5864), 769–771. doi:10.1126/science.1151419
- Batty, M. (2009). Urban modelling. In R. Kitchin & N. Thrift (Eds.), International encyclopedia of human geography (pp. 51–58). London: Elsevier Science.
- Batty, M., & Longley, P. (1994). Fractal cities: A geometry of form and function. London: Academic Press.
- Batty, M., & Torrens, P. (2001). Modelling complexity. The limits to prediction. Cybergeo: European Journal of Geography, 201.
- Belal, A. A., & Moghanm, F. S. (2011). Detecting urban growth using remote sensing and GIS techniques in Al Gharbiya governorate. The Egyptian Journal of Remote Sensing and Space Science, 14, 73–79. Egypt. doi: 10.1016/j.ejrs.2011.09.001
- Bhanjee, S., & Zhang, C. H. (2018). Mapping latest patterns of urban sprawl in Dar es Salaam, Tanzania. Papers In Applied Geography, 4, 292–304. doi:10.1080/23754931.2018.1471413
- Bhatta, B. (2010). Analysis of urban growth and sprawl from remote sensing data. Berlin Heidelberg: Springer.
- Bowyer, D. (2015). Measuring urban growth, urban form and accessibility as indicators of urban sprawl in Hamilton, New Zealand (Master degree thesis). Department of Physical Geography and Ecosystem Science, Lund University, Sweden.
- Bretagnolle, A., Daudé, E., & Pumain, D. (2006). From theory to modelling: Urban systems as complex systems. Cybergeo: Revue Européenne De Géographie. N° 335, 08 mars 2006. doi:10.4000/cybergeo.2420
- Burgess, R. (2000). The compact city debate: A global perspective. In M. Jenks & R. Burgess (Eds.), Compact cities: Sustainable urban from for developing countries (pp. 9–24). New York: Spon Press.
- Chandio, I. A., Matori, A., WanYusof, K. B., Talpur, H., Balogun, A., & Lawal, D. (2012). GIS- based analytic hierarchy process as a multicriteria decision analysis instrument: A review. Saudi Society for Geosciences. doi:10.1007/s12517-012-0568-8
- Charreire, H., Casey, R., Salze, P., Simon, C., Chaix, B., Banos, A., … Oppert, J. (2010). Measuring the food environment using geographical information systems: A methodological review. Public Health Nutrition, 13(11), 1773–1785. doi:10.1017/S1368980010000753
- Cheng, J. (2003). Modelling spatial & temporal urban growth. Enschede, The Netherlands: the International Institute for Geo Information Science and Earth Observation (ITC).
- Cheng, J., Masser, I., & Ottens, H. (2017). Understanding Urban Growth System: Theories and Methods. Retrieved from https://www.researchgate.net/publication/228588435
- Chong, C. H. (2017). comparison of spatial data types for urban sprawl analysis using Shannon’s entropy (Master of Science, thesis). Faculty of the USC Graduate School. University of Southern California, USA.
- Cobbinah, P. B., & Aboagye, H. N. (2017). A Ghanaian twist to urban sprawl. Land Use Policy, 61, 231–241. [25] Ubink J. M., Land, chiefs doi:10.1016/j.landusepol.2016.10.047.
- Cohen, M. (2017). A systematic review of urban sustainability assessment literature. Sustainability, 9, 2048. doi:10.3390/su9112048
- Coskun, H. G., Alganci, U., & Usta, G. (2008). Analysis of land use change and urbanization in the kucukcekmece water basin (Istanbul, Turkey) with temporal satellite data using remote sensing and GIS. Sensors, 2008, 7213–7223. doi:10.3390/s8117213
- Crush, J., Hovorka, A., & Tevera, D. (2011). Food security in southern African cities: The place of urban agriculture. Progress in Development Studies, 11(4), 285–305. doi:10.1177/146499341001100402
- Darfour, B., & Rosentrater, K. A. (2016). Agriculture and food security in Ghana. Department of Agricultural and Biosystems Engineering Iowa State University. ASABE Meeting Presentation. Paper Number: 162460507. DOI: 10.13031/aim.20162460507
- Deep, S., & Saklani, A. (2014). Urban sprawl modeling using cellular automata. Egyptian Journal of Remote Sensing and Space Sciences, 17(2), 179–187.
- Department for Communities and Local Government. (2009). Multi-criteria analysis: A manual, 2009. London.
- Devereux, S., Baulch, B., Hussein, K., Shoham, J., Sida, H., & Wilcock, D. (2004). Improving the analysis of food insecurity food insecurity measurement, livelihoods approaches and policy: Applications in FIVIMS.
- FAO. (2014). Open data initiative. Africa, Ghana. Retrieved from http://ghana.opendataforafrica.org/FAORSL2014Aug
- FAO, & FAPDA. (2015, March). Country fact sheet on food and agriculture policy trends: Socio-economic context and role of agriculture. Retrieved from www.fao.org/economic/fapda or www.fao.org/economic/fapda/tool
- FFG. (2014). Feed the future Ghana (Country Statistics 2014). Retrieved from http://www.feedthefuture.gov/country/ghana.
- Foody, G. M. (2002). Status of land cover classification accuracy assessment. Remote Sensing of Environment, 80(1), 185–201. doi:10.1016/S0034-4257(01)00295-4
- Frenkel, A., & Ashkenazi, M. (2008). Measuring urban sprawl; how can we deal with it? Haifa, Israel: Faculty of Architecture and Town Planning, and Center for Urban and Regional Studies, Technion-Israel Institute of Technology. doi:10.1068/b32155
- Gad, A. (2007). Preparation of Land Data Base for Agriculture Use, Report no. 3, Project duration 2006–2007.
- Galster, G., Hanson, R., Ratcliffe, M. R., Wolman, H., Coleman, S., & Freihage, J. (2001). Wrestling sprawl to the ground: Defining and measuring an elusive concept. Housing Policy Debate, 12, 681–717. doi:10.1080/10511482.2001.9521426
- Ghana Statistical Service. (2005). 2000 population and housing census: Analysis of district data and implications for planning (Greater Accra Region). Accra: Author.
- Ghana Statistical Service. (2013). 2010 Population and Housing Census: District Analytical Report. Adentan, Accra, Ghana.
- Ghana Statistical Service. (2014a). 2010 population and housing census- urbanization. Acra: Ghana Statistical Services.
- Ghana Statistical Service. (2014b). Ghana Living Standards Survey (GLSS6)
- Goodchild, M. F. (2001). A geographer looks at spatial information theory. In D. R. Montello (Ed.), COSIT 2001, LNCS 2205 (pp. 1−13). Verlag Berlin Heidelberg: Springer.
- Gould, W. T. S. (1998). African mortality and the New ‘Urban Penalty’. Health and Place, 4(2), 171–181. doi:10.1016/S1353-8292(98)00009-4
- Habitat, U. N. (2011). For a better future. In Participatory slum upgrading and prevention millennium city of Accra. Ghana. Accra, Ghana: UN Habitat.
- Hagai, M. (2014). Food security modeling using Geographic Information Systems (GIS) techniques: A strategy towards reliable Food Security Information & Early Warning Systems (FSIEWS) For Tanzania journal of land administration in Eastern Africa Vol 2 Issue 1, Jan 2014, Dar es Salaam. Tanzania Water Management Institute (IWMI).
- Hegazy, I. R., & Kaloop, M. R. (2015). Monitoring urban growth and land use change detection with gis and remote sensing techniques in daqahlia governorate Egypt. International Journal of Sustainable Built Environment, 4, 117–124. doi:10.1016/j.ijsbe.2015.02.005
- Heppenstall, A., Malleson, N., & Crooks, A. (2016). Space, the final frontier”: How good are agent-based models at simulating individuals and space in cities? Systems, 4(9), 9. doi:10.3390/systems4010009
- Ilieva, I. R. T. (2017) Urban Food Systems Strategies: A Promising Tool for Implementing the SDGs in Practice.
- Ingram, G. K. (1998). Patterns of metropolitan development: What have we learned? Urban Studies, 35(7), 1019–1035. doi:10.1080/0042098984466
- I-Shian, S. (1998). Measuring sprawl: A quantitative study of residential development pattern in King County, Washington (Urban sprawl) (PhD Dissertation). University of Washington.
- Jat, M. K., Garg, P. K., & Khare, D. (2008). Monitoring and modelling of urban sprawl using remote sensing and GIS techniques. International Journal of Applied Earth Observation and Geoinformation, 10, 26–43. doi:10.1016/j.jag.2007.04.002
- Jun, M. (1999). An integrated metropolitan model incorporating demographic-economic, land-use and transport models. Urban Studies, 36(8), 1399–1408. Kerridge. doi:10.1080/0042098993051
- Kassanga, R. K., Cochrane, J., King, R., & Roth, M. (1996). Land markets and legal contradictions in the peri-urban area of Accra, Ghana: Informant interviews and secondary data investigations. LTC Research Paper 127, University of Wisconsin-Madison, Madison.
- Kiril, S. (1998). Urban growth, land use change, and metropolitan restructuring: The case of greater Seattle, 1960–1990 (PhD Dissertation). University of Washington, Washington.
- Kleemann, J., Inkoom, J., Thiel, M., Shankar, S., Lautenbache, S., & Fürst, C. (2017). Peri-urban land use pattern and its relation to land use planning in Ghana. West Africa: Landscape Urban Plan. doi:10.1016/j.landurbplan.2017.02.004
- Knaap, G.-J., Song, Y., & Nedovic-Budic, Z. (2005). Measuring patterns of urban development: New intelligence for the war on Sprawl. Lincoln Institute of Land Policy, Working Paper WP05GK1, Cambridge, USA, 29pp.
- Kok, K., & Veldkamp, A. (2001). Evaluating impact of spatial scales on land use pattern analysis in Central America. Agriculture, Ecosystems and Environment, 85, 205–221. doi:10.1016/S0167-8809(01)00185-2
- Kotze, N., Donaldson, R., & Visser, G. (2014). Life in a changing urban landscape proceedings of the IGU urban geography commission. Johannesburg: University of Johannesburg.
- Lambin, E. F., Rounsevell, M. D. A., & Geist, H. J. (2000). Are agricultural land-use models able to predict changes in land-use intensity? Agriculture Ecosystems and Environment, 82(2000), 321–331. doi:10.1016/S0167-8809(00)00235-8
- Larson, J., (2006). Food security in Urban America: A model based on Minneapolis-St. Paul,Minnesota (Geography Honors Projects.Paper 8). Retrieved from http://digitalcommons.macalester.edu/geography_honors/8
- Li, C. (2014, September). Monitoring and analysis of urban growth process using remote sensing, GIS and cellular automata modeling: A case study of Xuzhou city, China. Dortmund, Germany: Faculty of Spatial Planning, TU Dortmund University.
- Lowry, J. H., & Lowry, M. B. (2014). Comparing spatial metrics that quantify urban form. Computers, Environment and Urban Systems, 44, 59–67. doi:10.1016/j.compenvurbsys.2013.11.005
- Mahmoud, M. I., Duker, A., Conrad, C., Thiel, M., & Ahmad, H. S. (2016). Analysis of settlement expansion and urban growth modelling using geoinformation for assessing potential impacts of urbanization on climate in Abuja City, Nigeria. Remote Sensing, 8, 220. doi:10.3390/rs8030220
- Meenar, M. R. (2017). Using participatory and mixed-methods approaches in GIS to develop a place- based food insecurity and vulnerability index. Environment and Planning A, 49(5), 1181–1205. Retrieved from sagepub.co.uk/journals
- Merriam, S. B. (1998). Qualitative research and case study applications in education. San Francisco: Jossey-Bass.
- Mertes, C. M. (2014) Detecting change in urban areas at continental scales with modis data (A thesis submitted in partial fulfillment of the requirements for the degree of Master of Science (Cartography/Geographic Information Systems)). University Of Wisconsin-Madison
- Meyer, W. B., & Turner, B. L. (1996). Land-use/land cover change: Challenges for geographers. GeoJournal, 39(3), 237–240. doi:10.1007/BF00188373
- Mosammam, H. M., Nia, J. T., Khani, H., Teymouri, A. A., & Kazemi, M. (2017). Monitoring land use change and measuring urban sprawl based on its spatial forms The case of Qom city. The Egyptian Journal of Remote Sensing and Space Sciences. 20. (2016), 103–116. Retrieved from www.elsevier.com/locate/ejrs www.sciencedirect.com
- Murcko, J. (2017) Object-based classification for estimation of built-up density within urban environment (Master Thesis). Faculty of Environmental Sciences Institute for Cartography. Technische Universitat Dresden, Germany.
- Neuman, W. L. (2003). Social research methods: Qualitative and quantitative approaches (5th ed.). New York: Pearson Education, Inc.
- Ngie, A. ;., Abutaleb, K., Ahmed, F., & Taiwo, O. (2013). Spatial modelling of urban change using satellite remote sensing. Life in a Changing Urban Landscape, 1(3).
- Oduro, C., Adamtey, R., & Ocloo, K. (2015). Urban growth and livelihood transformations on the fringes of African cities: A case study of changing livelihoods in peri-urban Accra. Environment and Natural Resources Research; Vol. 5, No. 2; 2015 ISSN 1927-0488 E-ISSN 1927-0496, Canadian Center of Science and Education
- Oswalt, P., & Rieniets, T. (2006). Atlas of shrinking cities. Ostfildern: Hatje Cantz.
- Pallagst, K. (2005). The end of the growth machine - New requirements for regional governance in an era of shrinking cities. Paper presented at the Association of Collegiate Schools of Planning’s 46th Annual Conference, Kansas City, USA.
- Parker, D. C., Manson, S. M., Janssen, M. A., Hoffmann, M. J., & Deadman, P. (2003). Multi-agent systems for the simulation of land-use and land-cover change: A review. Annals of the Association of American Geographers, 93(2), 314–337. doi:10.1111/1467-8306.9302004
- Pavan, M., & Todeschini, R. (2009). Multi-criteria Decision-Making Methods, in Comprehensive\ Chemometrics
- Pawar, M. (Ed.). (2004). Data collecting methods and experiences: A guide for social researchers. New Delhi, India: New Dawn Press.
- Pijanowski, B. C., & Robinson, K. D. (2011). Rates and patterns of land use change in the upper great Lakes States, USA: A framework for spatial temporal analysis. Landscape and Urban Planning, 102, 102–116. doi:10.1016/j.landurbplan.2011.03.014
- Potere, D., & Schneider, A. (2007). A critical look at representations of urban areas in global maps. GeoJournal, 69, 55–80. doi:10.1007/s10708-007-9102-z
- Reilly, M. K., O’Mara, M. P., & Seto, K. C. (2009). From bangalore to the bay area: Comparing transportation and activity accessibility as drivers of urban growth. Landscape and Urban Planning, 93(1), 24–33.
- Reis, J. P., Silva, E. A., & Pinho, P. (2014). Measuring Space: A review of spatial metrics for urban growth and shrinkage. In E. A. Silva, P. Healey, N. Harris, & P. van Den Broeck (Eds.), The Routledge handbook of planning research methods (pp. 279–292). New York: Rutledge.
- Rieniets, T. (2009). Shrinking cities: Causes and effects of urban population losses in the twentieth century. Nature + Culture, 4(3), 231–254. doi:10.3167/nc.2009.040302
- Ruhiiga, T. M. (2014, May) Urbanisation in South Africa: A critical review of policy. planning and practice Vol. 28, No. 1: Suppl on Population Issues in South Africa, 2014610
- Satterthwaite, D., McGranahan, G., & Tacoli, C. (2010). (2010) Urbanization and its implications for food and farming. Philosophical Transactions of the Royal Society B, 365, 2809–2820. doi:10.1098/rstb.2010.0136
- Shoko, M., & Smit, J. (2013, February). Use of agent based modelling to investigate the dynamics of slum growth. South African Journal of Geomatics, 2(1), 54–67.
- Simmonds, D., Waddell, P., & Wegener, M. (2011, May 23-24) Equilibrium versus dynamics in urban modelling. Environment and Planning B: Planning and Design, 40(6), 1051–1070.
- Songsore, J. (2009). The urban transition in ghana: Urbanization, national development and poverty reduction. Ghana: Department of Geography and Resource Development University of Ghana Legon-Accra. Retrieved from pubs.iied.org
- Sova, C. (2016). Increasing urbanization threatens food security in Africa. World Food Programme/Rein Skulleru, 30. Retireved from https://www.wfpusa.org
- Statista, (2018). Retrieved from www.statista
- Stein, A., Riley, J., & Halberg, J. (2001). Issues of scale for environmental indicators. Agricultural Ecosystem and Environment, 87, 215–232. doi:10.1016/S0167-8809(01)00280-8
- Takyi, S. A., Amponsah, O., Osei Asibey, M., & Ayambire, A. R. (2019). An overview of Ghana’s educational system and its implication for educational equity.
- Tappan, G. G., Cushing, W. M., Cotillon, S. E., Mathis, M. L., Hutchinson, J. A., & Dalsted, K. J., (2016). West Africa Land Use Land Cover Time Series: U.S. Geological Survey data release. doi:10.5066/F73N21JF
- Tefft, J., Jonasova, M., Adjao, R., & Morgan, A. (2017, November) Food Systems for an Urbanizing World Knowledge, Product
- Tokody, D., & Mezei, I. J. (2017). Creating smart, sustainable and safe cities conference paper. IEEE 15th International Symposium on intelligent Systems and Informatics. Subotica. DOI: 10.1109/SISY.2017.8080541
- Torrens, P. M., & Alberti, M. (2000). Measuring Sprawl, centre for advanced spatial analysis, working paper series, paper 27, London: University College, Presented to the Association of Collegiate Schools of Planning Conference, Atlanta, GA, Retrieved from www.casa.ucl.ac.uk
- Turner, B. L. (2009). Land change science. International Encyclopedia of Human Geography, 2009, 107–111.
- Twum, K. O., & Abubakari, M. (2019). Cities and floods: A pragmatic insight into the determinants of households’ coping strategies to floods in informal Accra, Ghana. Jamba: Journal of Disaster Risk Studies, 11(1), a608. doi:10.4102/jamba.v11i1.608
- UNFPA. (2007). State of world population 2007: Unleashing the potential of urban growth. Retrieved from http://www.unfpa.org/swp/2007/english/chapter_4/print/chapter_4.html
- United Nations’ Department of Economic and Social Affairs, Population Division. (2014). World urbanization prospects: The 2014 revision, CD-ROM edition. Retrieved from http://esa.un.org/unpd/wup/
- Wegener, M., Gnad, F., & Vannahme, M. (1986). The Time Scale of Urban Change. In B. Hutchinson & M. Batty (Eds.), Advances in urban systems modelling (pp. 175–197). Published. Amsterdam, North Holland.
- World Bank. (2013). Urban Agriculture, Findings from Four City Case studies (Urban Development & Resilience Unit World Bank 1818 H Street, NW Washington, DC 20433 USA). Retrieved from www.worldbank.org/urban
- Wray, C., & Cheruiyot, K. (2015, February). Key challenges and potential urban modelling opportunities in South Africa, with specific reference to the Gauteng City-Region. South African Journal of Geomatics, 4(1), 14. doi:10.4314/sajg.v4i1.2
- Wray, C., Musango, J., & Damon, K. (2013). Modelling urban spatial change: A review of international and South African modelling initiatives Gauteng City-Region. Observatory Development Planning and Modelling at Wits August 2013.
- Wu, F., & Yeh, A. G.-O. (1997). Changing spatial distribution and determinants of land development in Chinese cities in the transition from a centrally planned economy to a socialist market economy: A case study of Guangzhou. Urban Studies, 34(11), 1851–1879. doi:10.1080/0042098975286
- Yeboah, F., Awotwi, A., Forkuo, E. K., & Kumi, M. (2017, January). Assessing the land use and land cover changes due to urban growth in Accra, Ghana Article. Journal of Basic And Applied Research International, 22.
- Youssef, A. M., Pourghasemi, H. R., Pourtaghi, Z. S., & Al-Katheeri, M. M. (2016). Landslide susceptibility mapping using random forest, boosted regression tree, classification and regression tree, and general linear models and comparison of their performance at Wadi Tayyah Basin, Asir Region, Saudi Arabia. Landslides, 13, 839–856. doi:10.1007/s10346-015-0614-1
- Zhang, S. (2016). Evaluating urban expansion using integrated remote sensing and gis technique: A case study in greater Chengdu, China (Graduate Master Thesis). Department of Geography and Planning, University of Saskatchewan. Canada doi:10.2116/analsci.32.1267