
 ?Mathematical formulae have been encoded as MathML and are displayed in this HTML version using MathJax in order to improve their display. Uncheck the box to turn MathJax off. This feature requires Javascript. Click on a formula to zoom.
Abstract
The study looks at the determinants of household energy consumption and how that relates to general poverty and energy poverty. It extends the Multidimensional Energy Poverty Index (MEPI) by estimating the rural-urban differentials in MEPI. The study employed multinomial logistic regression on household adoption of energy for cooking and lighting. The Ghana Demographic and Health Survey—GDHS 2014 data were used for the regression and three waves (2003, 2008 and 2014) of the data were used to estimate the MEPI as well as the rural-urban contributions to the MEPI over time. The paper provides empirical insights that household energy consumption is affected by socioeconomic variables and rural households are more deprived than urban households in terms of access to and use of modern energy. The most popular energy for cooking is wood and main electricity is the most popular energy for lighting. The wealth status of household, nature of residence (rural or urban) and the size of the household are key socioeconomic variables that affect energy consumption. An estimation of the MEPI showed that it has been declining from a severely deprived energy poverty rate in 2003 to a moderately deprived energy poverty rate in 2014. Also, rural homes (57%) are more energy poor than urban (43%) households. The study includes implications for the provision of clean and better energy sources for household consumption policies. This study fulfills an identified need to look at general poverty in relation to energy poverty and to look at the rural-urban differentials in energy consumption.
PUBLIC INTEREST STATEMENT
Poverty reduction over decades has concentrated on the monetary aspect, by empowering the poor in terms of income generation. Lately, scholars advocate for looking at non-monetary aspect of poverty (termed as deprivations in life-sustaining materials including energy). Energy forms part of the basic needs of individuals and households as they use it to cook, provide warm, and lighting. Little is known about the energy deprivation of Ghanaian households and how that affects general poverty. The paper looks at the determinants of household fuel consumption and the degree of energy poverty (Multidimensional Energy Poverty Index) in Ghana using a household survey data. Using multinomial logistic regression, it’s ascertained that socio-economic variables determine energy use by households. The study showed that generally energy deprivation and energy poverty are a matter of residence nature as rural households are more deprived than urban and energy poverty has been on decline over the period.
1. Introduction
Many households or individuals have limited access to (are deprived of) modern energy sources such as electricity, Liquefied Petroleum Gas (LPG), etc. for household needs (especially in Africa). Energy is important for the whole economy as it is for household needs. It forms part of the basic needs of individuals, as it helps to provide warmth and lighting, is also used for cooking of food. A household which uses traditional forms of energy, notably charcoal and firewood for cooking, lighting and any other needs may be prone to hazardous health implications (Legros, Havet, Bruce, & Sophie, Citation2009). Without modern energy services, the poor will continue to be poor as they will acquire and use fuels that are injurious to their health. Many spend hours a day walking long distances to collect firewood because their cooking stoves are the traditional one (usually three-stone open) (Bartels, Citation2007). Without sufficient clean fuels for cooking, women mostly in Africa will continue to be exposed more than anyone to indoor air pollution and its health effects.
Households that are deprived of their basic life-sustaining needs including energy could be considered to be poor. If one household has better access to healthcare, educational services and other public services than another household at the same level of income, then the two cannot be said to be equally deprived. In the energy-poverty literature, when an individual or household is deprived of modern energy sources (e.g., electricity, LPG) or is using the traditional biomass for its energy needs, such an individual or household is considered to be “energy poor”. The literature on poverty across the world shows that, indeed, income deprivation should not be considered as the only dimension of poverty as deprivation in other dimensions of human life-sustaining activities such as education, life expectancy, access to modern energy sources and room availability in the house are significant both in rural and urban areas in determining poverty, and not necessarily related to deprivation in income (Alkire & Santos, Citation2010; Atkinson, Citation2003; Kakwani & Silber, Citation2008).
Non-modern energy sources comprise wood, charcoal, grass/animal dung and any other solid fuels. Demand for fuel wood is a major driver of forest degradation and subsequently the release of Green House Gas (GHG) emissions in Ghana (United Nations Environmental Program [UNEP]–Risoe Center, Citation2013). About 80% of households in Ghana depend directly on wood fuels (firewood, charcoal, and other biomass) for cooking. Wood fuels are sources of indoor pollution with its negative health implications. Respiratory infections, cardiovascular diseases, lung cancer, reduced lung function, carbon monoxide poisoning and immune system impairment are among the diseases caused by indoor air pollution. What is germane is that there is the need for policy to change the pattern of usage of cooking fuels in Ghana, particularly for rural areas. The Ministry of Energy in 2010 estimated that about 66% of the Ghanaian population has access to electricity. In the same year, the International Energy Agency (IEA) ranked Ghana 50th out of 80 countries in its Energy Development Index (EDI) which used indicators such as household access to clean cooking fuels (all fuels except solid fuels) and electricity access indicator (IEA, Citation2010; Ministry of Energy—Ghana, Citation2010).
The International Energy Agency (IEA) noted that unlike other regions and developing countries where traditional biomass energy use is expected to stagnate or decline, Africa’s traditional biomass use is likely to increase sharply by 2030 unless there is a significant increase in access to cleaner and affordable energy carriers for cooking (IEA, Citation2006). In another vain, it was asserted that the number of people without access to electricity (560 million people) and modern fuels (625 million people) is similar in SSA (Legros et al., Citation2009). Household energy demand and supply pattern in Ghana does not match. More households adopt non-modern energy (wood, charcoal, grass, animal dung, etc.) than modern fuels for cooking as 57% of all charcoal consumed in the country are from Accra and Kumasi, which are the most populated urban centers in Ghana (Government of Ghana—GoG, Citation2015).
Most studies on household access to energy and energy poverty tend to concentrate on the degree and intensity of such energy poverty, especially in Ghana (Awan, Abbas, & Sher, Citation2014; Faisal, Brew-Hammond, & Osei, Citation2013; Karakara, Citation2018; Kwakwa & Wiafe, Citation2013). This study, therefore, seeks to unravel the major determinants of household energy consumption and the degree of energy poverty in Ghana (the number of households that are energy deprived and the intensity of such deprivation). The study looks at household energy consumption for cooking, on the one hand, and for lighting on the other hand. The paper also aims to contribute to policy formulation to tackle energy poverty and poverty, in general. It is considered that poverty is, largely, a function of how policies are designed and implemented, and that poverty is not an act of nature (Fahmy, Gordon, & Patsios, Citation2011).
The paper seeks to test the hypothesis that socio-economic variables are not determinants of households’ energy consumption for cooking and lighting purposes in Ghana and to estimate the Multidimensional Energy Poverty Index (MEPI)–as proposed by Nussbaumer, Bazilian, and Modi (Citation2012) for Ghana over a period of 12 years (2003 to 2014)—using three waves of cross-sectional data. As a contribution to literature, the study will build on studies which advocate non-monetary ways to measure and understand poverty in general and energy poverty, in particular. The major contribution of this paper is the spatial estimation of MEPI, where the paper looks at the different rates of the rural/urban contribution to multidimensional energy poverty index (MEPI) and how the MEPI changes overtime. The rest of the paper is structured as follows: Section Two highlights the literature review while Section Three gives the data and methodology; Section Four presents the results and discussion and the last section presents the conclusion and policy implications of the study.
2. Insight from theoretical and empirical literature
2.1. Theoretical literature
There are theoretical and quite a number of empirical studies on household energy consumption. Some theoretical analyses of household energy consumption are explained within the purview of the so-called “energy ladder hypothesis”. This hypothesis identifies and uses income as a measure or determinant of household fuel consumption, choice and switching behavior (Heltberg, Citation2003). The theory espouses that there is a transition in energy consumption for household needs from traditional biomass (i.e., grass, animal dung, firewood, charcoal, etc.) to modern sources (i.e., LPG, kerosene, electricity), as there are increases in the incomes of households or improvement in welfare of households (Rajmohan & Weerahewa, Citation2009). The energy ladder hypothesis posits that households demand energy in three progressive levels. The beginning or stage 1 is where households depend largely on traditional biomass. Such households are, mostly, the poor or extremely poor, that can barely afford modern energy. Stage 2 is when households transit from such biomass to fuels such as kerosene, coal and charcoal, as their incomes increase and as urbanization and development take place. The third and final stage is when households begin to use clean modern energy such as LPG and electricity for cooking and lighting (Heltberg, Citation2003). However, critics had it that lower levels of fuels are kept and used simultaneously or as supplements—as income increases, mainly because of availability and they are used for certain types of cooking needs (energy for a specific task). Kohler, Rhodes, and Vermaak (Citation2009) explain that unreliable supplies require households to rely on different sources of energy and that different sources of energy are more cost-effective in some uses than in others. This is the fuel stacking aspect of the energy ladder hypothesis.
2.2. An overview of the energy situation in Ghana
Ghana’s energy situation in terms of history can be regarded as spawning into three periods. These are “Before Akosombo” years, the “Hydro-years” and the “Thermal complementation” periods. The before Akosombo years were the colonel days, when electricity was from isolated diesel generators with low rates, which were owned by industries (such as mines, factories and government institutions—hospitals, schools, colleges, etc.). The Public Works Department was created by the government, and it operated public electricity supply first in Accra in 1922. Electricity was extended to Koforidua in 1926 and other towns like Kumasi and Winneba got it in 1927. Also, towns like Swedru, Tamale, and Cape Coast got electricity between 1929/30 and Bolgatanga, Dunkwa and Oda in 1948 (Institute of Statistic Social and Economic Research [ISSER], Citation2005). The hydro-years started when the Akosombo Dam construction began in 1962, with the first phase completed in 1965 to generate electricity for the country. In subsequent years, the Kpone hydroelectric project was initiated and built. The thermal complementation period was when the Takoradi thermal plant was built to complement the power situation in the country (GoG, Citation2015; ISSER, 2005).
Successive governments in Ghana have tried to make electricity accessible to all Ghanaians. The national electrification concern started in 1985 when the Volta River Authority (VRA) extended electricity northward to reach all the administrative regions of Ghana under a project called the Northern Electrification and System Reinforcement Project (NESRP). Under this, almost all regional capitals, except the Upper West regional capital were hugged on to the national grid (ISSER, 2005). The achievement of the NESRP led to the implementation of the National Electrification Scheme (NES) in 1990. The goal of the NES was to provide, within a 30-year timeframe, electricity access to about 4,200 settlements with populations of 500 or more. The NES was tied to projects like the Self-Help Electrification Project (SHEP). The SHEP was a nationwide scheme that was introduced as a policy framework under which communities could advance their electrification projects ahead of the dates indicated in the NES by meeting agreed criteria for community contributions to the project implementation (Government of Ghana, Citation2015; ISSER, 2005).
2.2.1. Energy access for cooking
Ghana is, mostly, a wood fuel economy. Approximately 69% of all urban households in Ghana use charcoal for cooking purposes. Accra and Kumasi, which are the most populated urban centers in Ghana, account for 57% of all charcoal consumed in the country (Government of Ghana, Citation2015). Firewood consumption is estimated to have increased by 58% between 2004 and 2008 while charcoal consumption increased by 50% over the same period (Ministry of Energy—Ghana, Citation2010). Table shows that less than 1% of the total households use electricity for cooking and less than 20% use LPG/natural gas for cooking. In total, the proportion of households who use modern fuels for cooking is about 20% while biomass (non-modern fuels) consuming households constitute about 76%, indicating that Ghana is still a solid fuel-based economy.
Table 1. Households access to fuel for cooking in Ghana
2.2.2. Energy access for lighting
There are many forms of energy for lighting in Ghana, ranging from wood through candles and flashlight to electricity. However, electricity and kerosene are the major sources of energy for lighting in most Ghanaian homes. Sixty-six percent of Ghana’s population has access to electrification (Ministry of Energy—Ghana, Citation2010). Access to electricity for lighting shows an urban-dominated trend and households with high income are those who use electricity as the main source of lighting.
Both kerosene and electricity provide an equal share of 49% of lighting to Ghanaian households (see Table ). Of these, only 26.9% of households in rural Ghana use electricity for lighting, compared to 78.5% of urban households. Thus, more than two-thirds of rural households rely mostly on kerosene for their lighting needs, relative to only about one-fifth of urban households. But other sources such as the lamps, flash light and candles are kept for use in times of power outages.
Table 2. Access to lighting in Ghana
2.3. Strategies for improving energy access in Ghana
2.3.1. Electrification scheme
Most previous governments in Ghana have made efforts to make electricity available to many households. The National Electrification Project (NEP), starting in 1990, was in three phases, with two phases executed under NEP itself, and the third phase was under SHEP. The first phase was the electrification of district capitals and towns/villages around those district capitals. The NEP was the earliest massive electrification project in Ghana. The project resulted in electrification of many district capitals and towns/villages on-route to the district capitals (26 district capitals and 449 towns/villages on-route to those district capitals were hocked on to the national grid between 1990 to 2003) (Ministry of Energy—Ghana, Citation2010). The SHEP execution was assistance to communities that were within a distance of 20 km from an existing medium voltage (MV) and which have taken initiative to provide low voltage. Communities were connected ahead of their respective scheduled dates when: they are within 20 km to an existing 33 kV or 11 kV network; had procured low-voltage poles for the network within the community; and had a certain minimum number of premises (houses) wired and ready to receive electricity. The government’s obligation was to provide the conductors, transformers, pole-top, and other materials and assume responsibility for the construction work required to make the connection (Government of Ghana, Citation2015).
2.3.2. LPG promotion
The LPG promotion started in 1990 with the long-term goal of ensuring households in Ghana that use charcoal and firewood for cooking adopt the use of LPG. This was to gradually face out biomass consumption by households to help achieve health and environmental benefits. Under the program the Tema Oil Refinary was to be modernized, to help produce more LPG for domestic consumption. Some of the major features of the LPG promotion were: Free distribution of 14.5 kg and 5 kg LPG cylinders to the public; LPG delivery service to registered private individuals for LPG retailing; LPG subsidy and other fiscal incentives; free plant and equipment installations for educational institutions, hospitals, and prisons; establishment of the LPG fund to support the purchase and maintenance of LPG cylinders and kitchen equipment for institutions; and construction of the Ghana Cylinder Manufacturing Company (GCMC) in Accra (Ministry of Energy—Ghana, Citation2010).
Under this programme, the Unified Petroleum Price Fund (UPPF) was initiated to provide incentives to oil marketing companies (OMCs) that transport LPG to rural and distant locations outside a radius of 200 km from TOR. Also, the National Energy Policy 2010 was initiated to help increase, by 50%, household access to LPG as the main cooking fuel by 2015. The government launched program in 2014 to distribute 350,000 LPG cylinders and stoves free of charge in rural areas. As of 2013, LPG consumption was recorded at 251,800 tones (Government of Ghana, Citation2015).
2.3.3. Kerosene promotion programme
The government of Ghana, in 1999, established the Kerosene Promotion Fund (KPF) to ensure that kerosene is made available at all times to the people of Ghana, most especially, rural households at affordable prices. The KPF was used to fund the Rural Kerosene Distribution Programme (RKDP) which was in phases. Phase I saw the fabrication of 700 surface tanks by 2002. Phase II had 1,500 tanks in 2004 and 800 tanks by the end of 2005. These were distributed to districts. By the end of the program, a total of 2,200 kerosene reseller outlets in rural areas were in the program. On average, about 20 outlets per district were to be established by the end of the program (Government of Ghana, Citation2015).
2.3.4. Improved cooking stoves
Improved cook stoves are those which use traditional biomass but with efficiency levels higher than the ordinary cook stoves. These improved cook stoves use less firewood or charcoal and have reduced indoor air pollution. The Institute of Industrial Research of Council for Scientific and Industrial Research (CSIR) has developed and promoted improved cook stoves in Ghana. These improved cook stoves have been adopted by some households. Enterprise Works (which is an NGO) and Toyola, a private firm that was into manufacturing and wholesale supplier of stoves, have engaged in developing different designs of firewood stoves (Government of Ghana, Citation2015). Enterprise Works Ghana commenced development and sale of improved cook stove, known as “Gyapa” in 2002 and over 480,000 stoves were distributed. This stove has energy efficiency levels to up to 40% and has helped to reduce fuel consumption as over 110,000 stoves were distributed as of 2009 (Ministry of Energy—Ghana, Citation2010).
Toyola Energy Limited also has improved charcoal stove under the same name “Gyapa”, designed with ceramic liner. In 2008, about 30,000 stoves were manufactured and sold, and sales were expected to increase to 50,000 in 2011. Household energy project was implemented by Ministry of Energy, with assistance from the United Nation Development Programme (UNDP). It was to encourage the use of efficient charcoal and firewood stoves. Later, the stoves were abandoned because they were not suitable for the preparation of most traditional staple foods in Ghana (Government of Ghana, Citation2015).
2.4. Empirical literature review on the determinants of household energy consumption
Some scholars regard socioeconomic variables (income, education, household size, gender, rural/urban differentials, age of individual and marital status) to be determinants of household energy consumption. Income is presumed as the major determinant of household energy adoption and switching behavior. Some studies (Faisal et al., Citation2013; Tchereni, Citation2013) consider the income level of a household as a better starting point to indicate which energy can be adopted. Faisal et al. (Citation2013) investigated the relationships between energy use and income levels for households in Ghana and indicated that there is a positive relationship between charcoal or LPG and income levels, but wood is found to be negative at all income levels. Also, Tchereni (Citation2013) found a negative relationship between income and energy budget share of fuel wood. Demurger and Fournier (Citation2007) noted that as households’ incomes go high, they move from fuel wood consumption to coal and when prices of firewood increase, they consume coal as a substitute.
The size of household members is deemed to have an effect on the type of fuel a household adopts for domestic use. Abebaw (Citation2007) examined household determinants of fuel wood choice in urban Ethiopia, using Jimma Town as a case study, and indicated that while household size has a positive relationship with firewood consumption; it has a negative relationship with charcoal consumption. Similarly, Mensah and Adu (Citation2013) analyzed household energy choices in Ghana by employing an ordered probitFootnote1 model with socio-economic variables and concluded that household size has a negative effect on the probability of using clean fuels (electricity, LPG, kerosene) over non-modern fuels (wood, charcoal, grass, animal dung). On the contrary, other studies (Tchereni, Citation2013; Demurger and Fournier, Citation2007) have concluded that household size has a negative association with fuel wood expenditure. Thus, the effect of household size on fuel adoption, generally, connotes that larger households are more likely to adopt biomass fuels than smaller households.
Education of the individual (particularly the household head) is deemed to have an influence on the type of fuel a household consumes. An educated person could be better employed and earn some appreciable level of income than an uneducated counterpart. Again, an educated person may be aware of the health dangers of using fuels like biomass and, thus, will try to avoid their usage. Some studies have established that education of individuals (especially household heads) is negatively associated with fire wood usage (Abebaw, Citation2007). Also, Mensah and Adu (2014) acknowledged that education is positive to fuel usage and, hence, access to education increases the probability of using clean fuels (namely electricity, LPG, kerosene). This is similar to what Ogwumike, Ozughalu, and Abiona (Citation2014) noted, that father’s education is inversely related to firewood usage (unclean fuels). Other studies (Demurga and Fournier, 2007; Karakara, Citation2018; Nlom and Karimov, Citation2014; Mekonnen and Kohlin Citation2008) all have greatly asserted that education has a positive relation with the adoption of clean fuels (notably electricity, LPG, kerosene).
The age of the individual is seen to have some influence on the type of energy consumed for domestic use. Some studies have concluded that the age of household heads determines the fuel adoption of households. Employing a Tobit modelFootnote2 and focusing on household fuel wood consumption, Abebaw (Citation2007) indicated that, as the head of household ages, the probability of adopting firewood increases but reduces for the adoption of charcoal. Tchereni (Citation2013) had similar conclusions that, as household head ages, demand on fuel wood increases. Also, Kwakwa and Wiafe (Citation2013) assessed fuel usage among rural households in Ghana and indicated that the probability of using firewood has a negative relationship with the variables age and age-square. Again, Edwards and Langpap (Citation2008) examined LPG stove adoption, firewood consumption and health of children in Guatemala, emphasizing the role of cooking choice and concluded that older households are more likely to use wood than new ones and larger households use wood more than smaller ones. Similarly, Nlom and Karimov (Citation2014) modelled fuel choice (electricity, kerosene, LPG and firewood) among households in northern Cameroon and concluded that the age of household head has a negative relationship with the use of clean fuel (electricity, LPG and kerosene). Thus, household heads that are older are less likely to adopt clean fuels.
The rural-urban divide is perceived to have an influence on the kind of energy that household consumes. Rural areas are most often not having access to clean fuels (i.e., electricity, LPG, kerosene). Ogwumike et al. (Citation2014) examined energy use and the energy ladder hypothesis and how socio-economic variables affect household energy use in Nigeria. By doing a multinomial logistic analysis, the authors indicated that while urban sector (where household stays) is inversely related to firewood use it is positively related to kerosene, LPG and electricity usage for cooking. Aitken (Citation2007) studied household energy uses by comparing household energy consumption and expenditure across three provinces (Eastern Cape, West Province and KwaZulu Natal) in South Africa. Aitken found that between 77% and 98% of households in each of the provinces use wood as their main source of energy. Kerosene as a more modern and cleaner energy source is mostly used in Eastern Cape and North West, while LPG is mostly used in KwaZulu Natal. Candles were used for lighting in all provinces. Edoumiekumo, Tombofa, and Karimo (Citation2013) concluded that rural dwellers are more likely to be moderately energy poor, relative to being non-poor, compared to their urban counterparts. Similarly, Awan et al. (Citation2014) indicated that, in the urban areas, 29% of the urban households are energy poor while in rural areas, 71% of them are energy poor. Pachauri, Ekholm, Krey, and Riahi (Citation2010) also noted that the rural population relies heavily on biomass as fuel for cooking whereas the urban population switches from traditional biomass to modern fuels, specifically wood and charcoal to electricity and LPG.
The gender of household heads is perceived to have an influence on the fuel choice and usage by households. Kwakwa and Wiafe (Citation2013) asserted that a male-headed household has a negative probability of using firewood in Ghana. Similarly, in examining energy use, the energy ladder hypothesis and how socio-economic variables affect household energy use in Nigeria, Ogwumike et al. (Citation2014) concluded that male-headed households are more likely to use LPG and kerosene for cooking instead of firewood than female-headed households. Mekonnen and Kohlin (Citation2008) also asserted that a female-headed household is likely to use non-modern fuels or a mixture of modern and non-modern fuels than male-headed households. Similarly, Edoumiekumo et al. (Citation2013) concluded that female-headed households are also more likely to be moderately energy poor than being non-poor, compared to male-headed households.
From the literature reviewed above, it could be observed that there are many factors that are argued to affect the household decision for the choice and use of a particular energy for domestic purposes. The choice, however, of which variables to be used in the present study was dependent not only on the literature review but also on the data available. Most of the important socioeconomic variables perceived as determinants of household fuel consumption like, age of household head, size of household members, educational level of household head, marital status of household head, place of residence (rural or urban), gender of household head, and wealth status of the household were maintained in the empirical analysis below.
3. Methodology
3.1. Sources of data
The study used the Ghana Demographic and Health Survey data (GDHS VI) for 2014. The data were collected by the Ghana Statistical Service in collaboration with the United States Agency for International Development (USAID). It is a public data and available on the internet at www.DHSprogram.com with identification number GH_2014_DHS_09012016_734_98554. The GDHS used a two-stage sample design. The first stage involved selecting sample points (clusters) consisting of enumeration areas (EAs). A total of 427 clusters were selected, 216 in urban areas and 211 in rural areas. The second stage involved systematic sampling of households. A household listing operation was undertaken in all of the selected EAs from January to March 2014, and households to be included in the survey were randomly selected from these lists.
About 30 households were selected from each sample point, resulting in a total sample size of 12,831 households. Because of the approximately equal sample sizes in each region, the sample is not self-weighting at the national level, and weighting factors have been added to the data file so that the results will be proportional at the national level. Based on the weights, the sampled households were adjusted to 12,010 and 11,835 households were successfully interviewed, yielding a response rate of 99% Three questionnaires were used for the 2014 GDHS: The household questionnaire, the woman’s questionnaire, and the man’s questionnaire.
Out of the surveyed 11,835 households, there were 466 households who responded that they do not cook in the house and, for that matter; no cooking fuel was being used. The paper run a regression including these 466 households and another regression without these 466 households and found no significant changes in the variables estimated, so the 466 households were excluded. Also, there were missing observations for certain variables so we adjusted our sample to 11,362 households, which captures full observations for all our variables of interest.
3.2. Data analysis procedure
In this study, a multinomial logistic model was used. This model differs according to whether or not regressors vary across alternatives. Multinomial models are, usually, estimated by maximum likelihood. Thus, to the extent that models are nested, one can use standard likelihood ratio tests. When models are non-nested, one can use variant Akaike information criteria based on the fitted log-likelihood, with degrees of freedom adjustable for the number of parameters (Cameron & Trivedi, Citation2005). The estimation of the multinomial logit model is best carried out by utilizing the maximum likelihood estimation technique (Greene, Citation2003). Maximum likelihood estimation technique gives parameter estimates that are asymptotically efficient, consistent and normal and the analogue of the regression t-test can be applied.
Let Pr represent the probability of a household using a particular fuel alternative, say wood, such that the probability of not using wood is given as 1-Pr. Cognizant of the fact that we do not actually observe Pr, as Y is a latent variable, but instead, we observe the outcome Y = 1 if the household chooses alternative j, say wood, and Y = 0 if it does not, then we have the following model specification:
Model one (Equationequation 1(1)
(1) ) depicts household energy consumption for cooking purposes while model two (Equationequation 2
(2)
(2) ) looks at household energy consumption for lighting purposes. These differences are well explained in the empirical models (Equationequations 4
(4)
(4) and Equation5
(5)
(5) ). A positive
coefficient implies that households attach positive utility to the corresponding characteristic. The probability of not choosing wood as energy among the other alternatives is given in Equationequation 3
(3)
(3) .
Here, X is a vector of independent variables and β is a vector of their respective coefficients. As can be noted from Equationequations 2(2)
(2) and Equation3
(3)
(3) , Pr ranges from 0 to 1 and is non-linearly related not only to the regressors but also to the parameters, thereby causing some estimation problems if ordinary least squares (OLS) estimation technique is to be applied.
3.2.1. Empirical model specification
Spawning from the literature review, the following socio-economic variables were used: household size, gender of household head, age of household head, wealth status of household, marital status of household head, educational status of household head, residence nature (rural/urban) and region of residence. The multinomial logit models are used here to estimate household demand for certain types of energy for two essential household services, namely for cooking and for lighting. Household demand for energy for cooking and lighting is considered, basically, due to the data availability for this study. From Greene (Citation2003), the following multinomial logit functions were estimated to evaluate the factors that influence household’s choice of six particular energy sources for cooking and three particular energy sources for lighting purposes.
For purposes of cooking, j = 1–6 represents the types of energy used: 1 = electricity, 2 = LPG, 3 = charcoal, 4 = wood, 5 = kerosene or 6 = others, with kerosene as the reference choice. For the purposes of lighting, k = 1, 2, 3 and represents access to 1 = main electricity, 2 = having generator or 3 = others (candles, flashlight, lamps, etc.), with generator as reference choice. These energy types are the main sources households use for cooking and lighting, as households were asked to mention the main energy they use in cooking as well as lighting.
The model specified follows the assumption that the random disturbance terms are independently and identically distributed (McFadden, Citation1974). In such multinomial models, Judge, Hill, Griffiths, Lǘtkepohl, and Lee (Citation1985) showed that, even if the number of alternatives is increased (from 2 to 3 to 4, etc.), the odds of choosing an alternative, say wood, remains unchanged. Changing the assumptions about the error term changes the values of the coefficients uniformly but it does not affect the probability of an event occurring. It affects the spread of the distribution but not the proportion of the distribution above or below the threshold (Long and Freese, Citation2001). Estimated coefficients from the model measure the estimated change in the logit for a one-unit change in the predictor variable while the other predictor variables are held constant. A positive estimated coefficient implies an increase in the likelihood that a household will choose the alternative fuel. A negative estimated coefficient indicates that there is less likelihood that a household will change to an alternative fuel.
3.2.2. Energy poverty estimation
According to Nussbaumer et al. (Citation2012), MEPI is an index of acute multidimensional poverty and reflects deprivation in very rudimentary services and core human functions. They add that the MPI reveals the combination of deprivations that better a household at the same time. A household is identified as multi-dimensionally poor if, and only if, it is deprived in some combination of indicators whose weighted sum exceeds 30% of deprivations (Alkire & Santos, Citation2010).
Based on Nussbaumer et al. (Citation2012) and Alkire and Santos (Citation2010), this paper’s contribution is based on calculating a Multidimensional Energy Poverty Index (MEPI) for Ghana, using six major indicators of energy deprivation. These indicators are access to modern cooking fuel, indoor air pollution, access to lighting, services provided by means of household appliances, entertainment/education, and communication dimension. The six indicators of energy deprivation are given weights arbitrarily. However, more weights are given to cooking and lighting dimensions because these are mostly the basic services provided by energy for household needs. Also, the kind of energy used (modern or non-modern) determines the indoor air pollution that the household may face, hence indoor air pollution is also weighted more than other indicators like entertainment/education, communication and services of household appliances dimensions. In measuring deprivation for lighting, it is considered that a household is deprived of light if its source of light is not given by electricity or generator set and it is assigned 1 and 0 if otherwise. A deprivation index for lighting is, then, weighted by 0.2. With regard to cooking, a household is deprived of modern cooking fuel if its main cooking fuel is not electricity, cooking gas/oil or kerosene and it is assigned the value of 1 and 0 if otherwise. The deprivation index is, then, weighted by 0.2.
Indoor air pollution: a household is deprived if it cooks on a stove or open fire (no hood/chimney) or is using any fuel besides electricity and/or gas and the household is assigned the value 1 and 0 if otherwise. The deprivation index is, then, weighted by 0.2. With regard to services provided by means of household appliances, a household is considered energy poor if it does not have any household appliance. The deprivation index is, then, weighted by 0.13. For entertainment/education, a household is energy poor if it does not have radio or television. The deprivation index is, then, weighted by 0.13. Lastly, in the communication dimension, a household is poor if it does not have a telephone (land line) or mobile phone. The deprivation index is, then, weighted by 0.13. After computing the deprivation indexes for all households, the energy poverty score for each household, ci is, then, computed as the sum of household weighted deprivation. The Multidimensional Energy Poverty Line, z of ½ (= 0.5), is adopted. A household is energy poor if it is deprived of more than 50% of the indicators. Therefore, a household whose sum of weighted deprivation is greater than or equal to 0.5 is classified as energy poor and households whose sum of weighted deprivation is less than 0.50 is energy non-poor. The weights are arbitrarily assigned, with the intuition from literature.
A head count ratio (H), which is the proportion of the households considered to be energy poor, is computed. The head count ratio is the total number of households considered deprived over total households. The intensity of multidimensional energy poverty “A” (0—not intense, meaning access to basic energy services, 1—intense, no access to basic energy services) is computed. It is the average number of deprivations. Then, a multidimensional poverty index (MEPI) is determined, which is the product of “H” and “A”: MEPI = H х A. The estimation also looked at decomposability of energy poverty in terms of the residence nature of households (Alkire & Foster, Citation2011). The paper estimated the contribution of those households who are rural dwellers to the overall energy poverty estimate and the contribution of urban households to the overall energy poverty index. By this, the study established the differences in rural and urban settings when it comes to access to energy services for household use.
4. Results and discussions
4.1. Descriptive statistics
Table shows, the mean values of continuous variables while for dummy variables it shows percentages. The majority (46.56%) of the households still adopts wood as their main energy for cooking. Also, on fuel for lighting, electricity is the main source for (68.61%) households. This means that, when it comes to cooking purposes, non-modern fuel (wood) is the popular among the households and for lighting purposes, electricity is the major source. This was observed earlier by Kwakwa and Wiafe (Citation2013) and Mensah and Adu (Citation2013). Again, the majority of households are within the poor wealthFootnote3 category. Based on the wealth index, which goes from poorest, poorer, middle, rich, to the richest, the share of the poorest and poorer households is 42.49%. The distribution of households in terms of residence is almost the same, 50/50 in rural/urban. The mean of household size is about 4 members, while the minimum household size is 1 and the maximum is 25. The mean age of household head is 45 years, with a minimum age of 25 years and a maximum age of 95 years. Male-headed households constitute almost 67% of all household heads. The majority of the household heads (64.69%) are married and 46.77% of them (household heads) are secondary school-leavers. The implication is that most household heads are educated and may know the effects of using non-modern energy (wood, charcoal, grass, animal dung).
Table 3. Descriptive statistics of socio-economic variables
4.2. Energy access for cooking and lighting
The trend in the type of cooking fuel revealed that about 47% of the households use wood for cooking. This percentage of households using firewood for cooking, even though it has been reducing, is still high, as the figure stood at 63% in the 2003 data (shown in Table ), compared to 47% in 2014 data. Overall, 79% of the households use non-modern forms of energy for cooking purpose. These include, apart from firewood, charcoal, grass, and animal dung. Electricity is used as a source of cooking fuel by less than 1% of households. This may be attributed to the anecdotal evidence that, it costs more to use electricity than wood to cook for a larger family, unreliability of electricity at times, and the type of fuel traditionally used to cook certain stable foods (like Banku, Tuo-Zaafi and Akple) in Ghana.
On the types of fuel used by households for lighting, we realized that they were not captured in the original data. But the data did capture whether the household has access to main electricity (that is, whether the household is connected to the national grid), or whether the household has a generator for use as a source of its power. As a proxy, the study created the lighting dimension by assuming that if a household has access to main electricity, then it uses it as its source of lighting, and if it has a generator, it uses it as its source of lighting. Households that neither have access to main electricity nor generator where deemed to have been using other forms of fuels such as candles, lanterns, flashlight, solar, etc. for lighting.
Figure : Energy sources for cooking Figure : Energy sources for lighting
Figure 1. Energy access for cooking and lighting in Ghana.
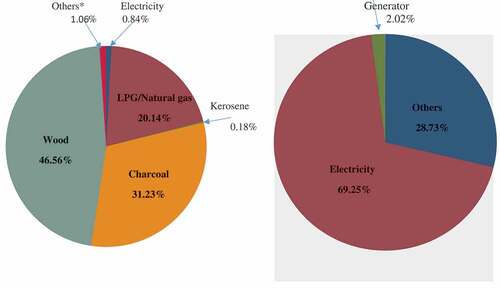
Figure ) shows access to lighting by households, with 69% (8,025 households) of the sampled households using main electricity for lighting, while 29% use other forms of fuels for lighting and 2% use generator as their source of energy for lighting. The majority of the households use electricity for lighting partly because most homes have access to electricity from the national grid. With the rural electrification projects, Self Help Electrification Programmes (SHEP)Footnote4 I and II (Ministry of Energy—Ghana, Citation2010), all led to place Ghana 3rd after Mauritius and South Africa, as countries in the Sub-Saharan Africa with the highest number of population having access to electricity (Kemausuor, Obeng, Brew-Hammond, & Duker, Citation2011). Nevertheless, only 37.6% of the rural households have access to electricity, the remainder being urban households.
Another reason why most households’ use electricity for lighting is that it is deemed cheaper for large households or even smaller ones to use electricity for lighting than to use a generator or other forms of fuels for lighting. It is important to note that, when it comes to cooking purposes, using electricity could be more costly than other energy sources. Apart from main electricity and electricity from generator, the other forms of energy are not able to help provide services like refrigeration and entertainment (television, radio) for households. These are some of the reasons we attribute to the high number of households using electricity as their source for lighting.
4.3. Logistic regression
4.3.1. Multinomial logit results for energy for cooking
The paper presents the results of the marginal effects at representative values for the multinomial logit regression of fuel for cooking and lighting. The marginal effect at representative points takes into account the odds ratio and the coefficients are shown as marginal changes in the probability of using the various fuels for continuous variables and the discrete change in the probability for dummy variables. The marginal effects are run by setting dummy variables into one of the categories. Thus, in this paper, sex of household head is set to female; residence of household is set to urban; education of household head is set to primary and wealth status is set to richer. Table shows estimates of the multinomial logit model for household energy consumption for cooking. Six energy types—i.e. electricity, wood, kerosene, LPG, charcoal and others (which include grasses, animal dung, crop residue, etc.) have been modelled. Table shows the estimates of the multinomial logits for household fuel consumption for lighting. Three fuel types—i.e. electricity from the national grid, electricity based on generators, and others (which include flashlight, lanterns, lamps, candles, etc.) have been modelled. The estimates are, generally, robust. This is shown by the values of the likelihood ratio statistics, which is statistically significant at less than 1% and the probability chi-square for the models. Other forms of fuel for cooking have no statistical and economic significance; hence, we excluded their values, since there will be no meaning interpreting them.
Table 4. Marginal effects at representative values (MER) for cooking/multinomial logit
Table 5. Marginal effects at representative values (MER) for lighting/multinomial logit
Based on Table , a female-headed household shows a reduced probability of using electricity to cook by 0.6%, LPG/natural gas by 3.9%, kerosene by 0.07% and has an increase in the probabilities of using charcoal by 4.4%, and wood by 0.06% to cook. Female-headed households may not have the economic strength to adopt and use modern energy (i.e. electricity and LPG) compared to their male counterparts. It is found that in Ghana, and most SSA countries, women are financially weak (Osabuohien & Karakara, Citation2018) compared to men. However, gender of household head as a variable is significant at 1% level for electricity and significant at 5% level for LPG/natural gas and charcoal and 10% level for kerosene, while it is not significant for wood. This finding agrees with what Kwakwa and Wiafe (Citation2013) and Ogwumike et al. (Citation2014) found in their various studies.
An increase in the age of the household head by 1 year reduces the probabilities of using electricity as fuel to cook by 0.007% and LPG/natural gas by 0.4% and increases the probabilities of using wood by 0.02%, charcoal by 0.4%, and kerosene by 0.003%. Perhaps, older people, as found elsewhere (Chabossou, Stork, Stork, & Zahonogo, Citation2009; Karakara & Osabuohien, Citation2019), are not attuned to technology, as the use of electricity and LPG comes with some form of knowledge. Age is significant at 1% level for the use of LPG, charcoal, and wood and not significant for the use of kerosene. This finding is consistent with Abebaw (Citation2007) and Ogwumike et al. (Citation2014). Also, an increase in the size of the household by one member leads to a reduction in the probabilities of using electricity by 0.03%, LPG/natural gas by 4.4% and increases the probabilities for charcoal by 4.2%, wood by 0.2% and kerosene by 0.01% for cooking purposes. This finding is so because, a larger household size calls for more food to be cooked and thus, on the average, cooking might cost more than a smaller household size. Using LPG or electricity may cost more than resorting to wood or charcoal for large cooking. The size of household is significant at 1% in determining the use of LPG/natural gas, charcoal and wood but not significant in determining electricity and kerosene. This is similar to what other studies like Abebaw (Citation2007), Ogwumike et al. (Citation2014), and Onoja and Idoko (Citation2012) concluded.
If the household head attained at least a primary education, it increases the probabilities of using electricity by 0.1%, LPG/natural gas by 13.2%, kerosene by 0.01% and reduces the probabilities of using charcoal by 13% and wood by 0.3%. An educated individual might know the possible dangers of using non-modern fuels (like wood, charcoal, grass and animal dung) and thus, will consume modern fuels (like electricity and LPG). Also, educated persons might have a secured and decent job and can thus, afford to use modern fuels. Education as a variable is significant at a 1% level for LPG/natural gas and charcoal usage and not significant for electricity, wood and kerosene. On marital status of household head, the result shows that a household head being currently married increases the probabilities of using electricity by 0.2%, charcoal by 2.5%, kerosene by 0.07% and reduces the probabilities of using LPG/natural gas by 2.6% and wood by 0.2% for cooking purpose. Thus, a married individual might pool together with his/her spouse to afford the services of electricity for cooking than an unmarried person. Similar results were found by Mensah and Adu (Citation2013), Ogwumike et al. (Citation2014) and Tchereni (Citation2013).
The nature of residence of households also determines the fuel type which households use. An urban household has a reduction in the probabilities of using charcoal by 22%, kerosene by 0.1%, and electricity by 0.1% to cook. It, however, increases the probabilities of using LPG/natural gas by 22.3%, wood by 0.6%, and other forms of fuels by 0.08% for cooking. It is significant at 1% level for LPG/natural gas and charcoal usage but not significant for the use of electricity, wood, kerosene, and other fuels. Electricity is not significant, partly because the number of households which adopt it as their cooking fuel is proportionately low (0.84%) and most rural homes may have access but will not resort to using it for their cooking needs, because of the perceived high cost of using it. Ogwumike et al. (Citation2014) had similar indications in their studies.
The results further show that richer households have increased in the probabilities of using electricity to cook by 0.1%, LPG/natural gas to cook by 42%, charcoal to cook by 40%, and are less likely to use kerosene (by 0.1%) and wood (by 2.3%) to cook. The wealth status is significant at the 1% level in determining LPG and charcoal, but not significant in determining kerosene and wood. This is so because the improvement in wealth status means more income, which allows households to afford the usage of fuels such as electricity, LPG/natural gas, kerosene and reduces the consumption of fuels such as wood, animal dung, grass, crop residue, etc. This observation corresponds with the so-called energy ladder hypothesis (Aitken, Citation2007; Heltberg, Citation2003; Ogwumike et al., Citation2014).
There were 10 administrative regionsFootnote5 in Ghana. The major regions are the Greater Accra, Ashanti, Western and Northern. The most urban-populated cities (Accra, Tema, Kumasi, Takoradi and Tamale) are located in these regions. Also, Accra and Kumasi have the largest population, compared to the other regions (Ghana Statistical Service, Citation2014). The Western Region is the base outcome to which the other regions are compared to because the region is a middle-income region and, thus, we could compare a high-income region (such as Greater Accra) to Western and a low-income region (such as Upper West) to Western. On the regional disparities and household energy consumption, the results show that, compared to a household from the Western Region, if a household is from the Central Region, it has a reduction in the probabilities of using electricity to cook by 0.1%, LPG/natural gas to cook by 4.5% and kerosene to cook by 0.05% and such household is more likely to use charcoal (4.7%) or wood (0.2%) to cook. However, it is only significant with the use of wood at a 10% level. A household from other regions has an increase in the likelihood of using any of the fuels to cook, compared to a household from Western Region, while households from Central (0.1%) and Volta (0.1%) regions have probabilities of adopting the fuels for cooking lesser than those in Western Region. However, only Greater Accra and Eastern are significant at the 10% level; the rest are insignificant. This is so because, Greater Accra, Ashanti and Eastern regions are more electrified than Western region, and Western region is more electrified than Volta, Upper East, and Central regions.
Compared to households from the Western Region, the probabilities of using LPG/natural gas for cooking are reduced for the households in other regions (by 4.5% for Central, 8.2% for Volta, 12% for Eastern, 6% for Ashanti, 0.1% for Brong-Ahafo, 27% for Northern, 18% for Upper East and 16% for Upper West) and increased for households from Greater Accra by 3.6%. This means that a household from Greater Accra is 3.6% more likely to use LPG/natural gas for cooking than a household from the Western Region and a household from Upper East is 18% less likely to use LPG/natural gas for cooking compared to households from the Western Region. This is so because Greater Accra is more developed than the Western Region and the Region is more developed than the Upper East Region. All these regional variables are significant at the 1% level, except Ashanti, which is significant at 5% level, and Central, Greater Accra and Brong-Ahafo are not significant.
(**) significant at 5% level; (*) significant at 10% level. Base category is kerosene.
Adopting charcoal for cooking shows that, compared to households from the Western Region, a household from other regions has increased probabilities of using charcoal by 4.7% if the household is from Central Region, by 11.3% if household is from Eastern Region, by 6% if the household is from Ashanti Region, by 26.5% if the household is from Northern Region and by 16% if the household is from and Upper West Region. This is partly because Western Region as regarded as the oil city region have some access to modern fuels than those regions. There is a reduction in the probabilities of using charcoal to cook by households from Greater Accra Region by 4%, Volta Region by 7.6%, Brong-Ahafo Region by 0.1%, and Upper East Region by 17%, as compared to households from Western Region. For the use of wood as cooking fuel, if a household is from Greater Accra Region, the likelihood of it using wood to cook reduces by 0.1% compared to a household from the western region and by 0.2% for a household from Ashanti region, compared to a household from Western Region. This is so partly because the Greater Accra (poverty incidence of 5.6Footnote6) and Ashanti (poverty incidence of 14.8) regions are more developed and richer than Western Region (poverty incidence of 20.9) (Ghana Statistical Service, Citation2014) and, therefore, households there may be able to afford better and cleaner fuels than households from Western Region. But households from other regions have a probability of using wood to cook more than household from western region. On the use of kerosene, all the regional variables are not significant. Compared to households from the Western Region, households from Upper East Region are 0.1% more likely to use kerosene to cook.
4.3.2. Multinomial logit results for energy for lighting
Table captures fuel for lighting. A female-headed household has an increased probability of using main electricity for lighting by 1.6% and other fuel types by 0.01%, and a reduction in the probability of using a generator for lighting by 1.6%. However, it is significant at the 1% level for generator usage and main electricity usage. This is so partly because, households headed by women are often in the poorer wealth strata, compared to men-headed households which are in the richest category (70% of richest households are male-headed, as against 30% female-headed households). Therefore, they may not be able to afford the cost of running a generator because of the sunk costs associated with purchasing a generator.
A one-year increase in the age of the household head reduces the probabilities of using main electricity by 0.02% and generator by 0.02% for lighting. An increase in household size by one member increases the probabilities of using main electricity by 0.2% and generator by 0.2% and reduces the probability of usage of other fuels by 0.2%. On average, the average costs per household member to use a certain type of energy decrease with larger households. Furthermore, larger rural households may be able to cultivate larger farms, thus increasing their income. Thus, as the number of household members becomes larger, it becomes easier and per household member on average cheaper to use main electricity and generator for lighting than other fuels such as candles, lanterns, flashlights, etc., to satisfy such large number. This is significant at a 1% level for all the fuels type. This is in line with what Ogwumike et al. (Citation2014) found in their study.
Urban-based households show an increased probability of using main electricity by 2%, of other fuels for lighting by 0.01% and generator by 2%. Nature of residence (rural/urban) is significant at the 1% level in determining the use of main electricity and in determining generator use and not significant for use of other fuels. This is so because urban settings most often have access to electricity as compared to rural settings. The household head being a primary school lever increases the probabilities of using main electricity by 0.7% and generator by 0.8% and reduces the probability of using other fuels by 0.08%. An educated person might be better employed and earn more income to afford electricity than an uneducated person. It is significant at 1% level for all the fuels for lighting. As people are more educated, they can earn more income to afford main electricity or generator. This reduces the use of other fuels like lanterns, candles, flashlight, etc., for lighting.
The head of a household being currently married increases the probability of using main electricity by 0.5%, reduces generator use by 0.5% and increases the probability of using other fuels such as lanterns, flashlight, candles, etc., by 0.06%. Perhaps, married couples could pool together and afford the use of electricity. It is significant for other fuels at a 5% level and not significant for generator and main electricity use. A household being richer increases the probabilities of using main electricity by 0.2%, generator by 0.8% and reduces the probability of using other fuels by 0.6%. It is significant at the 1% level for generator and other fuels usage. This confirms the commonly known as energy ladder hypothesis.
Compared to households from the Western Region, the probability of using main electricity for lighting reduces by 0.4% for Central Region, 0.07% for Volta, 0.5% for Eastern, 0.6% for Ashanti, 0.1% for Brong-Ahafo and 2.6% for Upper East and increases for household from Greater Accra by 1.5%, Northern region by 0.1% and Upper West by 0.7%. For generator usage, compared to households from Western Region, households from Greater Accra Region have an increased probability of using generator for lighting by 1.3% which is significant at the 5% level. Households from Ashanti Region have a probability of using generator of 0.08% less than households from Western Region. However, it is not significant. A household from Upper East Region is 0.026% more likely to use other fuels like candles, flashlight, lanterns, etc., for lighting than a household from Western Region.
The results further show that a household from Volta (0.07%), Eastern (0.5%), Ashanti (0.6%), Brong-Ahafo (0.1%) and Upper East (2.6%) has a lesser probability of using main electricity for lighting compared to a household from Western Region. On the contrary, households from these regions are more likely to use other fuels for lighting than households from the Western Region. A household from the Northern Region is 0.1% more likely to use main electricity and 0.1% less likely to use other fuels than a household from Western Region, and it is only significant at a 1% level for other fuels. Also, a household from the Upper West Region is 0.7% more likely to use main electricity and 0.2% less likely to use other fuels than a household from the Western Region.
4.3.3. Post-estimation test
4.3.3.1. Goodness-of-fit test
The test of goodness of fit results from the Hosmer-Lemeshow gave a Prob>Chi2 value of 0.004 for the cooking model and 0.033 for the lighting model. From these (Prob>Chi2) values, we can conclude that the models fit reasonably well (is of good fit). The study runs the fit-based test (fitstat) to ascertain the specification and fit of our multinomial logit for cooking. It shows that the difference of 287.710 in Bayesian information criteria (BIC) of our full model and the reduced model provides a very strong support for our model that it is correctly specified and of fit.
4.3.3.2. Test for combining outcome categories
The study runs the Wald test for combining categories. This test is to find out whether two categories are similar and hence should be combined. This is somehow similar to the independent of irrelevant alternatives (IIA) test. The null hypothesis for this test is that all coefficients, except intercepts associated with a given pair of outcomes, are zero (i.e. categories can be collapsed). Comparing each category to the other, say electricity to LPG/natural gas or electricity to kerosene etc., the study found that the Prob>Chi2 values are highly significant (0.000). Thus, we can reject the hypothesis that the various outcomes are indistinguishable and can be collapsed. In Table , however, the null hypothesis for kerosene to charcoal category, which has the Prob>Chi2 value of 0.246, cannot be rejected. Statistically, the number of households using charcoal (3,546) is huge and that of kerosene (21) is very insignificant, thus combining them would lead to suppressing the effect of kerosene in the analysis. Besides, the data captured questionnaire that asked households to mention the major fuel use for cooking (thus, those who use kerosene as their major fuel cannot be combined with charcoal users).
Table 6. Test for combining outcome categories
4.3.3.3. Independent of irrelevant alternatives (IIA)
The test of IIA, as shown in Table , indicates that all outcome categories are for the null hypothesis that the odds of one outcome versus the other outcome are independent of other outcome alternatives. The Chi2 values are negative, which is found to be common (Long and Freese Citation2001) and Hausman and McFadden (Citation1984) noted this possibility with a conclusion that a negative result is evident that IIA has not been violated.
Table 7. Hausman tests of IIA assumption
4.4. Multidimensional energy poverty index estimation for Ghana (MEPI)
The paper estimated MEPI on six major indicators of energy deprivation. These indicators are access to modern cooking fuel, indoor pollution, access to lighting, services provided by means of household appliances, entertainment/education, and communication dimension. In the estimation, the study had the proportion of households being (deprived) energy poor (H) to be 0.841, which represents the headcount ratio. Also, the average proportion (A) was found to be 0.778, which means that poor people are, poor on average in three of the six dimensions.
So our MEPI is given in Equationequation (6)(6)
(6)
The figure (0.65) shows that Ghanaian households are moderately energy poor. This is so because most households are deprived of usage of modern cooking fuels like electricity and LPG. Our figure (0.65) is in line with what Nussbaumer, Nerini, Onyeji, and Howells (Citation2013) found for Ghana to be between 0.5 and 0.7, when they estimated MEPI for a group of Sub-Saharan African countries. The study decomposes the figure 0.65 into rural and urban contribution. This is to help capture the nature of residence of a household and the likelihood of such household being deprived. The result is shown as an appendix. It shows that 57% of all energy-poor households are rural households and 43% are urban households. This confirms that energy deprivation is, to some extent, a matter of residence. More rural households are energy deprived than urban households. Over the period (from 0.92 in 2003 to 0.65 in 2014), the number of rural households that are energy poor is on the increase (from 53.3% to 57%) while that of urban areas is on the decrease (46.7% to 42.9%). This suggests that energy poverty is a residence matter.
The study estimated MEPI over time to track changes in energy poverty in Ghana. Using three waves of the data for 2003, 2008 and 2014 the study established that energy poverty has been declining over these years. This means that more and more households are gaining access to clean energy sources for cooking and lighting. Table shows that the MEPI figure was 0.92 in 2003, showing acute energy poverty and reduced to 0.81 in 2008 and further to 0.65 in 2014. This reduction in MEPI could be attributed to the fact that Ghana has made tremendous moves through programmes such as the NES, the SHEP I and II, the LPG promotion, kerosene promotion porgramme, improved cook stoves initiative to ensure access to electricity by households. This has placed Ghana third after Mauritius and South Africa in terms of countries which have the highest proportion of their population having access to electricity in Sub-Saharan Africa (Kemausuor et al., Citation2011).
Table 8. Multidimensional energy poverty index (MEPI)
5. Conclusion and policy implication
Lack of access to modern energy by households, to some extent, is both a cause and consequence of underdevelopment, which exacerbates poverty in general. This study focused on determining the factors that influence household energy use for domestic purposes (i.e., lightening and cooking) in Ghana and to observe how households are deprived (energy poor) in modern energy use.
The results show that biomass fuels, particularly wood and charcoal (78%) remain the most dominant fuel types in use for cooking. Concerning the use of fuels for lighting, electricity (69%) is the dominant fuel type used by households in Ghana. It was found that in Ghana there are several socioeconomic factors that have a substantial effect on households’ choice of different fuels for domestic purposes. Wealth status and type of fuel consumed by households exhibited the energy ladder hypothesis, as households which are poorest and poorer consume biomass fuels and the richer and richest homes consume clean fuels like electricity and LPG for cooking (as about 80% of those households which use wood are the poorer and poorest homes while 91% of the household that use LPG are from richer and richest homes).
An estimate of energy poverty over the years 2003 to 2014 shows a steady decline from an acute energy poverty figure (0.91) in 2003 to a moderate figure (0.65) in 2014. It was realized that in terms of energy deprivations, rural households are somewhat more deprived than their urban counterparts in cooking and pollution dimensions. Cooking and pollution dimensions are the major contributors to the MEPI while the lighting dimension is the least contributor. Thus, energy deprivation is a matter of residence. Both the headcount ratio (i.e. the proportion of households deemed to be energy poor) and the intensity of deprivation over the years 2003 to 2014 keep declining, which shows an improvement in energy access in Ghana. Tremendous achievements are made in the lighting deprivation dimension as against the cooking dimension.
Considering the findings and conclusions of the study, some policy implications are discussed. The Ministry of Energy should speed up efforts like the LPG promotion to households to ensure that all Ghanaian households have adequate access to modern sources of fuels that are environmental-friendly. Giving subsidies could help more households to have access to and use clean fuels and this could save cost relating to public health, as fewer people will get sick by the use of fuels. These initiatives could be geared towards rural homes and each energy dimension like indoor pollution and cooking fuel should be addressed individually in order to reduce the MEPI. Supply of clean fuels should also be forthcoming to ensure households continue to adopt these clean fuels.
As a way of suggesting an area for future research, we conclude that future research should consider data that capture the cost of fuels being used, as this cost affects patronage. This cost should be monetary cost as well as opportunity cost of acquiring and using different fuels. Researchers may as well look at the different fuels used by a household to determine which ones are used alongside each other when income increases to determine the fuel stacking behavior of households in Ghana. Future research may also expand in focus to look at how households’ energy access and energy poverty are across countries or the sub-region.
Acknowledgements
The useful comments from the editor and anonymous reviewers that have improved the quality of the paper are greatly appreciated. The first author wishes to acknowledge the mentoring support from Prof. Evans Osabuohien of Covenant University, Nigeria. We are also grateful to Mr. Ebenezer Agbaglo of the Department of English, University of Cape Coast, who thoroughly copy-edited this manuscript for language usage, spelling and grammar. The views expressed are the authors’.
Additional information
Funding
Notes on contributors
Alhassan Abdul-Wakeel Karakara
Alhassan Abdul-Wakeel Karakara is a Ph.D Candidate at the School of Economics, University of Cape Coast. He had his first degree in Economics, MSc. Economics of Technology and Development as well as Master of Philosophy in Economics all from the University of Cape Coast, Ghana. He has served as a discussant and presenter in international conferences. He was a panel in the African Innovation Summit II, in Kigali Rwanda in June 2018. His research interest includes; Poverty studies, energy economics, development economics and international trade with emphasis on developing economies.
Isaac Dasmani
Dr. Isaac Dasmani is a senior lecturer at the School of Economics, University of Cape Coast, Ghana. His areas of specialization include Environmental and Recourse Economics with emphasis on climate Economics where he has a number of research articles in some reputable Journals to his credit. He also has a specialty in Micro –data analysis using STATA and other related policy issues.
Notes
1. An ordered response has more than two outcomes. If y is an ordered response, then the values assigned to each outcome are no longer arbitrary. Thus, ordered probit models look at situations where the dependent variable categories are ordered such as lowest to highest (Cameron & Trivedi, Citation2005).
2. Tobit model looks at a regression when the dependent variable of interest is incompletely observed. Leading causes of incompletely observed data are truncation and censoring. Thus, Tobit models a linear regression with normal homoscedastic errors that becomes nonlinear as the result of censoring or truncation (Cameron & Trivedi, Citation2005).
3. Wealth status in this study is based on a wealth index created by the data administrators. The index measures the income level of households, ownership of household appliances, welfare (health, education) and employment status. Poorest households are those at the bottom of income less than the US$2 per day with no access to household appliance, and children not in school. Richer homes have improvements in those indicators.
4. The Self Help Electrification Programme (SHEP I and II) were programmes that were subsidiary projects under the National Electrification Project-NES. Under the SHEP, communities that are within a distance of 20 km from an existing medium voltage (MV) (ie. 11 kV and 34.5 kVnetworks) and which had taken the initiative to provide the Low Voltage (LV) poles required for their communities were assisted by the Government for connection to the national electricity grid ahead of their scheduled connection time under the National Electrification Master Plan. The SHEP I was the electrification of district capital towns and villages en-route to the district capitals between the years 1990–1991 and SHEP II was implemented between 1992 & 1994.
5. However, currently, Ghana has 16 administrative regions as 6 more regions were created by a referendum in February 2019 .
6. Poverty incidence means the proportion of the population that is poor. Thus, 5.6% of the population in the Greater Accra region is poor while in the Western region it is 20.9% (Ghana Statistical Service, Citation2014).
References
- Abebaw, E., . D. (2007). Household determinants of fuel wood choice in urban Ethiopia: A case study of Jimma Town. The Journal of Developing Areas, 41(1), 117–24.
- Aitken, R. (2007). Household energy use: A comparison of household energy consumption and expenditure across three provinces. Journal of Energy in Southern Africa, 18(1), 20–28. doi:10.17159/2413-3051/2007/v18i1a3338
- Akpalu, W., Dasmani, I., & Aglobetsi, P. B. (2011). Demand for cooking fuels in a developing country: To what extent do taste and preferences matter?. Energy Policy, 6525–6531. doi:10.1016/j.enpol.2011.07.054
- Alkire, S., & Foster, J. E. (2011). Counting and multidimensional poverty measurement. Journal of Public Economics, 95(7–8), 476–487. doi:10.1016/j.jpubeco.2010.11.006
- Alkire, S., & Santos, M. E. (2010). Acute multidimensional poverty: A new index for developing countries. Oxford Poverty and Human Development Initiative Working Paper No. 38. UK: University of Oxford.
- Atkinson, A. B. (2003). Multidimensional deprivation: Contrasting social welfare and counting approaches. Journal of Economic Inequality, 1, 51–65. doi:10.1023/A:1023903525276
- Awan, R. U., Abbas, A., & Sher, F. (2014). An investigation of multidimensional energy poverty in Pakistan: A province level analysis. International Journal of Energy Economics and Policy, 4(1), 65–75.
- Bartels, F. L. (2007). Energy. In Industry modernization and poverty reduction: A review and analysis of current policy thinking. UNIDO Staff Working Paper 06/2007. Vienna: United Nations Industrial Development Organization.
- Cameron, A. C., & Trivedi, P. K. (2005). Microeconometrics: Methods and applications. UK: Cambridge University Press.
- Campbell, B. M., Vermeulen, S. J., Mangono, J. J., & Mabugu, R. (2003). The energy transition in action: Urban domestic fuel choice in a changing Zimbabwe. Energy Policy, 31, 553–562. doi:10.1016/S0301-4215(02)00098-8
- Chabossou, A., Stork, C., Stork, M., & Zahonogo, Z. (2009, April 17–19). Mobile telephony access and usage in Africa. Paper Presented at the Information and Communication Technologies and Development (ICTD), 2009 International Conference.
- Demurger, S., & Fournier, M. (2007). Rural poverty and fuelwood consumption: Evidence from Labagoumen Township China. Lyon: University of Lyon F-69003. Retrieved from http://ssrn.com/abstract=553761
- Edoumiekumo, S. G., Tombofa, S. S., & Karimo, T. M. (2013). Multidimensional energy poverty in the south-south geopolitical zone of Nigeria. Journal of Economics and Sustainable Development, 4(20), 96–103.
- Edwards, J. H. Y., & Langpap, C. (2008). Fuel choice, Indoor Air Pollution, and Children’s Health. Loiusiana, Switzerland: Tulane University. Tulane Economics Working Paper Series #0803.
- Fahmy, E., Gordon, D., & Patsios, D. (2011). Predicting fuel poverty at a small-area level in England. Energy Policy, 39, 4370–4377. doi:10.1016/j.enpol.2011.04.057
- Faisal, W. A., Brew-Hammond, A., & Osei, E. E. (2013). Relationships between energy use and income levels for households in Ghana. European Scientific Journal, 9(6), 233–245.
- Ghana Statistical Service. (2014). Poverty Profile in Ghana 2005 – 2013, Ghana living standard survey (glss 6) round six. Retrieved from https://www.worldcat.org/title/ghana-living-standards-survey-round-6-glss-6-poverty-profile-in-ghana-2005-2013/oclc/918616196
- Government of Ghana. (2015). Ghana’s sustainable energy for all action plan. Retrieved from http://energycom.gov.gh/files/SE4ALL-GHANA%20ACTION%20PLAN.pdf
- Greene, H. W. (2003). Econometric analysis (5th ed.). New Jersey: Prentice- Hall.
- Hausman, J., & McFadden, D. (1984). Specification tests for the multinomial logit model. Econometrica, 52(5), 1219–1240. doi:10.2307/1910997
- Heltberg, R. (2003). Household fuel and energy use in developing countries—A Multi-country study. Draft for discussion (pp. 1–86). Oil and Gas Policy Division. The World Bank.
- IEA. (2006). World energy outlook 2006. Paris: Author.
- IEA. (2010). Energy poverty: How to make modern energy access universal? World energy outlook 2010. Paris: Author.
- Judge, G., Hill, R. C., Griffiths, W. E., Lǘtkepohl, H., & Lee, T. C. (1985). Theory and practice of econometrics. New York: John Wiley and Sons.
- Kakwani, N., & Silber, J. (2008). The many dimensions of poverty. UK: Palgrave MacMillan.
- Karakara, A. A. (2018). Energy-poverty nexus: Conceptual framework analysis of cooking fuel consumption in Ghanaian households. Developing Country Studies, 8(11), 1–10.
- Karakara, A. A., & Osabuohien, E. S. (2019). Households’ ICT access and bank patronage in West Africa: Empirical insights from Burkina Faso and Ghana. Technology in Society, 56(2019), 116–125. doi:10.1016/j.techsoc.2018.09.010
- Kemausuor, F., Obeng, J. Y., Brew-Hammond, A., & Duker, A. (2011). A review of trends, policies and plans for increasing energy access in Ghana. Renewable and Sustainable Energy Reviews, 15, 5143–5154. doi:10.1016/j.rser.2011.07.041
- Kimemia, D., & Annegarn, H. (2011). An urban biomass energy economy in Johannesburg, South Africa. Energy for Sustainable Development., 15, 382–387. doi:10.1016/j.esd.2011.10.002
- Kohler, M., Rhodes, B., & Vermaak, C. (2009). Developing an energy-based poverty line for South Africa. Journal of Interdisciplinary Economics, 21(2), 163–195. doi:10.1177/02601079X09002100204
- Kwakwa, P. A., & Wiafe, E. D. (2013). Fuel-wood usage assessment among rural households’ in Ghana. Spanish Journal of Rural Development, IV(1), 41–48.
- Legros, G., Havet, I., Bruce, N., & Sophie, B. (2009). Energy assess situation in developing countries: A review focusing on the least developed countries and Sub-Saharan Africa. NewYork: UNDP and World Health Organization.
- Long, J. S., & Freese, J. (2001). Regression models for categorical dependent variables using stata. Texas: A stata press publication, STATA Corporation, College Station.
- Mangizvo, V. R. (2014). The significance of culture as a household energy determinant: The case of Chiwundura Communal Area, Zimbabwe. Journal of Human Ecology, 46(3), 343–349. doi:10.1080/09709274.2014.11906732
- McFadden, D. (1974). Conditional logit analysis of qualitative choice behaviour. In P. Zarembka (Ed.), Economic theory and mathematical economics. New York: Academic Press.
- Mekonnen, A., & Kohlin, G. (2008). Determinants of household fuel choice in major cities in Ethiopia. Addis Ababa, Ethiopia: Environment for Development. Discussion Paper Series. EfD DP 08 – 18.
- Mensah, T. J., & Adu, G. (2013). An empirical analysis of household energy choice in Ghana. Department of Economics working paper No. 06/2013. Sweden: Swedish University of Agricultural Sciences.
- Ministry of Energy – Ghana. (2010). National electrification scheme (NES) master plan review (2011–2020). Retrieved from http://www.mida.gov.gh/pages/view/NES_Master_Plan_Review_Executive_Summary_Main_Report.pdf/111
- Modi, V., McDade, S., Dominique, L., & Saghir, J. (2005). Energy services for the millennium development goals. New York: Energy Sector Management Assistance Programme, United Nations Development Programme, UN Millennium Project, and World Bank.
- Nlom, H. J ., & Karimov, A. A. (2014). Modelling fuel choice among households ’ in northern cameroon. UNU-WIDER Working Paper 2014/038. Helsinki: United Nations University.
- Nussbaumer, P., Bazilian, M., & Modi, V. (2012). Measuring energy poverty: Focusing on what matters. Renewable and Sustainable Energy Reviews, 16(1), 231–243. doi:10.1016/j.rser.2011.07.150
- Nussbaumer, P., Nerini, F. F., Onyeji, I., & Howells, M. (2013). Global insights based on the multidimensional energy poverty index (MEPI). Sustainability, 5, 2060–2076. doi:10.3390/su5052060
- Ogwumike, F. O., Ozughalu, U. M., & Abiona, G. A. (2014). Household energy use and determinants: Evidence from Nigeria. International Journal of Energy Economics and Policy, 4(2), 248–262.
- Onoja, A. O., & Idoko, O. (2012). Econometric analysis of factors influencing fuel wood demand in rural and peri-urban farm households in Kogi State, Nigeria. The Journal of Sustainable Development, 8(1), 115–127.
- Osabuohien, E. S., & Karakara, A. A. (2018). ICT usage, mobile money and financial access of women in Ghana. Africagrowth Agenda Journal, 15(1), 14–18.
- Pachauri, S., Ekholm, T., Krey, V., & Riahi, K. (2010). Determinants of household energy consumption in India. Energy Policy, 38, 5696–5707. doi:10.1016/j.enpol.2010.05.017
- Rajmohan, K., & Weerahewa, J. (2009). Household energy consumption patterns in Sri Lanka. Retrieved from http://www.sljl.info/index.php/SJAE/article/download/1833/1526
- Institute of Statistical, Social and Economic Research. (ISSER). (2005). Guide to Electric Power in Ghana (5th ed). Legon, Resources Center for Energy Economics and Regulation, University of Ghana.
- Tchereni, B. H. M. (2013). An economic investigation in to fuel wood demand behavior in South Lunzu township in Malawi. Developing Countries Studies, 3(4), 153–159.
- United Nations Environmental Program (UNEP)–Risoe Center. (2013). Understanding the concept of nationally appropriate mitigation action. Denmark: National Laboratory for Sustainable Energy. Technical University of Denmark.
Appendix
Rural/Urban divide in energy poverty
To estimate the contribution of rural households or urban households to the numerical value of 0.65 of the MEPI we had, we adopted this formula from Alkire and Foster (Citation2011):
Where; n1 is rthe number of household from rural areas,
n2 is the number of household from urban setting,
n is n1 + n2, which is total sampled households,
P(X1) is the proportion of rural households who are deemed energy deprived (energy poor),
P(X2) is the proportion of urban households who are deemed energy deprived (energy poor).
To determine each area contribution to the overall energy poverty index, the formula is;
We had weights (w) for each dimension and headcount ratio (hj) for each dimension in each area (rural/urban).
For Urban contribution
For Rural contribution