
 ?Mathematical formulae have been encoded as MathML and are displayed in this HTML version using MathJax in order to improve their display. Uncheck the box to turn MathJax off. This feature requires Javascript. Click on a formula to zoom.
Abstract
The third of the sustainable development goals is to ensure healthy living and promote well-being for all by 2030. The Nigerian government has made several efforts at achieving this goal. Economic experts have projected that the Nigerian economy must grow at a minimum rate of 6–8% yearly to catch up with global development and contribute positively to goals set by nations of the world. However, the attainment of high levels of economic growth could have implications for the attainment of other development objectives in the economy. One of such implications is pollution of the environment caused through productive activities. In carrying out productive activities, a cycle from production to consumption occurs to affect the release of emissions into the atmosphere and environment which in turn hampers health stability. In order to assess the cyclical effects of these economic relationships, this study adopted the use of a moderated mediation model. The model helped in the explanation of interactions among economic growth, air pollution and health performance. The interactions were analyzed with PROCESS macro, an analytical tool developed by Hayes. The study found air pollution and government expenditure on health as a significant interaction that affects health performance in Nigeria. Consequently, efforts by the government to ensure environmentally friendly production and consumption will minimize air pollution and prevent adverse health outcomes. Manufacturing firms that emit poisonous gases into the air should be sanctioned. This will serve as a deterrent to others.
PUBLIC INTEREST STATEMENT
Every citizen desires to enjoy perfect health. Increase in income is an important means of achieving this desire. More often everyone concentrates on the benefits of economic growth. It is seldom realized that the process of growth brings with it adverse consequences such as pollution which in turn may affect health adversely. This study has brought to the fore both the positive and adverse consequences of economic growth for health. It has also highlighted the possibility of reducing the adverse effect of economic growth on health through the intervention of government. In a nutshell, in order to achieve maximum health benefits as income increases, every sector of the economy must identify and play its role adequately. The household must start to agitate for environmental-friendly production. For instance, electric engines and solar energy should replace fossil fuel. The government must ensure that existing environmental laws are efficiently enforced.
1. Introduction
This paper is situated in goal 3 of the sustainable development goals (SDGs) which is to ensure healthy living and promote well-being for all at all ages by 2030. In line with this goal, it is expected that by 2030, (i) there will be a reduction in the global maternity mortality rate to less than 70 per 100,000 live births; (ii) there will be an end to preventable death of new-borns and children under 5 years of age, a reduction of under-5 mortality rate to 25 per 1,000; and (iii) to substantially reduce the number of deaths and illnesses from hazardous chemicals and air, water and soil pollution and contamination. Unfortunately, Nigeria still has a high rate of under-5 mortality (estimated at 70 per 1,000) and a high maternal mortality rate (120 per 100,000 live births) (United Nations, Citation2016). In view of the high rate of air pollution, especially in the urban areas, this study sets out to examine how to maximize health benefits of economic growth while ensuring that air pollution is minimized at the same time wards achieving SDG-3 of promotion of healthy living and well-being for all population.
It is a common knowledge that economic growth that is not well managed may not lead to sustainable development (Urhie, Odebiyi, & Popoola, Citation2017). Although the development of an economy requires growth in terms of income, it also entails social progress such as improvement in the health status of the citizens. It should be noted that a mismanagement of the growth process may hamper the achievement of sustainable development in many respects. For instance, between 2005 and 2017, Nigeria’s gross domestic product (GDP), which is a measure of economic performance, grew by over 235% from $112 billion to $375 billion. Within the same period, the Human Development Index, an index commonly used to measure economic development, increased by 14.4% from 0.465 to 0.532. Similarly, LEAB increased marginally from 48.2 to 53.4 years within the same period (World Development Indicators [WDI], Citation2018).
According to Dhanya (Citation2015), an increase in production and productive activities of a country is a catalyst for growth, but these activities are usually plagued with a rising spate of air pollution, especially in developing countries. In Nigeria, productive activities are often associated with massive pollution due to the poor supply of electricity and poorly maintained state of mechanical engines. In the study of Nwankwo (Citation2013), electricity supply was asserted to positively influence the level of productivity in Nigeria, and the study suggested that electricity is the force that drives continuous growth of any economy, but amidst boosting productive and consumption activities to steer economic growth, the inadequate supply of electricity in Nigeria has inadvertently led to the massive acquisition of generators to power up homes, offices and shops. The World Bank (Citation2014) reported that Nigeria needs an average of 8,000 to 10,000 megawatts to meet energy needs; however, current supply which falls short by over 80% leaves room for an alternative source of electricity filled majorly by electricity generating sets.
Unfortunately, the effects of powering up industrious activities release unhealthy portions of carbon dioxide into the atmosphere, causing pollution that increasingly causes threats to not just human health but to other living creatures on earth. Chigbo (Citation2011) categorised productive and consumption activities to be explorative or exploitative in nature. The study noted that either which negatively affects the environment, causing earth instability and emission of obnoxious gases leading to climate and environmental changes. This further emanates into health challenges by factors which include waterborne disease, air pollution and exposure to harmful chemicals (World Health Organisation (WHO, Citation2014)).
With air pollution now identified as the leading cause of death in the world (WHO, Citation2018), and productive activities recorded to be the fastest way to get the air polluted, Nigeria’s level of emissions measured by PM2.5 reaches as high as 125 µg per cubic meter annually, and this is significantly higher than the recommended levels and world averages. A measure of Nigeria health status shows that 12.5 deaths per 1,000 live persons are recorded daily as against a global average of 7.6 deaths per 1,000 live persons. This places Nigeria as the 15th highest among countries of the world with high death rates per 1,000 live persons (WDI, Citation2018). Similarly, the rate of infant mortality which stands at 64.6 per 1,000 live births puts Nigeria as the 9th country globally with high infant mortality rate. This is in sharp contrast to the average 29.4 per 1,000 live infants that die across the world before reaching 1 year of age.
While an emission record in Nigeria to indicate the contribution of pollution from various sources is not yet standardised, evaluations indicate that petrol- or diesel-fuelled engines used to power homes and businesses are major sources of pollution. Emissions from diesel- and petrol-run engines including generators, cars and other means of transportation constantly pollute the environment, without efficient checks to prevent hazards.
It is interesting to note that many studies (for instance, Matthew et al., Citation2019) that examined the relationship among government policy, economic growth and sustainable development fail to account for the actual role played by each factor—transmission medium or moderator. In order to evaluate health implications of economic growth and aid in the achievement of sustainable economic development, this study has the following specific objectives: (i) to assess the direct, indirect and total effects of economic growth on health; and (ii) to analyze the extent to which public spending on health moderates the impact of air pollution on the health of citizens.
2. Literature review
The processes and outcomes of economic growth are associated with both positive and adverse consequences. These processes and outcomes are interrelated. The dynamic relationships among these variables are not often captured by any single study. Thus, this section reviews the various strands of this dynamic relationship among economic growth, air pollution, health outcomes and government expenditure on health.
2.1. Economic performance and air pollution
Kuznets (Citation1955) in an investigation of the empirical connection between income inequality and income per capita propounded the Environmental Kuznets Curve (EKC) theory. It states that the connection between economic growth and air pollution might look like an inverted U, known as the EKC. The hypothesis posits that environmental quality tends to get better as an economy grows, after which the quality peaks and begins a downward spiral. Porter (Citation1991) hypothesis (PH) is another theory that seeks to explain the relationship between economic growth and pollution. Owning the view that regulations designed to protect the environment from business activities will enhance competition, the Porter (Citation1991) hypothesis developed by Michael Porter, one of Harvard’s economist, was particularly quite popular due to its deviation from the old view of environmental regulation held by an economist at the time. Then, economists were of a consensus that compelling businesses to reduce business activities that degrade the environment restricted production options and adversely impacted profits (Ambec, et al., Citation2014). But the PH argument was further flawed when economist expressed that assuming there were indeed profitable avenues for reducing pollution, firms out to maximise profit would have since taken advantage of such opportunities. Osabuohien, Efobi, and Gitau (Citation2014) applied the EKC model to 50 African countries. Using data from 1995 to 2010, the study found a long-term relationship between CO2 and particulate matter (PM) emissions and per capita income. Other factors which include institutional factors and trade were also found to affect sustainable development in an African context. Hanif (Citation2018) found that consumption activities across these economies facilitated by different energy sources led to a rise in the expansion of these countries. However, these expansions began to decline following a peak, confirming the EKC hypothesis in low- and middle-income countries of sub-Saharan Africa. Spatial regression analysis carried out by Zhou et al. (2018) with data obtained from 945 posts in 190 cities in China suggested that economic growth exerts a significant negative impact on PM2.5 absorptions, while factors such as population density, industrial soot emissions, industrial structure and road density have a significant direct impact on PM2.5 absorptions. Also, a Tanzanian study on the same subject matter indicates the presence of a stable long-run connection between energy intake and consumption growth (Odhiambo, Citation2009). These findings prompted the author to conclude that in Tanzania, energy consumption spurs economic growth. An econometric analysis conducted by Wang, Zhou, Wang, Feng, and Hubacek (Citation2017) in 190 cities across China revealed that the relationship between GDP per capita (a measure for economic growth) and PM2.5 concentrations initially increased. The authors, however, noted that the relationship declined thereafter, adding that urban development and structural economic alteration contribute significantly to a rise in urban PM2.5 emission across the country, which if further precipitated could catalyse into spartan air pollution resulting in substantial health risks.
2.2. Air pollution and health outcomes
Aiming to address the implications of air pollution on health performance to policymakers, a WHO 2013 study highlighted cardiovascular and respiratory illness, such as worsening of respiratory symptoms and asthma and an upsurge in hospital admissions as side effects of increasing PM in the atmosphere. The study indicated that there is worthy proof of the impact of short-term exposure to PM10 on respiratory health. The study, however, indicated mortality as a result of long-term contact. It elucidated that PM2.5 is a tougher risk influence than PM10, with death arising from respiratory and cardiovascular diseases as well as from lung cancer. The study projected that about 3% of cardiopulmonary and 5% of lung cancer deaths are attributable to PM universally. Feng, Gao, Liao, Zhou, and Wang (Citation2016) highlighted the generational implication resulting from a prevalent increase in PM2.5. The authors found that absorption of the pollutant into target cells could harm cellular physiological/biochemical developments and result in adverse birth outcomes as well as the growth of diabetes mellitus, cardiopulmonary diseases and so on. In 2015, lower respiratory infections were classified as the most harmful infectious disease, resulting in 3.2 million deaths globally (WHO Factsheet, Citation2017). In cases where death is not recorded, air pollution has led to other health implications like respiratory damage, nasal infection and lung cancer. A review of air pollution and health statistics in Nigeria shows an inverse relationship. Employing the autoregressive distribution lag (ARDL) econometric approach of co-integration, Matthew, Osabohien, Olawande, and Urhie (Citation2019) examined the effect of construction emissions and manufacturing industries on health conditions in Nigeria. The study found a negative association between health conditions and carbon emissions.
2.3. Economic performance and health
Yazdi and Khanalizadeh (Citation2017) studied the Middle East and North Africa region states to determine the effects of economic performance and environmental value on health spending. A co-integration panel was found to exist among all three components. Also, using the ARDL approach, the authors found that income, CO2 and PM 10 have statistically significant direct impact on health spending. Overall, the selected literature infer that environmental exploitation for economic growth is being largely practiced across the globe and has ensured consideration for efficient productivity; however, environmental degradation, particularly air pollution, differs in its effects on health status across economies of the world.
2.4. Growth—pollution theories
Three theories that demystify the sustainability challenges associated with growth and fundamentals that arise from explorative and exploitative activities for growth are highlighted in this section.
The first is the EKC—a hypothesis in the environmental economics literature. It postulates that the association between pollution and economic development takes the shape of an inverted U, known as the EKC. The hypothesis posits that environmental quality tends to get better as an economy grows, after which the quality peaks and begins a downward spiral.
Porter (Citation1991) hypothesis owns the view that regulations designed to protect the environment from business activities will enhance competition. The third theory found in environmental economics literature which was adopted by this study is the circular flow model which demonstrates the link between production and consumption activities of an economy with an inference that proves fundamental decisions that comprise economic activity is directly connected to environmental problems. The circular flow model demonstrates the link between production and consumption activities of an economy.
In the circular flow model of economic growth and air pollution described by Callan and Thomas (Citation2013a), there are two major market structures in the model which comprise the households and the firms. These market structures are, respectively, represented as the consumers and the producers in a circular flow motion through which the supply of factors of production and demand for output describe the process of economic activities. These economic activities and the magnitude of the flow are, however, largely dependent on socio-economic factors such as the population growth, technological advancement, labour productivity, capital accumulation and natural phenomena such as drought or flood.
The model also succinctly illustrates the association between economic activities and the environment. An engagement in consumption and productive acts is known to dwell on the supply of natural resources earth has been blessed with. Both activities, however, generate by-products that can pollute the environment. This means that the essential decisions that comprise economic activities are directly connected to problems that besiege the environment.
3. Research design
3.1. Conceptual framework and model specification
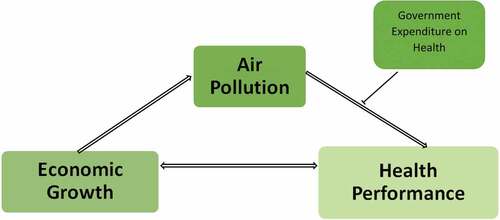
The framework to achieve the objectives of this study which aims to estimate both the direct and indirect effects of economic growth on health, as well as analyse the extent to which public spending on health moderates the impact of air pollution on health, is actualised through the model shown in Figure .
The model examines the relationship between economic growth as it affects Nigeria’s health performance between 1980 and 2017. Economic growth is captured with the use of GDP. The model shows that it has a direct relationship with health performance which this study captured with life expectancy at birth (LEAB). A mediation variable, air pollution which depicts a transmission mechanism wherein economic growth influences health performance indirectly is captured with carbon dioxide (CO2) emissions, while government expenditure on health (GEHTH) serves as a moderating factor for the impact of air pollution on health status.
Figure 1. Conceptual model. Source: Authors’ computation, 2019
The model can be written in its functional form as;
The econometric equation based on the model above can be thus written as;
where: LEAB represents health variable
GDP represents economic growth
CO2EKT represents air pollution variable
GEXHTH represents government expenditure on health
CO2EKT*GEHTH represents the interaction between air pollution and government expenditure and µ represents the error term
α0 is the intercept, and α1, α2, α3 and α4 are the elasticity of the output of economic growth, LEAB, air pollution and government expenditure on health, respectively, while µ represents the error term. The coefficients of the explanatory variables are expected to take the following signs: α0 > 0, α1 > 0, α2 > 0, α3 < 0, α4 > 0. This means that increase in these explanatory variables should be positively linked with the rate of increase in LEAB, safe for air pollution, ceteris paribus.
3.2. Estimation technique
To estimate the formulated model, the study used time series data from 1980 to 2015. A regression path analysis modelling tool for SPSS-PROCESS—developed by Hayes (Citation2017) was used in the estimation procedure. PROCESS helps to conduct observed variable mediation, moderation and conditional process analysis. According to Hayes (Citation2013), it facilitates the outcome of direct and indirect impact in mediation and moderation models. In addition to estimating the coefficients of the model using the ordinary least square regression for continuous outcomes, the analytical software tool developed by Hayes also provides different tools for examining two- and three-way interactions. It aids the construction of percentile-based bootstrap confidence intervals for unconditional and conditional indirect impact.
4. Results
4.1. Relationship among economic growth, air pollution, health and government expenditure
4.1.1. Trend analysis of economic growth and air pollution in Nigeria
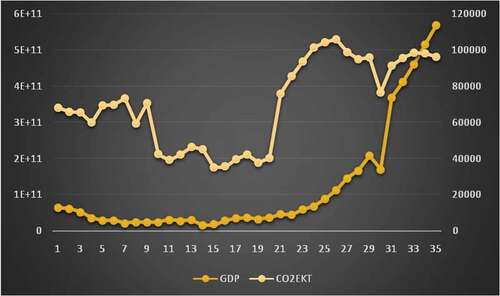
Based on available data, the connection between economic performance (GDP) and air pollution (CO2) in Nigeria is seen to be positive as shown in Figure . The graph illustrates that when GDP improves, air pollution increases, and when GDP records a decline, a decrease in the volume of air pollution is seen.
Figure 2. Comparative analysis between economic growth and air pollution in Nigeria. Source: Authors’ Computation, 2019
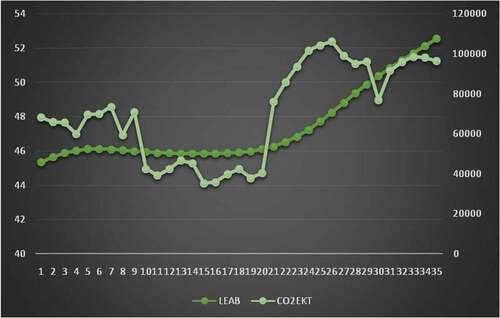
4.1.2. Trend analysis of air pollution and health performance in Nigeria
Figure 3. Comparative analysis between health performance and air pollution in Nigeria. Source: Authors’ Computation, 2019
4.1.3. Trend analysis between economic output and health performance
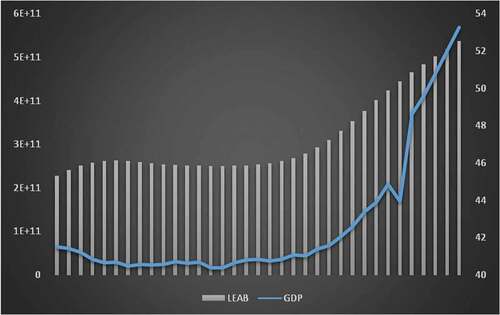
Figure describes Nigeria’s trend of performance in health standard and economic growth. This relationship was captured by Nigeria’s LEAB and economic growth (GDP) data sourced from the world development indicators compiled by the World Bank (Citation2018) over a 35-year period. It shows that economic growth has a positive relationship with Nigeria’s economic growth over the reviewed period.
Figure 4. Comparative analysis between health performance and economic growth in Nigeria. Source: Authors’ computation, 2019
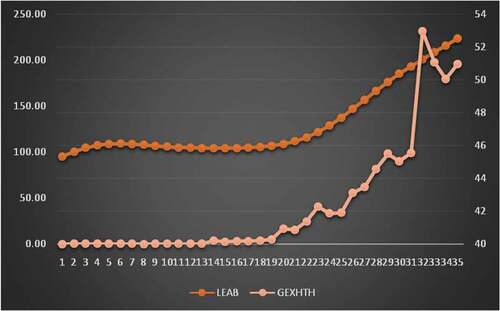
4.1.4. Trend analysis of government expenditure on health and health performance in Nigeria
Despite the notable improvement in the LEAB from 45 years in 1980 to 53 years in 2017, the average expected livelihood of a Nigerian citizen is still pegged at a low of 47.6 years (see Figure ). Its relationship with government expenditure on health which peaks in 2015 with N257.7 billion allocated for health expense is balanced, except for the 2015 development, which came on the heels of an Ebola outbreak that shook the core of the country, after which funds for health began to dwindle.
Figure 5. Comparative analysis between health performance and government expenditure on health in Nigeria. Source: Authors’ computation, 2019
4.2. Path-based moderated mediation analysis
The results and analysis of data collated from the World Bank to achieve the earlier stated objectives were evaluated with a computational tool for path analysis-based mediation and moderation analysis referred to as PROCESS. The study also presented the data in charts and explained findings with percentages and mean scores. In estimating the model formulated in Figure , the study used time series data from 1980 to 2017. PROCESS software was used in the estimation.
The descriptive analytical results presented in Table show that despite notable improvement in the LEAB from 45 years in 1980 to 53 years in 2017, the average expected livelihood of a Nigerian citizen is still pegged at a low of 47.6 years. Carbon dioxide emissions in the country have also been described to have hit an all-time high of 0.928 in the early 1980s after which it trended downwards to 0.325 (the lowest in 1998). However, recent statistics shows that emissions are re-gathering momentum with 2017 figures pegged at 0.546. Government expenditure on health is seen to be at the peak in 2015 with N257.7 billion allocated for health expense; ironically, this development came on the heels of an Ebola outbreak that shook the core of the country, after which funds for health began to dwindle.
Table 1. Descriptive analysis
The model outcome of air pollution variable represented by carbon dioxide emissions (CO2EKT) in Table showed that it holds a positive and significant relationship with economic growth. Thus, as economic growth rises in Nigeria, air pollution increases significantly. Table shows the summary of the moderation analysis carried out on the model. It revealed an R-squared value of 0.9683 and adjusted R-squared value of 0.9375, expressing that the model has a goodness of fit on the estimation. The adjusted R-squared value of 0.9375 reveals that approximately 94% of the systematic variations in the dependent variable (LEAB) are explained by changes in the independent variables (carbon emissions and GDP per capita). This indicates that the model’s explanatory power is high. The F-statistic value of 155.05 is also rationally high. The combination of independent variables is also found to be suitable in explaining the variations in Nigeria’s health status in the short term. Thus, the explanatory variables have a joint effect on the dependent or explained variable.
Table 2. Model outcome variable (ZCO2EKT)
Table 3. Moderation analysis model summary {Outcome variable (ZLEAB)}
The explanatory variables in the outcome model presented in Table conformed to a priori expectations. The constant term which represents the regression line estimate showed a positive intercept, implying that, other things being held constant, the explained variable, which is LEAB, has a positive value of 0.2922 units. The negative sign of the coefficient of carbon dioxide emissions (CO2EKT) shows the presence of a negative relationship between air pollution and LEAB, implying that a unit increase in carbon dioxide emissions will result in 0.1050-unit depreciation in life expectancy, with other factors remaining same. Government expenditure on health has a significantly positive relationship with LEAB, depicting that a unit increase in government expenditure on health will raise health performance by 1.34 units. The interaction term (Int_1) which captures the moderation effect on the model shows a significant relationship with LEAB. The results also show a negative relationship with health performance in Nigeria. This implies that health performance in Nigeria is significantly worsened as a result of air pollution as well as other factors amidst expenses allocated for the provision of health-care facilities.
Table 4. Model outcome variable (ZLEAB)
5. Discussion
The central argument of this paper is that the full impact of the development effect of economic growth, that is, health improvement, is hampered by an inevitable adverse consequence (air pollution) of economic growth itself. In addition, the full effect of air pollution on health performance could be moderated by the level of government spending/policy on health.
The result shows a positive and significant relationship between economic growth and air pollution in Nigeria. This confirms the first stage of the EKC (Citation1955), which hypothesized that economic development initially leads to a deterioration in the environment. It is also in line with Osabuohien et al. (Citation2014) and Zhou et al. (Citation2018). As expected, the result shows an inverse relationship between air pollution and health performance in Nigeria. This supports both Feng et al. (Citation2016) and Osabuohien et al. (Citation2019). Although government health expenditure was found to have a positive effect on health performance, this was not strong enough to neutralize the adverse effect of air pollution. Thus, the Federal Government of Nigeria still needs to pay more attention to the health sector in terms of allocating more resources for preventive interventions. Better enforcement of existing air pollution policies should be promoted. A notable case is the Vehicular Emission Law initiated by the national Environmental Regulation and Enforcement Agency (NESREA). Aside from complying with existing environmental laws, other environment-friendly mode of production laws should be initiated. An example is the ban on the use of polyethylene or plastic wrappers. Many eco-friendly countries have made the use of cellophane bags compulsory for certain goods. It should be noted that while cellophane is derived from natural sources such as wood, polyethylene/plastic wrap is made from petroleum product. Unlike plastic, cellophane cannot be recycled, but it is biodegradable, so it can be composted or sent to a landfill in the regular garbage. The environmental challenges (such as health issues) caused by plastic waste that is not well managed are also avoided. These steps will lead the country towards achieving the third sustainable development goal (SDG-3) geared towards guaranteeing healthy lives and enhancing well-being for everyone at all ages. It will also compliment efforts towards attaining goal 11 of the SDGs, which hinges on sustainable cities and communities.
6. Conclusion and recommendations
This study has shown that economic growth has an influence on the health status of Nigerians via air pollution, and there is a degree of moderation facilitated by public expenditure on health. The indirect conditional effect analysis of the model output also showed that to an extent, health expenditure has no significant effect on air pollution. However, with low levels of expenditure on health, the relationship between air pollution and health status in Nigeria continues to wax stronger. Consequently, efforts by the government to ensure environmentally friendly production and consumption will minimize air pollution and prevent adverse health outcomes. Also, the government should put measures in place to reduce carbon emissions since there is a negative relationship between air pollution and life expectancy; the higher the air pollution, the lower the life expectancy would be. Manufacturing firms that emit poisonous gases into the air should be sanctioned. This will serve as a deterrent to others.
Acknowledgements
The authors appreciate the financial support of Covenant University Centre for Research, Innovation and Discovery (CUCRID) for the publication of this paper.
Additional information
Funding
Notes on contributors
Ese Urhie
The authors are seasoned academics who have conducted numerous researches in the field of economic development. Recent studies conducted in the area of sustainable development include food security, institutional framework and technology: Examining nexus in Nigeria using ARDL (2018); Osabuohien, E., Obiekwe, E., Urhie, E., Osabohien, R. 2018. Inflation rate, exchange rate volatility and exchange rate pass through interactions: The Nigerian experience (2018); Manufacturing industries and construction emissions in Nigeria: Examining the effects on health conditions (2019); electricity consumption, government expenditure and sustainable development in Nigeria: A co-integration approach (2019); Agriculture as a stimulant for sustainable development in ECOWAS, Sustainability (2019); and economic growth, energy consumption and human capital formation: Implication for knowledge-based economy (2019).
Related Research Data
References
- Ambec, S., Garapin, A., Muller, L., Reynaud, A., & Sebi, C. (2014). Comparing regulations to protect the commons: An experimental investigation. Environmental and Resource Economics, 58(2), 219–14.
- Callan, S. J., & Thomas, J. M. (2013a). Environmental economics and management. Theory policy and applications. United Kingdom: Cengage Learning.
- Callan, S. J., & Thomas, J. M. (2013b). Environmental economics and management: Theory, policy, and applications. UK: Cengage Learning.
- Chigbo, K. (2011). The unheard cry of the Igbo people: A study of meaning in life in the meta-psychology of Abraham Joshua Heschel. Lagos: Xlibris Corporation.
- Dhanya, J. (2015). The impact of savings in economic growth: An empirical study based on Botswana. International Journal of Research in Business Studies and Management, 2(9), 10–21.
- Feng, S., Gao, D., Liao, F., Zhou, F., & Wang, X. (2016). The health effects of ambient PM 2.5 and potential mechanisms. Ecotoxicology and Environmental Safety., 128, 67–74. doi:10.1016/j.ecoenv.2016.01.030
- Hanif, I. (2018). Impact of economic growth, non-renewable and renewable energy consumption and urbanisation on carbon emissions in sub-Saharan Africa. Environmental Science and Pollution Research, 4(2), 20–31.
- Hayes, A. F. (2013). An index and test of linear moderated mediation. Multivariate Behavioral Research, 10(3), 13–25.
- Hayes, A. F. (2017). Introduction to mediation, moderation, and conditional process analysis: A regression-based approach. United Kingdom: Guilford Publications.
- Kuznets, S. (1955). Economic growth and income inequality. American Economic Review, 45(1), 1–28.
- Matthew, O., Osabohien, R., Olawande, T., & Urhie, E. (2019). Manufacturing industries and construction emissions in Nigeria: Examining the effects on health conditions. International Journal of Civil Engineering and Technology, 10(1), 2401–2414.
- Matthew, O. A., Miebaka-Ogan, T., Popoola, O., Olawande, T., Osabohien, R., Urhie, E., … Ogunbiyi, T. (2019). Electricity consumption, government expenditure and sustainable development in Nigeria: A co-integration approach. International Journal of Energy Economics and Policy, International Journal of Energy Economics and Policy, 9(4), 74–80. doi:10.32479/ijeep
- Nwankwo, O. C. (2013). The effect of electricity supply on industrial production within the Nigerian economy (1970–2010). Journal of Energy Technologies and Policy, 3(4), 22–35.
- Odhiambo, N. M. (2009). Energy consumption and economic growth in Tanzania: An ARDL bounds testing approach. Energy Policy, 37, 617–622. doi:10.1016/j.enpol.2008.09.077
- Osabuohien, E. S., Efobi, U. R., & Gitau, C. M. W. (2014). Beyond the environmental kuznets curve in Africa: Evidence from panel cointegration. Journal of Environmental Policy & Planning. Journal of Environmental Policy & Planning, 16, 517–538. doi:10.1080/1523908X.2013.867802
- Osabuohien, E. S., Efobi, U. R., Herrmann, R. T., & Gitau, C.M. (2019). Female labor outcomes and large-scale agricultural land investments: Macro-micro evidence from Tanzania. Land Use Policy, 82, 716–728.
- Porter, M. (1991). America’s green strategy. Scientific American, 264(4), 168. doi:10.1038/scientificamerican0491-168
- United Nations. (2016). Peace and security: From collective security to the responsibility to protect. United Kingdom: Cambridge University Press.
- Urhie, E., Odebiyi, J., & Popoola, R. (2017). Economic growth, air pollution standards enforcement and employment generation nexus in the Nigerian context. International Journal of Innovative Research and Development, 6(5), 10–24. doi:10.24940/ijird/2017/v6/i5/APR17074
- Wang, S., Zhou, C., Wang, Z., Feng, K., & Hubacek, K. (2017). The characteristics and drivers of fine particulate matter (PM2.5) distribution in China. Journal of Cleaner Production, 142, 1800–1809. doi:10.1016/j.jclepro.2016.11.104
- World Bank. (2014). Responding to global public bads: Learning from evaluation of the World Bank experience with Avian influenza, 2006–2013. Washington, DC: Author. Retrieved from https://ieg.worldbankgroup.org/Data/reports/avian_flu1.pdf
- World Bank. (2018). operational framework for strengthening human, animal, and environmental public health systems at their interface. Retrieved from http://documents.worldbank.org/curated/en/961101524657708673/pdf/122980-REVISED-PUBLIC- World- Bank-One-Health-Framework-2018.pdf
- World Development Indicators, WDI. (2018). Death rate, crude (per 1,000 people) World Bank data. Retrieved from https://data.worldbank.org/indicator/sp.dyn.cdrt.in
- World Health Organisation. (2013). Mortality from ischaemic heart disease by country, region, and age: statistics from World Health Organisation and United Nations. International Journal of cardiology, 168(2), 934–945.
- World Health Organisation. (2016). World health statistics 2016: Monitoring health for the SDGs sustainable development goals. Washington: World Health Organization.
- World Health Organization. (2018). International union against sexually transmitted infections (IUSTI) World Health Organisation (WHO) guideline on the management of vaginal discharge. International Journal of STD & AIDS, 29(13), 1258–1272.
- World Health Organization. (2017). Cancer fact sheet 2017. Switzerland: World Health Organization
- Yazdi, S. K., & Khanalizadeh, B. (2017). Air pollution, economic growth and health care expenditure. Economic Research-Ekonomska Istrazivanja, 30(1), 1181–1190. doi:10.1080/1331677X.2017.1314823
- Zaidi, S., & Saidi, K. (2018). Environmental pollution, health expenditure and economic growth and in the sub-Saharan Africa countries: Panel ARDL approach. Sustainable Cities and Society, 41, 833–840 doi:10.1016/j.scs.2018.04.034
- Zhang, T., Chiu, Y., Li, Y., & Lin, T. (2018). Air pollutant and health efficiency evaluation based on a dynamic network data envelopment analysis. International Journal of Environmental Research and Public Health, 15(2046;). doi:10.3390/ijerph15092046
- Zhou, X., Zhang, X., Lin, M., & Sun, J. (2018). Shufflenet: An extremely efficient convolutional neural network for mobile devices. In Proceedings of The IEEE Conference on Computer Vision and Pattern Recognition (pp. 6848–6856).