
Abstract
We undertake a study to determine and assess the effects of the statistically significant predictors of the behaviors and notions that are associated with a cancer diagnosis using the 2014 Health Information National Trends Survey (HINTS) data. We implemented a new and extensive logistic regression modeling using stepwise variable selection and jackknife parameter estimation that identified the best explanatory model. Our results show that age, average time spent watching TV or playing games, usage of sunscreen, fruit intake intent, and the opinion-based variables for behaviors affecting high blood pressure, as well as the participant preference of not knowing the chance of getting cancer are the optimal set of covariates impacting the chance of getting cancer. Moreover, using more sunscreen, and a higher age was associated with increases in the chances of getting cancer. Interestingly, many usually important background covariates such as race, income, gender, geographical location, and others were not significant predictors of the outcome variable of interest. The conclusions of our analysis reveal new insights in the complexity of the behaviors and “attitudes” associated with a higher chance of a cancer diagnosis and will undoubtedly have important implications on the design and success of future healthcare messages and campaigns.
PUBLIC INTEREST STATEMENT
Our study aims at assessing the effects of the predictors of the behaviors and notions that are associated with a cancer diagnosis. Our results show that age, average time spent watching TV or playing games, usage of sunscreen, fruit intake intent, and the opinion-based variables for behaviors affecting high blood pressure, as well as the participant preference of not knowing the chance of getting cancer are the optimal predictors impacting the chance of getting cancer. Interestingly, many usually important background covariates (race, income, gender, geographical location, and others) were not significant predictors of having had a cancer diagnosis. The conclusions of our analysis reveal new insights in the complexity of the behaviors and “attitudes” associated with a higher chance of a cancer diagnosis and will undoubtedly have important implications on the design and success of future healthcare messages and campaigns.
1. Introduction
A cancer diagnosis is arguably one of the most dreaded diagnoses of our time. An individual diagnosed with cancer may feel as if he or she is always with cancer, that every conversation, thought, or action is altered by this new state of being as a cancer patient (Sparks, Citation2003a, Sparks, Citation2013; Sparks & Leahy, Citation2018). Patients often report feeling their healthcare providers tend to speak in ways that are often difficult to understand, full of medical terms, with talk full of acronyms for chemotherapy combinations and odd treatments. The patient and family members often find their way through the maze of sorting through what cancer staging and tumor marker levels mean for decisions about treatment and for their day-to-day lives. They may struggle to disentangle risks, benefits, and side effects of different treatments. They may also figure out which pros and cons are most important to their decisions about the next steps and their own lives as well as which benefits and risks the oncologist emphasizes. Often, the patient or family member may not know how to put fears and confusions into words and may not know what kinds of questions will get the answers that are most needed (Sparks & Leahy, Citation2018). Research consistently reveals that a deeper knowledge of communication processes helps a person negotiate this difficult time, and often offers ways to exert some control in an overwhelming situation, and leads to better health outcomes for the individual (see e.g. Sparks, Citation2003a, Sparks, Citation2013; Sparks & Leahy, Citation2018). Scholars in health communication recognize that information about type and stage of cancer and treatment options is like a list of ingredients in a recipe for a meal they’ve never had before. The ingredients are necessary to have, of course, but without instructions for what to do with them, the patient and caregivers may still feel lost as to how to move from one step to the next. As Sparks and Leahy (Citation2018) explain, communication serves a crucial role in helping an individual put the informational ingredients together while deciding whether to stir or to blend, as well as which substitutions can be made without messing up the result, what temperature works best, and how to tell when enough is enough. Many patients, providers, and caregivers may not realize they can improve healthcare communication among each other and may not realize how much that improvement can matter to a patient’s sense of well-being and one’s healthcare outcomes. Many involved in these difficult and complicated decisions have not given much thought to the confusing world of cancer and related decision-making until they are presented with the disease in some way.
Communication scholars and researchers are becoming increasingly interested in the health information seeking and various behavioral patterns of cancer patients (Czaja, Manfredi, & Price, Citation2003; Echlin & Rees, Citation2002, Leydon, Boulton, Moynihan, Jones, Mossman, Boudioni, & McPherson, Citation2000; Pecchioni & Sparks, Citation2007; Robinson & Turner, Citation2003). Cancer information seeking is of particular interest because of the pervasiveness of the disease, the alarming number of types, the duration of the illness, and the enormous variety of treatment options available. Furthermore, “the process through which a patient actively learns about his or her disease and treatment, plays a pivotal role in how individuals successfully manage their own health care” (Turk-Charles, Meyerowitz, & Gatz, Citation1997, p. 85). Cancer patients need to become informed on the many issues related to their disease in order to make informed decisions about their choice of doctor, treatment plan, and aftercare.
Research on health information seeking shows that patients often desire more information about their illness, treatment options, and side effects of treatments, and that they often want more healthcare information and research literature, to supplement the information provided during the office consultation (Pecchioni & Sparks; Rakovski et al., Citation2012).
Educating patients or possible cancer patients is the best way to insure informed decisions and begin patient involvement in healthier practices that can have a protective or restorative effect on their health. Starting the education process and support outreach as early as possible will give the best chances to the patients to begin a healthier, more informed lifestyle (Waldie & Smylie, Citation2012). In Moldovan-Johnson, Martinez, Lewis, Freres, and Hornik (Citation2014) it is shown that cancer patients will increase their fruit and vegetable intake. This is due to either trying to gain the protective benefits regarding cancer from eating more fruit and vegetables or to reduce the risk of secondary conditions, including such conditions as heart disease or higher blood pressure. These results also indicated that many patients showed that, in addition to engagement with their healthcare provider, they were searching for information from non-medical sources. It can be assumed that they were searching for information to increase their chances of survival and to lower the risk of cancer diagnoses.
The purpose of this study is to obtain the best explanatory model for the outcome variable of interest denoting the presence and absence of cancer diagnosis. Specifically, this study aims to determine and assess the effects of the statistically significant predictors of the behaviors and “notions” that are associated with a cancer diagnosis using the 2014 Health Information National Trends Survey (HINTS) data. As such, we implemented an extensive logistic regression modeling using stepwise variable selection and jackknife parameter estimation that identified the best explanatory model.
2. Data
HINTS was developed by the Health Communication and Informatics Research Branch (HCIRB) of the Division of Cancer Control and Population Sciences (DCCPS) at the National Cancer Institute. HINTS uses a nationally representative sample to investigate how the American public uses and searches for cancer information. The collection process of the HINTS IV data set was started and completed in 2014 (Kreps & Sparks, Citation2015a). There are nearly 270 items that were asked of the participants in the 2014 HINTS, all of which were included in the analysis as possible predictors.
Analyzing the 3,677 weighted responses regarding their racial background illustrated that 60.8% considered themselves as Non-Hispanic White, 10.3% reported their race/ethnicity as Non-Hispanic Black, 13.8% consider themselves to be Hispanic and 4.4% Non-Hispanic Asian while 1.9% provided a non-illuminating answer. Roughly 51% of the respondents were designated as female. The responses regarding the census region (Region) disclose that Northeast, Midwest, South, and West regions were represented in the data by 18.2%, 21.5%, 37.1%, and 23.1% of the participants, respectively. The average age of participants in the study was 45.7 years with standard deviation of 16.9 years; the age group with the highest frequency was 18–34 years of age accounting for 29.6% of the population followed by 35–49 and 50–65 age groups accounting for 25.7% and 24.2% of the population, respectively. The most common response in marital status (HD06 Marital Status) was “Married”, making up 51.8%, followed by “Single”, “Divorced”, and “Widowed” with 27.7%, 7.4%, and 5.5% respectively. The educational background (HD07 Education) variable revealed that 14.3% attained a post-graduate degree, 24.6% of the responders earned an undergraduate college degree, 21.9% attended college but failed to obtain a degree, 17.6% completed high school, and 11.3% did not complete high school. Moving on, the income response of the survey participants shows that 7.3% make less than $10,000, 24.8% earn between $20,000 and $50,000, 28.1% make between $50,000 and $100,000, 14.4% earn between $100,000 and $200,000, and 5.3% make over $200,000 per year. Additional details for the distributions of these general background variables are shown in Table . Note that some respondents either failed to respond or responded in error, but these options are not shown in the tables below, this is why categories will not add up to exactly 100%.
Table 1. General background characteristics of the survey responders (N = 3,677)
Furthermore, 8.5% of the participants affirmed that they had received a cancer diagnosis in their lifetime. The self-assessed health-related question (HD01 General Health) had possible responses poor, fair, good, very good, and excellent. The distribution of the answers was 2%, 10.7%, 38%, 34.3%, and 12.7% respectively. The opinion-based question regarding the effects of habits and behaviors on high blood pressure is a unidirectional 4-level scale (1,2,3,4) where an increase in value indicates a stronger belief in the question (starting with no belief and increasing to strongly agreeing). Those who reported that they didn’t believe habits and behaviors affected high blood pressure made up 2.3% of the weighted population, 5.6% reported that they “a little” believed there was an impact, 24.6% “somewhat” believe there is a relationship, and 64.3% believe “a lot” that behaviors and habits can affect high blood pressure. The variable Sunscreen is also a unidirectional record of how often a person will wear sunscreen if they are going to be outside on a warm, sunny day. Those who said that they will “Never”, “Rarely”, or “Sometimes” use sunscreen were 27.1, 18.9, 21.4%, respectively, while 15.7% said they “Often” used sunscreen and 12.7% said they “Always” do. Finally, 2.4% said they avoid going outdoors if it is a sunny warm day. The variable Fruit Intent tracked the intent a participant had regarding how much fruit they eat. Among the participants, 32.3% said that they wanted to eat more fruit or drink more fruit juice, whereas the rest either said that they merely wanted to maintain how much fruit they eat, or didn’t keep track of their fruit/fruit juice consumption. Average Daily TV Games recorded the number of hours, on average, participants said they watched TV or played computer games per day over the last 30 days. Only 2% responded 0 hours, 37.3% said 1–2 hours a day, 32.9% said 3–4 hours on average a day, 13.2% for 5–6 hours a day, and the remaining ~8.6% covered 8–24 hours a day (albeit with very low percentages for 9 hours a day and over). The final variable records the level of agreement with the statement, “I would rather not know my chances of getting cancer.” Here, 10.1% strongly agreed, 20.3% somewhat agree, and 27.9% and 39.3% somewhat disagreed and strongly disagreed, respectively.
We implemented multiple data manipulation steps and techniques that included various ways of recoding categorical variables to ensure the unidirectional effects of the covariates in order to allow our model building process to have the means to measure levels of effect.
Very low response rate (<10) and non-informative categories such as: “Refused to Answer” and “Don’t Know” were removed from dataset and their corresponding statistical weights were uniformly distributed among the remaining subjects in the data. It is because of this reason that the percentage for each question will not add up to exactly 100%.
3. Statistical analysis
HINTS IV utilized the data collection method of list-assisted random digit dialing (RDD) as well as mail-in questionnaire with a natural corresponding unstratified and cluster sampling design that also made use of jackknife replicates (Cantor et al., Citation2009). Using generalized logistic models with jackknife parameter estimation, the survey data set was analyzed based on the complete and 50 jackknife replicate datasets. Due to their ability to generally provide unbiased parameter estimates, the resampling-based analytic approaches, such as the jackknife and bootstrap, are the preferred methods for complex survey data analyses (Shao, Citation1996; Wu, Citation1986). All of the computations performed in this study were carried out using the Survey package version 3.33 (Lumley, Citation2017) of the R statistical software platform (version 3.4.2, http://www.r-project.org). We executed an extensive search through all relevant potential explanatory variables for having received a cancer diagnosis applying a model building process based on automatic forward selection combined with backward elimination of covariates to develop the best explanatory model, combined along with the model building approach Step AIC. This approach to detecting and assessing the effect sizes of the significant explanatory variables of the aforesaid outcome of interest is data-driven and model-based. It is a greatly advantageous alternative to the common hypotheses-based analyses. The best explanatory model and the corresponding unbiased effects of the predictive variables are suspect to being questioned unless the model building process encompasses all possible potential confounders and risk factors. This, at the very least, implies considering and testing all survey items for association with the outcome variable. Currently, studies based on hypotheses are defined in terms of existence of either positive or negative correlations between the outcome variable of interest and select candidate covariates. These hypotheses are tested by either correlation analyses or unadjusted statistical models, both of which are susceptible to bias in the estimated effects due to unaccounted confounding. In extreme cases, such naive approaches can lead to reverse association directions and false positive, or false negative, effect findings (Min & Agresti, Citation2002).
4. Results
The extensive model-based and data-driven study revealed that age, application of sun protection, the belief that habits and behaviors can affect high blood pressure, your intention of fruit intake, the average number of hours spent daily watching TV or playing video games, and the level of agreeing with the statement that you would rather not know your chance of getting a cancer diagnosis were the only covariates significantly associated with receiving a cancer diagnosis. Detailed outputs from the logistic regression model that describe all the relevant associations are shown in Table .
Table 2. Health-related background characteristics of the survey responders (N = 3,677)
Table 3. Summary results from the best explanatory logistic regression model
As illustrated in Table , age was a significant predictor of the outcome variable of interest (p-value < 0.001) with an estimated effect of 0.06. Therefore, after controlling simultaneously for all other covariates in the model, a one-year increase in age was associated with a 6% increase in the odds of having had a cancer diagnosis. Similarly, sun protection (p-value < 0.0001) is a significant predictor of the outcome variable of interest with an estimated effect of 0.21. Therefore, one-category increase in the degree of sunscreen usage was associated with a 23% increase in the odds of having had a cancer diagnosis (after exponentiating the estimate). The variable regarding how behaviors impact high blood pressure (p-value 0.004) has an estimated effect of −0.26. Therefore, one-category increase in the degree of belief that behavior has an impact on high blood pressure was associated with a 23% decrease in the odds of having had a cancer diagnosis. Fruit intention (p-value 0.026) has an estimated effect of 0.42. Therefore, one-category increase (as defined in the variable description in Table ) was associated with a 48% increase in the odds of having had a cancer diagnosis. The variable regarding one’s agreement with the statement that you would rather not know your chance of diagnosis was a significant predictor of the outcome variable of interest (p-value 0.005) with estimated effect sizes of −0.27. Indicating that one-category increase in agreeing with the statement that you would not like to know the chance of getting cancer was associated with a 24% decrease in the odds of having had cancer. Average daily TV and video games was a significant predictor of the outcome variable of interest (p-value 0.022) with estimated effect sizes of 0.06. Demonstrating that one-category increase in how many hours on average you watched TV or played video games was associated with a 6% increase in the odds of having had cancer.
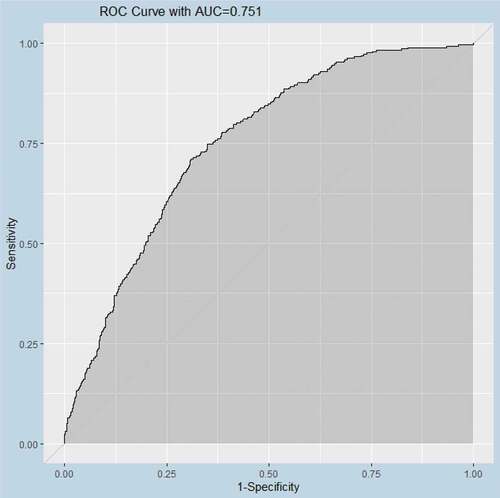
Lastly, the model attained an area under the AUC curve of 0.751-indication high classification accuracy for a study of human behavior. Details are shown in Figure .
Figure 1. Area under the Roc Curve
5. Discussion
The intention of this study was to investigate the differences in the behavioral characteristics that differ between people that had and did not have cancer diagnoses. The impact of a cancer diagnosis is one that can greatly affect a person and place a strain on them as well as their friends and family. A better understanding of how this can affect people can more accurately educate healthcare professionals on what to address and make more clear for their patients. This would make the entire process more open and accessible for most patients, which could in turn better prepare them for what to expect, what certain originally unknown terms, phrases, and acronyms actually mean, and how to better handle and address their condition and treatment. This is paramount, as a positive mindset is one of the best techniques in helping patients through treatments. As a result, this will help dispel any fear and clear up confusions. It could also potentially assist healthcare professionals in new aspects of what to be aware of as signs for possible cancer indicators.
In this study, we analyzed the 2014 Hints data set (Cycle 4) which tracks the trends of public opinions regarding health and healthcare organizations. This data set is a survey of over 3600 people who were collectively chosen to be representative of the entire US population. The data required extensive pre-processing due to missing variable issues and collinearity. We designed and implemented a novel method of analysis that combined automatic variable selection and logistic regression modeling that incorporated sampling weights and jackknife replicate weights. The novel approach identified the best explanatory model that included new variables that provide valuable insight into the behavioral differences between people with and without cancer diagnosis. In particular, the best explanatory model included six variables, how often sunscreen is used on sunny days, how strongly an individual believes that behaviors and lifestyle can affect a diagnosis of high blood pressure, the average daily time spent watching TV or playing video games, how strongly a participant agrees with the statement of their rather not knowing their chance of getting cancer, participants intention regarding fruit consumption, and age.
The direction of the effects of some of these variables seems to be somewhat counterintuitive and we provide possible explanations as to why they are actually disadvantageous or protective. For instance, one would assume sunscreen usage could be a preventative measure to protect health and maintain skin well-being. However, it could hint that the participant feels there is a reason they need to be extra careful due to family medical history. In Moloney, Almarzouqi, O’Kelly, Conlon, and Murphy (Citation2005), it was stated that patients who received transplants, mentioning renal or skin grafts, had an increased chance of skin cancer. This is most likely due to being on immunosuppressants, as well as having poor sun protection habits. It is possible that improper use of sunscreen could also incorrectly make it appear that sunscreen leads to a cancer diagnosis, as in Wright, Wright, and Wagner (Citation2001). As expected, the belief that one’s lifestyle is affecting their diagnosis of having high blood pressure shows a lower chance of having had a cancer diagnosis. This could potentially be illustrating that the more educated and knowledgeable a person is regarding health, the more capable they are to properly care for themselves and make better choices. Participants agreeing more strongly with the statement that they would rather not know their chances of getting cancer were less likely to have had a cancer diagnosis. This lack of awareness is less prominent among cancer survivors as they realize the benefits of risk assessment and early intervention. Further, stronger intention to consume fruit or fruit juice was associated with having had a cancer diagnosis. This could signify that the participants wanted to adopt a healthier lifestyle for some specific reason and were conscious of their diet. Also, a larger number of hours a participant spent watching TV or playing video games a day were associated with having had a cancer diagnosis. Finally, as this result is well known, age is the most commonly identified risk factor for having had a cancer diagnosis.
It should be noted that certain variables which were highly expected to be predictors were not selected in the final model. There could be possible reasons why this is the case. All smoking variables were left out of the model despite it being well known that smoking and cancer have a strong connection. However, our outcome variable asks whether a participant has ever had cancer of any kind. This means that cancers with higher prevalence in the data may not have a connection to smoking. Cancers such as skin cancer, bladder cancer, and prostate cancer would outweigh lung cancer and therefore cause smoking to not be selected for the model. This is supported by the fact that smoking variables were forced into the model, but these variables were not significant in the final model. Other health variables could have been skewed by response bias in regard to participants knowingly or unknowingly responding with false information, or indeed not responding at all. Despite the information being anonymous, participants could have answered health-based questions with less accuracy or even unknowingly answered incorrectly due to lack of knowledge.
Our results provide new knowledge that can assist healthcare professionals and patients with respect to concerns and lifestyle changes after cancer diagnosis.
Acknowledgments
We thank Alex Barrett, Sidy Danioko, and Louis Ehwerhemuepha for their valuable comments.
Additional information
Funding
Notes on contributors
Kyle Anderson
Our groups research covers health communication, cancer, arrythmia and heart disease classification, and hospital readmissions. Our aim is to better understand and assess the predictors of certain health conditions, how patients react to a diagnosis, how to better help patients and their families cope with a diagnosis, and how to better educate people to prevent or monitor conditions and diseases. This research will assist in improving policy and dispersion of health information for patients with a cancer diagnosis to better address concerns and fear of a diagnosis. This can be extended to improving educational policy for all illnesses to improve accessibility to patients, as well as to better inform the general public.
References
- Cantor, D., Coa, K., Crystal-Mansour, S., Davis, T., Dipko, S., & Sigman, R. (2009). Health information national trends survey (hints). Rockville, MD: Westat.
- Czaja, R., Manfredi, C., & Price, J. (2003). The determinants and consequences of information seeking among cancer patients. J Health Commun, 8(6), 529–562.
- Echlin, K. N., & Rees, C. E. (2002). Information needs and information-seeking behaviors of men with prostate cancer and their partners: A review of the literature. Cancer Nursing, 25, 35–11. doi:10.1097/00002820-200202000-00008
- Kreps, G. L., & Sparks, L. (2015a). The national cancer institute. In G. A. Colditz (Ed.), The encyclopedia of cancer and society (2nd ed., pp. 798–803). Newbury Park, CA: Sage.
- Kreps, G. L., & Sparks, L. (2015b). Cancer communication. In G. A. Colditz (Ed.), The encyclopedia of cancer and society (2nd ed., pp. 220–225). Newbury Park, CA: Sage.
- Leydon, G. M., Boulton, M., Moynihan, C., Jones, A., Mossman, J., Boudioni, M., & Mc Pherson, K. (2000). Cancer patients’ seeking information seeking behaviour: In depth interview study. BMJ, 320(7239), 9.
- Lumley, T., & Scott, A. (2017). Fitting regression models to survey data. Statistical Science, 32(2), 265–278.
- Min, Y., & Agresti, A. (2002). Modeling nonnegative data with clumping at zero: A survey. Journal of the Iranian Statistical Society, 1(1), 7–33.
- Moldovan-Johnson, M., Martinez, L., Lewis, N., Freres, D., & Hornik, R. C. (2014). The role of patient–clinician information engagement and information seeking from nonmedical channels in fruit and vegetable intake among cancer patients. Journal of Health Communication, 19(12), 1359–1376. doi:10.1080/10810730.2014.906521
- Moloney, F. J., Almarzouqi, E., O’Kelly, P., Conlon, P., & Murphy, G. M. (2005). Sunscreen use before and after transplantation and assessment of risk factors associated with skin cancer development in renal transplant recipients. Arch Dermatol, 141(8), 978–982. doi:10.1001/archderm.141.8.978
- Pecchioni, L., & Sparks, L. (2007). Health information sources of individuals with cancer and their family members. Health Communication, 21, 143–151. doi:10.1080/10410230701307162
- Rakovski, C., Sparks, L., Robinson, J. D., Kee, K., Bevan, J., & Agne, R. (2012). A regression-based study using jackknife replicates of HINTS III data: Predictors of the efficacy of health information seeking. Journal of Communication in Healthcare, 5(3), 163–170. doi:10.1179/1753807612Y.0000000014
- Robinson, J., & Turner, J. (2003). Impersonal, interpersonal, and hyper-personal social: Cancer and older adults. Health Communication, 15, 227–234. doi:10.1207/S15327027HC1502_10
- Shao, J. (1996). Bootstrap model selection. Journal of the American Statistical Association, 91(434), 655–665.
- Sparks, L. (Ed.). (2003a). Cancer communication and aging [Special Issue]. Health Communication, 15, 2.
- Sparks, L. (2003b). An introduction to cancer communication and aging: Theoretical and research insights. Health Communication, 15, 123–132. doi:10.1207/S15327027HC1502_1
- Sparks, L. (2013). Health communication and caregiving research, policy, and practice. In Talley R., & Travis S. (eds), Multidisciplinary Coordinated Caregiving (pp. 131–175). Caregiving: Research, Practice, Policy. New York, NY: Springer.
- Sparks, L., & Leahy, A. (2018). Conversing with cancer: How to ask questions, find and share information, and make the best decisions. Peter Lang Publishers. Retrieved from www.ConversingWithCancer.com
- Turk-Charles, S., Meyerowitz, B. E., & Gatz, M. (1997). Age differences in information-seeking among cancer patients. Int Aging & Human Devel, 45(2), 85–89. doi:10.2190/7CBT-12K3-GA8H-F68R
- Waldie, M., & Smylie, J. (2012). The merck lectureship: Communication: The key to improving the prostate cancer patient experience. Canadian Oncology Nursing Journal, 22(2), 129–133. doi:10.5737/1181912x222129133
- Wright, M. W., Wright, S. T., & Wagner, R. F. (2001). Mechanisms of sunscreen failure. Journal of the American Academy of Dermatology, 44(5), 781–784. doi:10.1067/mjd.2001.113685
- Wu, C. -F. J. (1986). Jackxknife, bootstrap and other resampling methods in regression analysis. The Annals of Statistics, 14(4), 1261–1295.