
Abstract
Street trees in urban planning have a long history as providers of an amicable environment for urban dwellers. Nevertheless, street trees are not always without a challenge, their ecosystem disservices include, inter alia, cracking pavements and foundations due to wandering tree roots that destroy concrete or asphalt surfaces. Thus, effective mapping of street trees assists in planning a suitable urban environment to improve city life. The traditional method for urban tree mapping is costly, time-consuming and labour intensive. However, commercially operated multi-spectral sensors, such as WorldView (WV) provide a more viable way to map trees at the species level. This study investigates the use of WV-2 imagery in the classification and mapping of five common alien street trees in a complex urban environment. It also examined the feasibility of Random Forest (RF) and Support Vector Machines (SVM) classifiers in mapping street trees in a heterogeneous urban environment. The classifiers produced an overall accuracy of 84.2 % for RF and 81.2 % for SVM. This study provides a detailed understanding of urban tree species to the municipality of Johannesburg and offers environmental managers an insight of classification methods for mapping trees using satellite imagery to comprehend their spatial distribution.
PUBLIC INTEREST STATEMENT
This study was conducted to evaluate the strength of the Worldview-2 satellite imagery in mapping urban alien tree species in the city of Johannesburg. The study provides an understanding of mapping common alien tree species showing their spatial distribution in the study area. The results of this study are of paramount importance in the development of a tree inventory, planning and management of urban tree species. The output map could be of great help to urban forest and municipal managers as well as various stakeholders involved in the management of urban tree species. This study provides information on the type of data and classification methods that are useful in the mapping of tree species in a heterogeneous urban environment.
1. Introduction
The mapping of tree species in an urban environment is vital for planning through strengthening our knowledge of their ecological functions in these environments (Liu et al., Citation2017). Urban trees provide ecosystem services such as mitigating urban heat island effects (Yan et al., Citation2018), reducing air and noise pollution, as well as potential flooding and support biodiversity (Seiferling et al., Citation2017). Urban trees also offer essential social, economic and psychological amenities to human beings such as increased property values and improved physical/mental health (Tyrväinen et al., Citation2005). Even though urban trees offer various advantages, there is a debate about alien tree species use in cities.
The major debate over the usefulness of alien vs indigenous tree species necessitates precise identification and mapping of trees, which is essential for city or metropolis managers to develop and sustain urban planning strategies (Li et al., Citation2015). Alien trees were introduced into South Africafor recreation parks, soil stabilisation, erosion control, timber use, shelter, beekeeping, ornamental use, firewood and for commercial purposes, amongst others (Henderson, Citation2001; Zengeya et al., Citation2017). The alien trees in South Africa are native to Europe, Australia, Central America, and north-west Argentina (Henderson, Citation2001). Accurate spatial data on urban trees is required to assess the extent and distribution of tree species to estimate their ecosystem services and disservices (Nowak et al., Citation2008).
Urban tree inventories based on spatial data have long been established using field-based surveys and visual interpretation of aerial photography (Myeong et al., Citation2006). These techniques work well on local and small-scale levels (Alonzo et al., Citation2014). However, the process is tedious, labour intensive and costly, especially at large scales and in heterogeneous environments (Alonzo et al., Citation2016). Remote sensing technologies offer a solution to these problems (Fassnacht et al., Citation2016; Liu et al., Citation2017) because they are efficient, robust, repeatable and rapid in monitoring urban tree dynamics (Myeong et al., Citation2006). The use of hyperspectral imagery has overcome time and labour challenges in mapping urban tree species (Liu et al., Citation2017). These challenges are because of the urban areas’ complexity of features and the land cover heterogeneity (Li et al., Citation2015), diversity of the species and variations in the spatial characteristics (Alonzo et al., Citation2014). On the other hand, hyperspectral data usage is constrained by availability, the high dimensionality of data, computer processing time and cost (Adam et al., Citation2017).
Commercially operated sensors such as RapidEye and WorldView provide multispectral and panchromatic imagery globally, at a high spatial resolution for analysing tree species (Ke & Quackenbush, Citation2011; Richardson & Moskal, Citation2014). Their efficiency in classifying trees in a complex urban setting justify their continued use (Novack et al., Citation2011). WorldView-2 (WV-2) satellite imagery with good radiometric, spectral and geometric resolution (up to eight bands) has produced satisfactory results in urban tree species mapping. The recent studies by Li et al. (Citation2015), Yan et al. (Citation2018), and Shojanoori et al. (Citation2016), showed high level of accuracies in mapping urban tree species using WV-2 satellite imagery. The WV-2 satellite data depends on the selected remote sensing data characteristics (landscape complexity), as well as the methods used for processing and classifying the images to provide precise thematic maps and high accuracy values (Lu & Weng, Citation2007).
Image appropriateness and the classification method used are essential requirements to obtain optimal accuracies (Lu & Weng, Citation2007). Previous studies utilized different machine learning algorithms such as random forest (RF), decision trees, support vector machines (SVM) and k-Nearest Neighbors (kNN) to classify satellite imagery (Thanh Noi & Kappas, Citation2017). Machine learning algorithms, in particular, RF have been used in many studies (Li et al., Citation2015; Puissant et al., Citation2014) and performed well in classifying tree species in urban environments. Support Vector Machines (SVM) have also increasingly been utilized in natural vegetation classification (Krahwinkler & Rossman, Citation2011; Li et al., Citation2015; Niska et al., Citation2010; Pal, Citation2005; Thanh Noi & Kappas, Citation2017). Furthermore, RF and SVM classification methods have been utilized mostly to classify images using the pixel-based approach, but few studiesused both algorithms in an object-based image analysis (OBIA) and achieved satisfactory results (Li et al., Citation2015; Mustafa et al., Citation2015; Yan et al., Citation2018).
The City of Johannesburg (CoJ) is considered the largest man-made forest in the world (Schäffler & Swilling, Citation2013). The city is predominantly planted with alien trees that appeared with the arrival of the Europeans in the 19th century (Schäffler & Swilling, Citation2013). Improved classification accuracy can provide us with a better understanding of the health of all trees planted in the CoJ. The alien tree species are subject to many stresses which include: soil, water and air pollution, soil sealing and compaction (Paap et al., Citation2017; Pautasso et al., Citation2015). These stresses make trees susceptible to pathogens and insects such as the polyphagous shot hole borer (Euwallacea fornicatus), an ambrosia beetle which is affecting urban alien trees in the CoJ, including Platanus spp., (Paap et al., Citation2018), Jacaranda spp., Quercus spp. and Eucalyptus spp. (Forestry & Agricultural Biotechnology Institute, Citation2019). Data capture via WV-2 satellite imagery can be used to identify such affected areas, which prove invaluable for urban planners and other research groups.
The CoJ is believed to have over 10 million trees, with over 4.5 million in private gardens and about 2.5 million trees in conservation areas, parks, nature reserves, city’s pavements and cemeteries (Johannesburg City Parks & Zoo, Citation2018). Nevertheless, management of these trees depends on anecdotal information on the urban tree species in the CoJ. To address this issue, this study assessed the ability of remote sensing to map and classify urban alien tree species in the Johannesburg area using high-resolution multispectral data. The specific objectives of the study are: i) to examine the effectiveness of RF and SVM in mapping urban alien tree species and other land use and land cover (LULC) classes using the WV-2 imagery in Johannesburg suburb; ii) test the utility of the spectral bands of WV-2 in mapping urban alien tree species and LULC classes, and iii) compare the performance of RF and SVM classification methods in mapping urban alien tree species and LULC classes using high-resolution WV-2 image.
2. Materials and methods
2.1. Study area
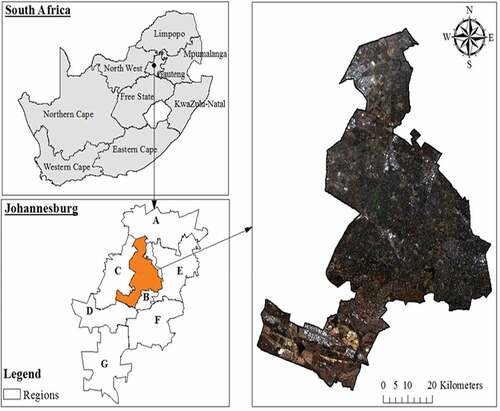
Randburg municipal area (167.98 km2) is the location where this study was conducted, which is in Region B of the CoJ (Figure ). The annual rainfall in CoJ is approximately 750 mm per annum, with potential evaporation of around 1600 mm/annum (Tyson & Wilcocks, Citation1971). The rain mostly falls in the course of the summer season which runs from October to February and temperature averages reaches around 15 ºC in winter and 20 ºC in summer (Naicker et al., Citation2003). The mean altitude of the CoJ is 1512 m, with altitudes ranging between 1081 m and 1899 m (Grobler et al., Citation2002). The soil in this area is composed of Glenrosa, and Mispah soil forms (Grobler et al., Citation2002) and the rocks are crystalline of Archean age which underlie the whole of Johannesburg (Abiye et al., Citation2018). The rocks in the area are mainly granitic gneiss, meta-volcanic and metasedimentary rocks (Abiye et al., Citation2018).
The most common and fast-growing alien trees in the study area are black wattle, jacaranda, eucalyptus, pepper trees, oaks and London planes which were introduced in the 19th century under the tree planting project (Turton et al., Citation2006). There are indigenous trees in the CoJ, but primarily non-indigenous tree species were planted during the colonial-era resulting in the spatial diversity of trees in the city (Schäffler & Swilling, Citation2013).
Figure 1. Map of South African provinces showing the location of the study area in Johannesburg’s regions and the true-colour WorldView-2 satellite imagery of the Randburg municipal area located in the City of Johannesburg
2.2. Remote sensing data acquisition
This study is based on remote sensing and field data obtained in spring 2017. A total number of 36 scenes of WV-2 satellite imagery, captured on 15 September 2017, and field data collected in November of the same year was used. The scenes were supplied by the CoJ Corporate Geo-Informatics, Development Planning and Urban Management (DP&UM) department, free of charge with radiometric and geometric corrections already done. To combine the scenes for the WV-2 image, they were mosaicked using ArcMap 10.5 software. The WV-2 image provides high spatial resolution data, with a swath width of 16.4 km at nadir, eight multispectral bands, and a 2 m spatial resolution. Moreover, the WV-2 multispectral sensor’s eight multi-spectral bands cover the NIR1, NIR2, red edge, red, yellow, green, blue and coastal wavelength region (Table ). Furthermore, the panchromatic sensor band has a spatial resolution of 0.46 m and lies within a spectral range of 450–800 nm. The WV-2 image was provided in Hartebeeshoek WGS84 coordinates (Central Meridian-29, Projection-Transverse Mercator).
Table 1. WV-2 spectral resolution and sensor band names used in this study
2.3. Field data collection
A handheld outdoor Global Positioning System (G.P.S) receiver (Garmin eTrex 20 X) was used to collect field data and determine the coordinates for the dominant alien tree species. Due to the dearth of precise data on the spatial distribution of urban trees in South Africa, stratified purposive sampling was used to visit areas dominated by five dominant alien tree species (Eucalyptus spp., Jacaranda spp., Platanus spp., Quercus spp. and Pinus spp.). The study area was divided into zone segments and samples taken, ensuring that every block has an equal chance of being selected. Stratification permits accuracy by providing a combination of the results from random samples in the chosen zone segments (Jaenson et al., Citation1992). In addition, this method captures major differences rather than identifying a common species even though the latter may appear in the analysis (Palinkas et al., Citation2015). The zigzag sampling method was used to provide a uniform distribution of the sampling sites (Ryan et al., Citation2007) and it identified the urban alien tree species which were planted mostly along the streets in the study area. Additional ground truth points were also collected for the common land use/cover classes (Table ). The LULC classes were added due to their importance to urban planners in understanding the spatial distribution of urban tree species with the city plan and structure.
Table 2. Scientific and common names, code, training, test and total samples used in this study
The sample size for the five urban alien tree species and additional LULC classes was 1369 (Table ). The sample was divided into a training set (70%) of 964 and a test set (30%) of 405.
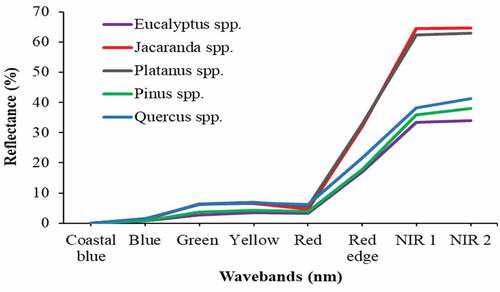
The spectral characteristics of the five dominant urban alien tree species considered in this study are shown in Figure . The average spectrum was extracted from WV-2 imagery pixels, with n = 40 for each dominant alien tree species.
Figure 2. Average spectral reflectance curves extracted from Worldview-2 imagery pixels for the five dominant alien tree species considered in this study
2.4. Data analysis and classification
The ability of RF and SVM machine learning algorithms to map urban alien trees was assessed in this study. The pixel-based classification techniques were used to map the urban alien trees using the machine learning algorithms. Both classifiers (RF and SVM) were trained with the training sample set, while the test set was used to measure the accuracy of the classification maps. The training and test data obtained from the WV-2 image in the study area are shown in Table . The RF and SVM classifiers’ parameters were analysed with the open-source statistical software R for classification of the WV-2 imagery.
2.4.1. Random Forest (RF) classifier
The RF machine learning algorithm for statistical data analysis was put forward by Breiman (Citation2001) for the improvement of classification and regression trees (CART). RF builds up numerous unpruned trees (ntree) on original data’s bootstrap sample, where the default ntree value in the “random forest” package in R statistical software is 500, specifically assigned for large datasets. The user defines ntree value and trees with low bias, and high diversity are created by the RF algorithm (Breiman, Citation2001). A bootstrap sample, which is a two-thirds majority of the original data, known as “in-bag” samples are utilized in the training of trees and the rest of them (one-third) is “out-of-the-bag” samples (Belgiu & Drăguţ, Citation2016). The “out-of-the-bag” samples estimate how well the RF classifier performs in a cross-validation approach, and the resulting estimate value is known as the out-of-bag (OOB) error (Belgiu & Drăguţ, Citation2016).
Furthermore, in RF machine learning algorithm, random subsets of variables were used to split trees into nodes, referred to as mtry and its default value is the √P, which is the predictor variables’ total number (Breiman, Citation2001). On the basis of the chosen variables of the mtry (default value is 500 trees), the variable yielding the greatest decrease in impurity is selected for the splitting of samples at each node (Breiman, Citation2001). Both the ntree and mtry parameters need to be put together to generate forest trees, and the optimization of these parameters can improve the classification accuracy values (Belgiu & Drăguţ, Citation2016; Mutanga et al., Citation2012).
In this study, a 10-fold cross-validation technique dependant on the OOB error was used to identify the best ntree and mtry parameters. The ntree parameter tested in this study varied from 500 to 10 000 with 1000 interval while the mtry values ranged from 1 to 8. If the OOB error is low, this shows that the RF classification method performed well, whereas high OOB error values show poor performance.
In addition, the RF algorithm sets out the variable importance (VI) measurement and is calculated in different ways which include making use of the Mean Decrease in Accuracy (MDA), or else the Mean Decrease in Gini (MDG) (Breiman, Citation2001). In the RF model establishment, the computing time required is calculated using EquationEq.1[1] below:
where M illustrates the specific number of variables applied in each split, whereas N represents the total number of the training samples, and T stands for the total number of trees (Belgiu & Drăguţ, Citation2016; Breiman, Citation2001).
RF classifier has been used in other studies to successfully map urban buildings (Belgiu & Drăguţ, Citation2016), boreal forest habits (Räsänen et al., Citation2013), tree, biomass and crown cover (Karlson et al., Citation2015) as well as urban tree species (Li et al., Citation2015; Liu et al., Citation2017; Puissant et al., Citation2014). This illustrates the usefulness of RF classifier to map urban alien tree species for the current study. In this study, the RF classifier in R was utilized in mapping urban alien tree species in the study area.
2.4.2. Support Vector Machines (SVM) classifier
The Support Vector Machines (SVM) classifier does not require an assumption concerning data distribution and does not overfit the new or test data samples by applying viable principles (Abdel-Rahman et al., Citation2014). The SVM machine-learning algorithm initially proposed by Vapnik (Citation1995), focuses on the training sites, which are closest to the optimal boundary amid classes in the attribute space (Maxwell et al., Citation2018). In addition, SVM is a supervised classification approach which is non-parametric and non-linear broadly employed in remote sensing research because of its precise capacity to derive results even using a small number of training samples or sites (Mountrakis et al., Citation2011). The data points that lie on the supporting hyperplanes are known as support vectors, and optimal hyperplane is positioned in the middle of the margin. Additionally, the machine-learning algorithm has kernel and mapping functions derived from the original input space to the feature space that is highly dimensional (Mountrakis et al., Citation2011).
In recent years, SVM’s four most commonly utilized kernel functions are the polynomial, sigmoid, linear and radial basis function (RBF) kernels (Qian et al., Citation2014). The current study makes use of the radial basis function (RBF) kernel since it lends itself to successfully classify urban land cover (Qian et al., Citation2014) and tree species (Raczko & Zagajewski, Citation2017). The RBF kernel consists of two significant parameters, which are the “gamma” (γ), and “cost” (C), which play an essential role in determining the overall classification accuracy value (Qian et al., Citation2014).
We utilized all eight WV-2 bands and the RBF kernel to find an optimal hyperplane that could distinguish all the LULC classes, including the five-target tree species of this study. More so, the optimization of γ and C parameters of the RBF function was done using the LIBSVM library to obtain the best parameter values. The SVM classifier was run in R statistical software version 3.4.4, and the “e1071” library was used in the optimization of SVM parameters.
2.4.3. Accuracy assessment and validation
The accuracy of any classification algorithm in remote sensing is judged by the prediction performance testing results (Odindi et al., Citation2016). Thus, the RF and SVM machine-learning algorithms were utilized to assess their efficiency using the test dataset (30%) in confusion matrices, where the kappa coefficient, user’s, overall and producer’s accuracy values were derived on the classified maps to ascertain the level of reliability and accuracy (Jombo et al., Citation2017).
Moreover, the significant difference between the results from the SVM and RF classifiers was tested in this study using McNemar’s test. The test is non-parametric, based on a normal test statistic, and calculated out of the two classification methods’ error matrices. It is measured as shown below in (EquationEq.2[2] ):
where ⨎12 represents the misclassified number of samples by the RF yet classified correctly by the SVM classifier, and ⨎21 represents a number in a total of samples classified correctly by RF although not classified correctly by SVM (Abdel-Rahman et al., Citation2014). Additionally, the Z value was obtained in this study, and it shows the RF and SVM classifiers’ difference in accuracy results. At 95 % confidence level and a test z score <1.96, the McNemar’s test is regarded as statistically significant (Adelabu et al., Citation2013).
3. Results
3.1. RF parameter tuning
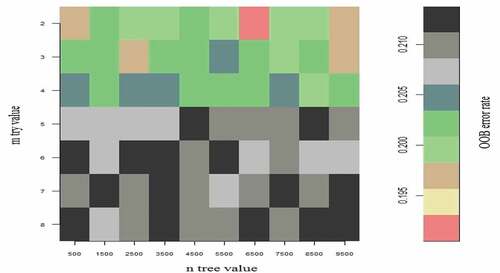
The best-input parameters for the classification of the five urban trees species and LULC classes were determined through optimization for training in the RF machine-learning algorithm. Consequently, the 10-fold cross-validation sampling method was utilized in this study, and a combination of the best parameters mtry and ntree had values of 2 and 6500, respectively (Figure ). Additionally, this combination produced the lowest OOB error rate of 19.2%, and the highest OOB error rate of 21.2% (mtry of 8 and ntree of 3500).
Figure 3. Random Forest parameters (mtry and ntree) after optimization utilizing the 10-fold cross-validation sampling method and OOB estimate of error rate
3.2. SVM parameters tuning
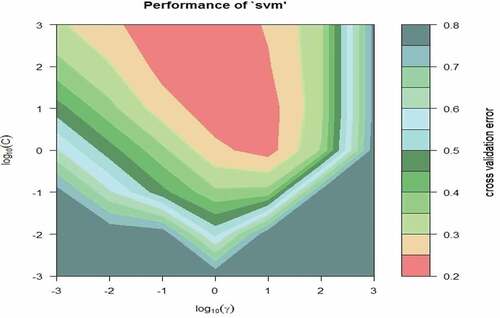
The best parameters of the γ and C RBF kernel parameters were found through optimization for classification using the SVM method. Therefore, the best γ and C parameters were obtained with the use of the 10-fold cross-validation sampling technique. Figure illustrates that the best parameters for γ and C were 1 and 100, respectively, using the radial SVM-kernel and 521 support vectors.
Figure 4. Support Vector Machine parameters (γ and C) after optimization using the 10-fold cross-validation sampling method and cross-validation error rate
3.3. RF and SVM in urban tree species mapping
The maps showing other LULC classes and urban alien tree species’ spatial distribution were produced for both the RF and SVM classifiers (Figure ). The classified maps showed that built-upcovers the largest area of land as compared to other classes. The other woody vegetation class covers mostly the southern part in the area of study (Figure ). The Platanus spp. covered the largest area as compared to all the other urban alien trees classes with values of 8.38% and 8.11% using the RF and SVM classifiers, respectively (Table ). The Platanus spp. were mainly found in Pine Park and Linden suburbs, situated in the southern side of the study area (Figure ).
Figure 5. Map showing the five urban tree species and LULC classes in the Randburg municipal area classified using a) RF and b) SVM machine learning algorithms
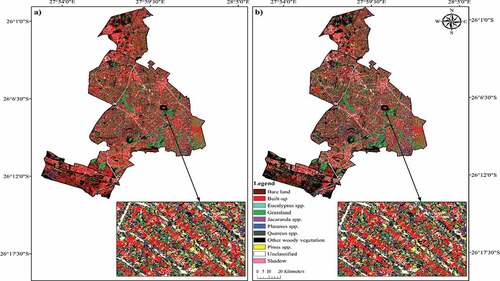
Table 3. Area in hectares (ha) and percentage cover of LULC classes acquired using the RF and SVM classification methods. The classes are bare land (BL), built-up (BU), Eucalyptus spp. (EC), Grassland (GL), Jacaranda spp. (JC), Platanus spp. (PL), Quercus spp. (QR), Other woody vegetation (OWV), Pinus spp. (PN) and Shadow (SW)
Furthermore, most of the Eucalyptus spp. are situated in the northern part of the area of study in places like suburbs such as Bloubosrand and Fleurhof, while most of the Jacaranda spp. were in the southern part of the area of study in suburbs like Randpark ridge, Fairland and Windsor East. The Pinus spp. and Quercus spp. were mostly located in the Greenside and Parkview suburbs (southern part). All the LULC classes (other woody vegetation, built-up, grassland, shadow and bare land) were spread across all regions of the study area.
The two classifiers (RF and SVM) showed some minor inconsistencies in the size of each class. The differences in the areas covered by the five alien tree species classified using the two models were less than 1% (Table ). However, the area of coverage (ha), between each of the species showed some significant differences. For example, the Eucalyptus spp., shows an area of 737.96 ha for SVM and 576.54 ha for RF classifier (Table ). This gives a difference of 161.42 ha of total area coverage between the two classifiers for the Eucalyptus spp. TheQuercus spp. had a difference of 164.08 ha since the SVM showed a total coverage area of 409.80 ha and RF, 245.71 ha (Table ). The values for the SVM classifier were generally higher than the ones for the RF classifier. There are also differences in the area covered by other LULC classes, for example, the built-up area showed a difference of 769.19 ha as RF showed total coverage of 5489.70 ha, whilst SVM showed 4720.51 ha for the same class. The RF classifier showed that the built-up and other woody vegetation were the dominant classes in the study area (Figure ), whereas Quercus spp. and Eucalyptus spp. were the less dominant classes (Table ). Shadow and Quercus spp. were the least dominant classes from the classified map using SVM classifier (Table ).
The RF classifier presented the variable of importance (Figure ), indicating the part each band played in the classification procedure. More importantly, the more essential bands are the ones with the uppermost Mean Decrease Accuracy (MDA) values.
Figure 6. Importance of WV-2 multispectral bands in RF classification by means of Mean Decrease Accuracy (MDA) values
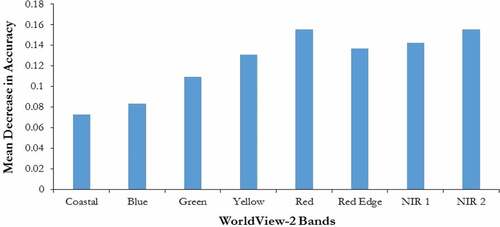
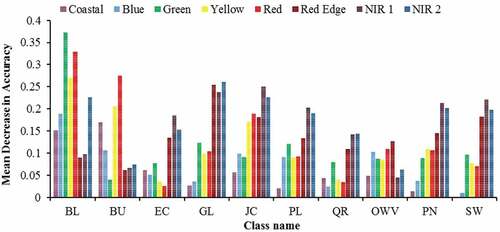
The utility of every single WV-2 spectral band was evaluated in mapping all the classes in the study (Figure ). As shown by the high level of MDA in Figure , the NIR and red edge bands were the most imperative in the classification of the five urban alien tree species (Eucalyptus spp., Jacaranda spp., Platanus spp., Quercus spp. and Pinus spp.). Similarly, areas with trees or vegetation predominantly fell on the red edge and NIR bands, which are valuable in the discrimination of plant species in classification, biomass and vegetation analysis. As illustrated in Figure , the green, red and yellow bands were the most important contributors in mapping the bare land areas. The red, yellow and coastal bands were more significant in the classification of the built-up class, whereas red edge and NIR bands were important in classifying the grasslands (Figure ). The blue and two red bands were the most important bands for the other woody vegetation, whilst the NIR and red edge bands were the imperative bands for detecting the shadow class.
Figure 7. The Mean Decrease Accuracy (MDA) values showing the relationship between each class and WV-2 spectral bands. The classes are bare land (BL), built-up (BU), Eucalyptus spp. (EC), Grassland (GL), Jacaranda spp. (JC), Platanus spp. (PL), Quercus spp. (QR), Other woody vegetation (OWV), Pinus spp. (PN) and Shadow (SW)
3.4. Accuracy assessment and validation
The accuracy levels for both RF and SVM classifiers were attained, utilizing a 30% test set of data on the WV-2 imagery and the confusion matrices for both classifiers (Table ). The range for the user’s accuracy values for RF was between 61.11% (Platanus spp.) and 100 % for the grassland class (Table ), while the producer’s accuracy ranged from 55% (Platanus spp.) to 100% for the Quercus spp. classes. Moreover, the RF values for the user’s and producer’s accuracy were lowest on the Platanus spp. at 61.11% and 55%, respectively (Table ). The user's accuracy values for the SVM classifier ranged from 50% (shadow) to 100% (grassland) whilst the producer's accuracy ranged from 42.86% (Quercus spp.) to 98.81% (built-up) (Table ).
Table 4. Confusion matrices using a) RF and b) SVM classification algorithms. The classes are bare land (BL), built-up (BU), Eucalyptus spp. (EC), Grassland (GL), Jacaranda spp. (JC), Platanus spp. (PL), Quercus spp. (QR), Other woody vegetation (OWV), Pinus spp. (PN) and Shadow (SW). The producer’s accuracy (PA), overall accuracy (OA), user’s accuracy (UA), and kappa coefficient calculated using the “rasclass” package in R version 3.6.0 on the test dataset
The user’s accuracy for the five urban alien trees (Eucalyptus spp., Jacaranda spp., Platanus spp., Quercus spp. and Pinus spp.) produced by the RF classifier ranged from 61.11% (Platanus spp.) to 85.71% for the Eucalyptus spp. class (Table ), while the producer’s accuracy ranged from 55% (Platanus spp.) to 100% (Quercus spp.). Similarly, the SVM accuracy results for these five alien trees ranged from 54.55% (Quercus spp.) to 68.89% (Pinus spp.), while the producer’s accuracy values ranged from 42.86% (Quercus spp.) to 85.19% (Jacaranda spp.).
The overall accuracy assessment based on the independent test dataset was 84.2% for RF, with 0.82 kappa coefficient value (Table ), while that of the SVM classifier was 81.2%, with a kappa coefficient of 0.78 (Table ).
The results from the McNemar’s test showed that at a 5% significance level, the RF and SVM’s confusion matrices show no significant difference (Table ). The z value obtained was −1.64 (Table ), which was less than 1.96. Some of the classified areas using the RF classifier were almost similar to those obtained using the SVM classifier (Figure ).
Table 5. The comparison results of Random Forest (RF) and Support Vector Machines (SVM) classification methods using McNemar’s test. CC stands for correctly classified and IC is for incorrectly classified samples
4. Discussion
Worldview-2 satellite imagery was used to map five common alien urban trees using RF and SVM classification algorithms. The most influential bands for mapping alien tree species and LULC classes were the Red and the NIR bands (Figure ). Thus, areas with vegetation cover predominantly fall in the NIR and red regions of the WV-2 imagery. Mean decreasing accuracy (MDA) for each variable was obtained during the OOB calculation (Liu et al., Citation2017). Although for many years remote sensing data has been used in studying ecological and environmental phenomena, beneficial information has not successfully given fine spatial extent as well as temporal measures (Anderson & Gaston, Citation2013). Nevertheless, the traditional photointerpretation methods used in the past were time and labour-intensive, and costly, especially for data acquisition over large geographical areas and more importantly such aerial photographs and pixel-based image classification approaches are not well suited for LULC mapping in a heterogeneous urbanized landscape (Cleve et al., Citation2008). However, Zhang et al. (Citation2015) indicated that a problem of mixing various impervious surface areas and vegetation in one pixel for medium spatial resolution images might exist, for example, Landsat TM imagery. However, very high-resolution WV-2 images have resolved this problem.
This study has shown that Eucalyptus spp. were mostly found in the southern part of the study area in places such as Robertville, where the mining sites such as Rand Leases and Main Reef are located. These trees were planted to stabilize the soil and reduce soil erosion. Eucalyptus spp. in other areas, were also planted for timber, pulp, poles (Van Wilgen & Richardson, Citation2014), mine props and excavation (Turton et al., Citation2006). Jacaranda spp., Platanus spp. and Quercus spp. were found in areas such as Randpark ridge, Fairland, Pine Park, Linden and Windsor East, situated in the southern part of the study area. In addition, it is significant to bear that these areas were among the affluent suburbs of Johannesburg inhabited by the white community during the apartheid era before 1994, many of which were planted in these neighbourhood streets for beautification and settling dust (Turton et al., Citation2006). The Pinus spp. were situated in areas such as Parkview and Greenside, especially in and around open spaces such as Parkview Golf Club and Johannesburg Botanical Gardens and were introduced in these areas for ornamental or recreational values.
Our results indicate that the multispectral WV-2 sensor is suitable in urban tree species mapping using RF and SVM classifiers with overall accuracies of 84.2% and 81.2%, respectively. The RF user accuracy values for the Eucalyptus, Jacaranda, Pinus and Quercus species were higher than those in the SVM classifier (Table ). The RF user accuracy value for Platanus spp. (61.11%) was less than the one for SVM (62.50%). This was mainly due to the misclassifications of Platanus spp. as other woody vegetation, Jacaranda spp. or Quercus spp. classes (Table ). The misclassifications of the Platanus spp. were maybe due to errors in the reference dataset as it was challenging to find these tree species of concern in the area of study as they were not usually found as pure stands. This resulted in differences in the area of coverage, with the SVM classifier having Platanus spp. covering 4.68% of the total area while RF had 4.98% (Table ). The misclassifications due to errors in the reference dataset were one of the reasons leading to the dissimilarities in the area of coverage for all classes classified by the RF and SVM. The RF producer’s accuracy values for four of the five urban tree species (Eucalyptus spp., Platanus spp., Pinus spp. and Quercus spp.) were higher than those for SVM. For example, SVM’s producer’s accuracy value for Jacaranda spp. (85.19%) was higher than that for RF (62.96%). Moreover, the low producer’s and user’s accuracy values for Platanus spp. and Quercus spp. for both algorithms (RF and SVM) could be due to a small number of reference polygons as illustrated in Table . It has been conclusively shown that a small number of reference polygons make it challenging in characterizing spectral variability of individual tree species due to their unique phenological ages or stages all along the slope (Le Louarn et al., Citation2017). In addition, misclassifications were also due to tree species’ variety in this urbanized area of sudy which leads to a “mixed pixel problem” where some pixels are not entirely occupied by one homogeneous class (Salih et al., Citation2017).
The RF user accuracies for the LULC classes were between 77.36% and 100%, while those of SVM was between 50% and 100% (Table ). The RF had producer’s accuracy values ranging from 75% to 96.88% for all LULC classes, whereas those for the SVM classifier for the same classes were between 53.85% and 98.81%. The low SVM producer’s accuracy value of 53.85% (shadow) was due to misclassifications between this class and the Quercus spp., Pinus spp. and other woody vegetation classes (Table ). The misclassifications may be due to errors in the reference dataset where some points for shadow class were classified to some of the urban tree species. It might have been the case that the values for the user’s and producer’s accuracy could be high if there were low tree species diversity in the area of study. The identification, classification and mapping of tree species in an urban area at individual level nowadays have been restricted to airborne LiDAR and hyperspectral data as they produce high accuracy values due to their higher spectral and spatial resolutions as compared to multispectral data (Fassnacht et al., Citation2016; Liu et al., Citation2017; Raczko & Zagajewski, Citation2017). However, hyperspectral data are costly, time-consuming for processing, require huge storage space and also suffer from multi-collinearity (Odindi et al., Citation2016). Recently, multispectral remote sensing imagery characterised by finer resolutions (i.e. spectral and spatial) has improved classification results (Odindi et al., Citation2016). Thus, the advent of the new age WV-2 satellite imageries which costs relatively less offers new perspectives due to the increased radiometric, geometric and spatial (8 bands) resolutions and can map trees at the species level (Waser et al., Citation2014). The performance of satellite data and classification models used in mapping urban tree species vary significantly across various regional environments (Le Louarn et al., Citation2017). Therefore, they cannot be directly transferred across different urban environments and vegetation phenological stages. Further comparison of different satellite data in mapping urban tree species need to be established for achieving better accuracies at the lowest cost.
Our study reflected that the RF marginally outperformed the SVM classifier by 3%. This result agrees well with previous studies (Le Louarn et al., Citation2017; Puissant et al., Citation2014) where the RF outperformed the SVM machine learning algorithms in mapping urban tree species. The high accuracy values achieved by the RF and SVM classifiers may be attributed to the utilization of WV-2 satellite imagery captured in the spring season, a period when the urban trees’ new leaves start to expand, and the buds begin to open. The tree leaves assisted in showing spectral differences amongst the species enhancing their separability in mapping urban trees in this study. The development of tree leaves between spring and summer seasons cause an increase in the content of leaf chlorophyll (Le Louarn et al., Citation2017). The difference in the MDA values showed high NIR values and low blue and red bands for the five urban tree species (Figure ). The high accuracy values for the urban tree species may be due to the strength of the RF classifier to handle unbalanced datasets, computational efficiency and having no distributional assumptions on the input data set (Odindi et al., Citation2016). The SVM classifier also produced high accuracy values as a high “cost” (C) value of 100 was used, and the training error is penalized, forcing the misclassification of points to be lowered by the algorithm in the course of the training operation (Abdel-Rahman et al., Citation2014). It is noteworthy that a non-linear RBF kernel for the SVM classifier was utilized in this study as it solves the inseparability problems that may arise in the vegetation species mapping (Mountrakis et al., Citation2011). The high accuracy values in this study, however, remain unclear as to whether they were found due to the RF and SVM classifiers used, WV-2’s high spatial resolution or the absence of complications in the landscape.
5. Conclusions
The ability of the high-resolution multispectral WV-2 satellite imagery by utilizing RF and SVM classification algorithms was assessed in mapping of urban tree species at Randburg municipality in the CoJ. The results demonstrates the enormous ability of WV-2 satellite imagery and machine learning classifiers (RF and SVM) in detecting and mapping urban tree species in a complex urban environment. This study provides an insight to the municipality’s urban forest and environmental managers in monitoring the urban tree species. Such spatial information will assist urban forest managers in the current urban tree inventory and urban greening program.
We caution, however, that this conclusion is based on the fact that there are misclassification errors which might be due to the many factors such the image registration error, the spectral and spatial resolution limitations and the spectral signature overlap. Future studies should consider testing different classification approaches such as object-based image analysis and exclude other LULC classes to improve classification accuracy and minimize misclassification errors.
Overall, we believe that based on our relatively high accuracy levels achieved, the low cost and the ease with which the data is analysed it is worth to consider WV2 satellite data for urban tree species classification.
Acknowledgements
We would like to thank the Wits School of Governance (WSG) at the University of the Witwatersrand for all the financial support of this study through the ‘Life in City” project (Grant number #: 2858) led by Dr S. Newete. We would also like to extend our gratitude to the City of Johannesburg Corporate Geo-Informatics (DP & UM) Gauteng, South Africa for providing WorldView-2 data for our study area in Johannesburg.
Additional information
Funding
Notes on contributors
Simbarashe Jombo
Simbarashe Jombo is a PhD candidate at University of the Witwatersrand, Johannesburg. His research interests are in the use of GIS and remote sensing techniques in environmental management. He has knowledge in advanced satellite image processing, mapping, geospatial analysis and modelling, land use and land cover mapping and related accuracy assessment.
Elhadi Adam
Dr Elhadi Adam is a senior lecturer at University of the Witwatersrand, Johannesburg and his expertise lies on applications of remote sensing and GIS in applied environmental management.
Marcus J. Byrne
Professor Marcus J. Byrne works at the School of Animal, Plant and Environmental Sciences, University of the Witwatersrand. He won the 2013 Ig Nobel Prize for Biology/Astronomy on dung beetles. He does research in Entomology and Zoology.
Solomon W. Newete
Dr Solomon Newete is a Senior Researcher at the Agricultural Research Council (ARC) with research interests in invasive alien plants, environmental pollution and phytotechnology, agriculture and food security, and remote sensing technology.
References
- Abdel-Rahman, E. M., Mutanga, O., Adam, E., & Ismail, R. (2014). Detecting Sirex noctilio grey-attacked and lightning-struck pine trees using airborne hyperspectral data, random forest and support vector machines classifiers. ISPRS Journal of Photogrammetry and Remote Sensing, 88, 48–19. https://doi.org/10.1016/j.isprsjprs.2013.11.013
- Abiye, T., Masindi, K., Mengistu, H., & Demlie, M. (2018). Understanding the groundwater-level fluctuations for better management of groundwater resource: A case in the Johannesburg region. Groundwater for Sustainable Development, 7, 1–7. https://doi.org/10.1016/j.gsd.2018.02.004
- Adam, E., Mureriwa, N., & Newete, S. (2017). Mapping Prosopis glandulosa (mesquite) in the semi-arid environment of South Africa using high-resolution WorldView-2 imagery and machine learning classifiers. Journal of Arid Environments, 145, 43–51. https://doi.org/10.1016/j.jaridenv.2017.05.001
- Adelabu, S., Mutanga, O., Adam, E. E., & Cho, M. A. (2013). Exploiting machine learning algorithms for tree species classification in a semiarid woodland using RapidEye image. Journal of Applied Remote Sensing, 7(1), 073480. https://doi.org/10.1117/1.JRS.7.073480
- Alonzo, M., Bookhagen, B., & Roberts, D. A. (2014). Urban tree species mapping using hyperspectral and lidar data fusion. Remote Sensing of Environment, 148, 70–83. https://doi.org/10.1016/j.rse.2014.03.018
- Alonzo, M., McFadden, J. P., Nowak, D. J., & Roberts, D. A. (2016). Mapping urban forest structure and function using hyperspectral imagery and lidar data. Urban Forestry & Urban Greening, 17, 135–147. https://doi.org/10.1016/j.ufug.2016.04.003
- Anderson, K., & Gaston, K. J. (2013). Lightweight unmanned aerial vehicles will revolutionize spatial ecology. Frontiers in Ecology and the Environment, 11(3), 138–146. https://doi.org/10.1890/120150
- Belgiu, M., & Drăguţ, L. (2016). Random forest in remote sensing: A review of applications and future directions. ISPRS Journal of Photogrammetry and Remote Sensing, 114, 24–31. https://doi.org/10.1016/j.isprsjprs.2016.01.011
- Breiman, L. (2001). Random forests. Machine Learning, 45(1), 5–32. https://doi.org/10.1023/A:1010933404324
- Cleve, C., Kelly, M., Kearns, F. R., & Moritz, M. (2008). Classification of the wildland–urban interface: A comparison of pixel- and object-based classifications using high-resolution aerial photography. Computers, Environment and Urban Systems, 32(4), 317–326. https://doi.org/10.1016/j.compenvurbsys.2007.10.001
- Fassnacht, F. E., Latifi, H., Stereńczak, K., Modzelewska, A., Lefsky, M., Waser, L. T., Straub, C., & Ghosh, A. (2016). Review of studies on tree species classification from remotely sensed data. Remote Sensing of Environment, 186, 64–87. https://doi.org/10.1016/j.rse.2016.08.013
- Forestry & Agricultural Biotechnology Institute. (2019). The Polyphagous Shothole Borer (PSHB) and its fungus in South Africa. University of Pretoria. Retrieved October 10, 2019 from https://www.fabinet.up.ac.za/index.php/research/7
- Grobler, C. H., Bredenkamp, G. J., & Brown, L. R. (2002). Natural woodland vegetation and plant species richness of the urban open spaces in Gauteng, South Africa. Koedoe, 45(1), 19–34. https://doi.org/10.4102/koedoe.v45i1.13
- Henderson, L. (2001). Alien weeds and invasive plants: A complete guide to declared weeds and invaders in South Africa (Vol. 12). Plant Protection Research Institute.
- Jaenson, R., Bassuk, N., Schwager, S., & Headley, D. (1992). A statistical method for the accurate and rapid sampling of urban street tree populations. Journal of Arboriculture, 18(4), 171–183. Scopus.
- Johannesburg City Parks & Zoo. (2018). The city that’s a rain forest. Johannesburg City Parks & Zoo. Retrieved May 16, 2019 from http://www.jhbcityparks.com/index.php/street-trees-contents-29
- Jombo, S., Adam, E., & Odindi, J. (2017). Quantification of landscape transformation due to the Fast Track Land Reform Programme (FTLRP) in Zimbabwe using remotely sensed data. Land Use Policy, 68, 287–294. https://doi.org/10.1016/j.landusepol.2017.07.023
- Karlson, M., Ostwald, M., Reese, H., Sanou, J., Tankoano, B., & Mattsson, E. (2015). Mapping tree canopy cover and aboveground biomass in Sudano-Sahelian woodlands using Landsat 8 and random forest. Remote Sensing, 7(8), 10017–10041. https://doi.org/10.3390/rs70810017
- Ke, Y., & Quackenbush, L. J. (2011). A review of methods for automatic individual tree-crown detection and delineation from passive remote sensing. International Journal of Remote Sensing, 32(17), 4725–4747. https://doi.org/10.1080/01431161.2010.494184
- Krahwinkler, P., & Rossman, J. (2011). Using decision tree based multiclass support vector machines for forest mapping [Paper presented]. The IEEE Int. Geoscience and Remote Sensing Symp, Vancouver, Canada.
- Le Louarn, M., Clergeau, P., Briche, E., & Deschamps-Cottin, M. (2017). “Kill Two birds with one stone”: Urban tree species classification using bi-temporal pléiades images to study nesting preferences of an invasive bird. Remote Sensing, 9(9), 916. https://doi.org/10.3390/rs9090916
- Li, D., Ke, Y., Gong, H., & Li, X. (2015). Object-based urban tree species classification using bi-temporal WorldView-2 and WorldView-3 images. Remote Sensing, 7(12), 16917–16937. https://doi.org/10.3390/rs71215861
- Liu, L., Coops, N. C., Aven, N. W., & Pang, Y. (2017). Mapping urban tree species using integrated airborne hyperspectral and LiDAR remote sensing data. Remote Sensing of Environment, 200, 170–182. https://doi.org/10.1016/j.rse.2017.08.010
- Lu, D., & Weng, Q. (2007). A survey of image classification methods and techniques for improving classification performance. International Journal of Remote Sensing, 28(5), 823–870. https://doi.org/10.1080/01431160600746456
- Maxwell, A. E., Warner, T. A., & Fang, F. (2018). Implementation of machine-learning classification in remote sensing: An applied review. International Journal of Remote Sensing, 39(9), 2784–2817. https://doi.org/10.1080/01431161.2018.1433343
- Mountrakis, G., Im, J., & Ogole, C. (2011). Support vector machines in remote sensing: A review. ISPRS Journal of Photogrammetry and Remote Sensing, 66(3), 247–259. https://doi.org/10.1016/j.isprsjprs.2010.11.001
- Mustafa, Y. T., Habeeb, H. N., Stein, A., & Sulaiman, F. Y. (2015). Identification and mapping of tree species in urban areas using WorldView-2 imagery. ISPRS Annals of Photogrammetry, Remote Sensing and Spatial Information Sciences, II(2/W2), 175–181. https://doi.org/10.5194/isprsannals-II-2-W2-175-2015
- Mutanga, O., Adam, E., & Cho, M. A. (2012). High density biomass estimation for wetland vegetation using WorldView-2 imagery and random forest regression algorithm. International Journal of Applied Earth Observation and Geoinformation, 18, 399–406. https://doi.org/10.1016/j.jag.2012.03.012
- Myeong, S., Nowak, D. J., & Duggin, M. J. (2006). A temporal analysis of urban forest carbon storage using remote sensing. Remote Sensing of Environment, 101(2), 277–282. https://doi.org/10.1016/j.rse.2005.12.001
- Naicker, K., Cukrowska, E., & McCarthy, T. S. (2003). Acid mine drainage arising from gold mining activity in Johannesburg, South Africa and environs. Environmental Pollution, 122(1), 29–40. https://doi.org/10.1016/S0269-7491(02)00281-6
- Niska, H., Skon, J.-P., Packalen, P., Tokola, T., Maltamo, M., & Kolehmainen, M. (2010). Neural networks for the prediction of species-specific plot volumes using airborne laser scanning and aerial photographs. IEEE Transactions on Geoscience and Remote Sensing, 48(3), 1076–1085. https://doi.org/10.1109/TGRS.2009.2029864
- Novack, T., Esch, T., Kux, H., & Stilla, U. (2011). Machine learning comparison between WorldView-2 and quickbird-2-simulated imagery regarding object-based urban land cover classification. Remote Sensing, 3(10), 2263–2282. https://doi.org/10.3390/rs3102263
- Nowak, D. J., Crane, D. E., Stevens, J. C., Hoehn, R. E., Walton, J. T., & Bond, J. (2008). A ground-based method of assessing urban forest structure and ecosystem services. Arboriculture and Urban Forestry, 34(6), 347–358. https://doi.org/10.2737/NRS-RB-9
- Odindi, J., Mutanga, O., Rouget, M., & Hlanguza, N. (2016). Mapping alien and indigenous vegetation in the KwaZulu-Natal Sandstone Sourveld using remotely sensed data. Bothalia, 46(2). https://doi.org/10.4102/abc.v46i2.2103
- Paap, T., Burgess, T. I., & Wingfield, M. J. (2017). Urban trees: Bridge-heads for forest pest invasions and sentinels for early detection. Biological Invasions, 19(12), 3515–3526. https://doi.org/10.1007/s10530-017-1595-x
- Paap, T., de Beer, Z. W., Migliorini, D., Nel, W. J., & Wingfield, M. J. (2018). The polyphagous shot hole borer (PSHB) and its fungal symbiont Fusarium euwallaceae: A new invasion in South Africa. Australasian Plant Pathology, 47(2), 231–237. https://doi.org/10.1007/s13313-018-0545-0
- Pal, M. (2005). Random forest classifier for remote sensing classification. International Journal of Remote Sensing, 26(1), 217–222. https://doi.org/10.1080/01431160412331269698
- Palinkas, L. A., Horwitz, S. M., Green, C. A., Wisdom, J. P., Duan, N., & Hoagwood, K. (2015). Purposeful sampling for qualitative data collection and analysis in mixed method implementation research. Administration and Policy in Mental Health and Mental Health Services Research, 42(5), 533–544. https://doi.org/10.1007/s10488-013-0528-y
- Pautasso, M., Schlegel, M., & Holdenrieder, O. (2015). Forest health in a changing world. Microbial Ecology, 69(4), 826–842. https://doi.org/10.1007/s00248-014-0545-8
- Puissant, A., Rougier, S., & Stumpf, A. (2014). Object-oriented mapping of urban trees using random forest classifiers. International Journal of Applied Earth Observation and Geoinformation, 26, 235–245. https://doi.org/10.1016/j.jag.2013.07.002
- Qian, Y., Zhou, W., Yan, J., Li, W., & Han, L. (2014). Comparing machine learning classifiers for object-based land cover classification using very high resolution imagery. Remote Sensing, 7(1), 153–168. https://doi.org/10.3390/rs70100153
- Raczko, E., & Zagajewski, B. (2017). Comparison of support vector machine, random forest and neural network classifiers for tree species classification on airborne hyperspectral APEX images. European Journal of Remote Sensing, 50(1), 144–154. https://doi.org/10.1080/22797254.2017.1299557
- Räsänen, A., Rusanen, A., Kuitunen, M., & Lensu, A. (2013). What makes segmentation good? A case study in boreal forest habitat mapping. International Journal of Remote Sensing, 34(23), 8603–8627. https://doi.org/10.1080/01431161.2013.845318
- Richardson, J. J., & Moskal, L. M. (2014). Uncertainty in urban forest canopy assessment: Lessons from Seattle, WA, USA. Urban Forestry & Urban Greening, 13(1), 152–157. https://doi.org/10.1016/j.ufug.2013.07.003
- Ryan, J., Estefan, G., & Rashid, A. (2007). Soil and plant analysis laboratory manual. ICARDA.
- Salih, A. A. M., Ganawa, E.-T., & Elmahl, A. A. (2017). Spectral mixture analysis (SMA) and change vector analysis (CVA) methods for monitoring and mapping land degradation/desertification in arid and semiarid areas (Sudan), using Landsat imagery. The Egyptian Journal of Remote Sensing and Space Science, 20, S21–S29. https://doi.org/10.1016/j.ejrs.2016.12.008
- Schäffler, A., & Swilling, M. (2013). Valuing green infrastructure in an urban environment under pressure — The Johannesburg case. Ecological Economics, 86, 246–257. https://doi.org/10.1016/j.ecolecon.2012.05.008
- Seiferling, I., Naik, N., Ratti, C., & Proulx, R. (2017). Green streets − Quantifying and mapping urban trees with street-level imagery and computer vision. Landscape and Urban Planning, 165, 93–101. https://doi.org/10.1016/j.landurbplan.2017.05.010
- Shojanoori, R., Shafri, H. Z. M., Mansor, S., & Ismail, M. H. (2016). The use of WorldView-2 satellite data in urban tree species mapping by object-based image analysis technique. Sains Malaysiana, 45(7), 1025–1034.
- Thanh Noi, P., & Kappas, M. (2017). Comparison of random forest, k-nearest neighbor, and support vector machine classifiers for land cover classification using sentinel-2 imagery. Sensors, 18(1), 18. https://doi.org/10.3390/s18010018
- Turton, A., Schultz, C., Buckle, H., Kgomongoe, M., Malungani, T., & Drackner, M. (2006). Gold, scorched earth and water: The hydropolitics of Johannesburg. Water Resources Development, 22(2), 313–335. https://doi.org/10.1080/07900620600649827
- Tyrväinen, L., Pauleit, S., Seeland, K., & de Vries, S. (2005). Benefits and uses of urban forests and trees. In Urban forests and trees (pp. 81–114). Springer. https://doi.org/10.1007/3-540-27684-X_5
- Tyson, P. D., & Wilcocks, J. R. N. (1971). Rainfall variation over Johannesburg—the local climate over Johannesburg. University of Witwatersrand.
- van Wilgen, B. W., & Richardson, D. M. (2014). Challenges and trade-offs in the management of invasive alien trees. Biological Invasions, 16(3), 721–734. https://doi.org/10.1007/s10530-013-0615-8
- Vapnik, V. N. (1995). The Nature of Statistical Learning Theory. Springer2 Verlag.
- Waser, L. T., Küchler, M., Jütte, K., & Stampfer, T. (2014). Evaluating the potential of WorldView-2 data to classify tree species and different levels of ash mortality. Remote Sensing, 6(5), 4515–4545. https://doi.org/10.3390/rs6054515
- Yan, J., Zhou, W., Han, L., & Qian, Y. (2018). Mapping vegetation functional types in urban areas with WorldView-2 imagery: Integrating object-based classification with phenology. Urban Forestry & Urban Greening, 31, 230–240. https://doi.org/10.1016/j.ufug.2018.01.021
- Zengeya, T., Ivey, P., Woodford, D. J., Weyl, O., Novoa, A., Shackleton, R., Richardson, D., & van Wilgen, B. (2017). Managing conflict-generating invasive species in South Africa: Challenges and trade-offs. Bothalia-African Biodiversity & Conservation, 47(2), 1–11. http://dx.doi.org/10.4102/abc.v47i2.2160
- Zhang, C., Chen, Y. L., & Lu, D. S. (2015). Mapping the land-cover distribution in arid and semiarid urban landscapes with landsat thematic mapper imagery. International Journal of Remote Sensing, 36(17), 4483–4500. https://doi.org/10.1080/01431161.2015.1084552