
 ?Mathematical formulae have been encoded as MathML and are displayed in this HTML version using MathJax in order to improve their display. Uncheck the box to turn MathJax off. This feature requires Javascript. Click on a formula to zoom.
Abstract
Adoption of mobile money technology in peripheral regions of Africa where conventional banking services are entirely lacking is very important for financial inclusion. Although the population of mobile money users has recently increased, its adoption in rural areas remains low. This study investigates the determinants of mobile money adoption in rural areas of Africa. Data from Research ICT Africa Access Survey were analysed with the two-part model. The first part involves the adoption of mobile money; second part, how much money was sent or received using mobile money. Relative to other means of sending or receiving money, 88%, 83%, 78%, 80%, and 89% agreed that mobile money is easier, safer, more trustworthy, more convenient, and faster, respectively. Two-part model findings show that age, years of education, unemployment, and ownership of bank accounts explain both the adoption and the amount of money sent using mobile money technology. Conversely, age, bank account ownership, and net monthly income determine both the adoption of mobile money and the amount of money received using mobile money technology. We recommend that mobile money operators target rural dwellers that are young and educated with a net monthly income in their marketing strategies in order to encourage its adoption among the unbanked.
PUBLIC INTEREST STATEMENT
Mobile money is fast becoming the technology of choice in ensuring financial among previously unbanked population in rural areas across the world. This is due in part to exponential growth in mobile phone ownership and the ease, convenience, security, speed and cost-effectiveness that accompany mobile money adoption among the poor. This study aims to investigate the factors that explain the usage of mobile money in rural areas of Africa. The study analysed data collected in 10 countries across Africa and used tables and charts to display the results of descriptive statistics and two-part model. Results show that 88%, 83%, 78%, 80% and 89% of respondents agreed that mobile money is easier, safer, more trustworthy, more convenient and faster, respectively, to other means of payment. Findings show that age, marital status, education, employment, bank account and mobile phone ownership determine the adoption of mobile money in rural areas of Africa.
1. Introduction
Mobile money technology (MMT) is used for sending or receiving payment through mobile phones. It involves financial innovation that makes use of Short Message Service (SMS) technology to remunerate providers of different services using a commission system (Upadhyay & Jahanyan, Citation2016). Through MMT, financial and banking transactions such as remittances transfers, airtime purchase, utility bill, school fees payments, savings and mobile banking can be performed (IFC, Citation2011). MMT also makes use of unconventional banking instruments to bring financial services to unbanked subscribers in rural and remote areas. Mobile money speed up money transfer since payment is made through an electronic medium (Morawczynski, Citation2009). The proliferation of MMT has brought about access to markets, prices and weather data, as well as facilitating access to financial services for the unbanked population (Trendov et al., Citation2019).
Mobile money services facilitate distant payments. They are often designed specifically to facilitate payment transfer between distant individuals. In developing countries, domestic transfers are mainly from urban to rural areas. In African countries, particularly in rural areas, there is evidence that suggests that mobile money has improved rural household incomes through remittances from urban areas (Kikulwe et al., Citation2014). More so, the fact that the use of mobile money funds is protected by Personal Identification Numbers (PIN codes) makes it a secure means of savings for rural populations who have limited access to formal financial institutions and face risks caused by traditional means of money transfer and savings (Jack & Suri, Citation2011; Kikulwe et al., Citation2014).
Both increases in mobile phones and network coverage have caused mobile and network operators (MNOs) to undertake the provision of MMT in Africa (Aggarwal & Klapper, Citation2012). Notwithstanding such enterprises, adoption of MMT in Africa cannot be considered widespread—at 70% (Obgonna, Citation2013). This level of adoption has been attributed in part to lack of trust, sensitization, training, experience, and fear of erratic internet connectivity services. Other impediments to MMT adoption are fraudulent activities, network interruptions, unreliable service quality, inefficient system delivery, insufficient number of agents, and low liquidity (Mwesigwa, Citation2013). Although mobile financial services have linked mobile network operators with banks virtually in all countries in sub-Saharan Africa, there exists a huge and vibrant informal cash economy (Uduma, Citation2012).
Nevertheless, sub-Saharan Africa has the largest number of registered mobile money accounts in the world, at around 400 million, and most unbanked adults own a mobile phone (World Bank, Citation2020). Currently, governments across Africa are using mobile money platform to transfer cash to their citizens’ mobile accounts as a palliative response to COVID-19. Some are also implementing social protection programs using mobile money to support workers, especially those in the informal sector (World Bank, Citation2020). For instance, in Kenya, the government approved fee waivers on person-to-person mobile money transactions on M-PESA and proposed the implementation of 100 per cent tax relief for people earning less than KSh 24,000 (World Bank, Citation2020). Similarly, Ghana also suspended financial charges of all mobile money transfers that do not exceed GH¢100 for three months (Gentilini et al., Citation2020). In addition, the Central Bank of West African States also provided more flexible measures to open mobile money accounts and conduct personal transfers, to promote the use of electronic payment tools in Benin, Burkina Faso, Côte d’Ivoire, Guinea-Bissau, Mali, Niger, Senegal, and Togo (World Bank, Citation2020).
In spite of the enormous opportunities mobile money offers its users and costs that might be incurred by non-users, several factors tend to prevent its widespread adoption. Even though mobile money usage is growing faster in Africa compared to other regions in the world (Global System for Mobile communications Association (GSMA), Citation2019), low adoption persists across the continent (Kikulwe et al., Citation2014; Kikulwe et al., Citation2013). Given that not all persons, particularly in rural areas, use mobile money, there is a need to understand the drivers of adoption of mobile money in these rural areas where financial exclusion is prevalent. Hence, we considered an uneven level of adoption of mobile money across Africa; a research problem worthy of further investigation in this study.
In view of the foregoing, this study aims to determine factors explaining the adoption of mobile money technology in rural areas of Africa. Although several country-specific studies have been implemented across Africa (Okello et al., Citation2019), all of these studies are context-based and cannot be said to be representative of the entire continent. Therefore, a continent-wide study of this nature becomes imperative because of the strategic role of mobile money in facilitating financial inclusion among the unbanked in peripheral regions of Africa. Moreover, some studies have also recommended the investigation of mobile money adoption at a much broader scope (Okello et al., Citation2019). Therefore, this study adopted a unique dataset collected across 10 countries, which is representative of the rural population within African continent.
In conclusion, four specific research questions were answered, namely: (i) What are the major mobile money services patronised in rural areas of Africa? (ii) How does mobile money services compare with other means of transferring payment in rural areas of Africa? (iii) What is the attitude of users and reasons for non-users for using and/or not using mobile money services in rural areas of Africa? (iv) What are the factors influencing the usage and extent of money sent or received using mobile money? This study’s contribution to literature is threefold. First, we employed a large continental-wide data that cut across 10 countries thus permitting generalization of findings to the entire rural areas in Africa. Second, our study determines factors influencing the decision to use or not to use mobile money services. Third, we identified the determinants of the intensity of usage (measured by the amount of money actually sent or received) of mobile money services in the rural areas of Africa.
In the following section, we reviewed the empirical literature on mobile money technology adoption across Africa and beyond. Also, we present the Technology Acceptance Model and describe its application to mobile money adoption. Following this, we describe the study design, data and analytical approach in Section 3. In Section 4, we present the results of our analysis, the theoretical model and discussion of findings. In the final section, we summarize the study results presented in this paper and offer some concluding remarks and suggestions for future research.
2. Literature review
In sub-Saharan Africa, the level of financial inclusion still falls behind other parts of the world with only 25% of the adult population owning a bank account (Costa & Ehrbeck, Citation2015) in contrast to 39% of the population in Latin America and the Caribbean countries (Blechman, Citation2016). To stimulate economic growth and alleviate poverty, microfinance policies that target financial inclusion have been put in place (Demirgüç-Kunt & Klapper, Citation2012). To this end, mobile money offers the prospect for facilitating banking sector efficiency through the provision of micro banking services within the expedience of the customers. According to Suri and Jack (Citation2016), mobile phones can provide efficient financial services to the lower end of the market. Moreover, mobile technological innovation can also ensure efficient loan disbursements, repayments and safeguard savings exclusively using mobile money (Kikulwe et al., Citation2013).
Despite the growing usage of MMT, adoption is often conditional on access to pertinent information. Previous studies using technology acceptance theory put forward by Davis (Citation1989) observe that the adoption process begins exclusively with knowledge of specific technology and subsequently by the decision to either reject or adopt the technology. Similarly, Zhou et al. (Citation2010) opine that information relating to technology is a necessary impetus that must precede the adoption of any technological innovation. Nevertheless, by its make-up, mobile phone is regarded as the connection between inventors and adopters that enhances the flow of information (Chauhan, Citation2015). Indeed, mobile phone technology has been proven to have a higher tendency to create technology awareness than traditional information dissemination media such as newspapers and radio (Donovan, Citation2012).
Previous researchers have also confirmed that mobile phone technologies enhance the livelihoods of rural communities in developing countries. Murendo and Wollni (Citation2016) found that the adoption of new mobile technologies has the potential to increase agricultural productivity. In their study on the effects of information service on crop varieties, Kirui et al. (Citation2012) noted that information received through mobile phone assists farmers to increase their yields. Moreover, Batista and Vicente (Citation2018) and Batista and Vicente (Citation2020) show that the randomized introduction of mobile money in rural areas of Mozambique decreased the transaction costs of migrant remittances so that these not only improved insurance to shocks but also prompted increased migration out of rural areas. Also, Global System for Mobile communications Association (GSMA) (Citation2017) confirms that mobile money contributes to some of the United Nations SDGs by lifting poor people out of poverty and empowering underserved segments of the population.
Given the restricted traditional financial access specifically in rural areas, alongside with low infrastructure levels in developing countries, it has been widely admitted that financial institutions should take advantage of advanced telecommunication technology, such as mobile phones, to enhance financial accessibility (Mas & Kumar, Citation2008). Additionally, N’dria and Kakinakac (Citation2020) established evidence supporting the important role of mobile money in enhancing the positive effects of financial inclusion in Burkina Faso. Precisely, N’dria and Kakinakac (Citation2020) confirmed that the prevalence of financial inclusion through mobile money improves the welfare status related to nutrition, healthcare, and education for poor people, which helps achieve some of the 17 goals of the SDGs.
2.1. Technology acceptance model
In the last three decades, various models have been put forward to investigate and explain people’s intention to accept and use technology (see Feng et al., Citationin press; Rahimi et al., Citation2018). During this period, robust measures have also been developed to “fit” technology with user tasks and validate the task–technology fit instruments (Coiera, Citation2015). Of these models, the technology acceptance model (TAM) has been considered as parsimonious and powerful theory (Lucas & Spitler, Citation1999; Venkatesh & Davis, Citation2000), which is widely used to determine the factors influencing the acceptance of technology across the world (Goh & Wen, Citation2020; Rafique et al., Citation2020) and in various fields like m-shopping (Hubert et al., Citation2017), e-learning (Jeong, Citation2011), online libraries (Zhao et al., Citation2015), digital libraries (Zha et al., Citation2015), and mobile library applications (Rafique et al., Citation2018)
The TAM, which was originally proposed by Davis (Citation1986) was adapted from the Theory of Reasoned Action (TRA) (Ajzen & Fishbein, Citation1980), which postulates that human behaviour is determined by Behavioural Intention (BI) while on the contrary, BI is influenced by subjective norms and attitude (Ajzen & Fishbein, Citation1977). In its basic form, TAM postulates that PU and PEOU are the factors that influence BI (Venkatesh & Davis, Citation2000), and that their impact is assumed to be positive. PU is defined as “the degree to which a person believes that using a particular system would enhance his or her job performance” (Davis, Citation1989, p. 320). PEOU, however, is concerned with “the degree to which a person believes that using a particular system would be free of effort” (Davis, Citation1989, p. 320). The term “effort” refers to a finite source, which an individual allots to using a technology for performing several activities, and for or exploring information (Cheng, Citation2012).
In 2000, Venkatesh and Davis (Citation2000) and Venkatesh (Citation2000) developed TAM II, which was a new version of the initial TAM. TAM II combines the foregoing efforts, and indicated the previous request for the model’s elaboration. It plainly defines what constitutes external variables of PU and PEOU, and made available a solid means to promote the multi-level model. For instance, Venkatesh and Davis (Citation2000) define the external variables of PU as social influence (i.e. subjective norms) and cognitive instruments (job relevance, image, quality, and result demonstrability). Whereas Venkatesh (Citation2000) explains the external variables of PEOU, as anchor (computer self-efficacy, perceptions of external control, computer anxiety, and computer playfulness) and adjustments (perceived enjoyment and objective usability). The joint efforts of these studies yielded increased variance of 60% for PEOU (R2 = 0.6) and 40% to 60% for PU (R2 = 0.4 ~ 0.6), while at the same time the variance of intention increased to 60% (R2 = 0.6) (Lee et al., Citation2003)
Furthermore, in 2003, Venkatesh et al. (Citation2003) put forward a unified model called the “unified theory of acceptance and use of technology” (UTAUT)—anchored on studies of eight important models of Acceptance and Use of Technology (UTAUT) by summarizing eight closely related models (namely: TRA, TAM, motivational model, TPB, a model combining TAM and TPB models, PC utilization model, innovation diffusion theory, and SCT) which all together comprises 32 related constructs. The UTAUT is put together with four core factors of intentions and usage: performance expectancy, effort expectancy, social influence, and facilitating conditions, alongside with four mediators of key relationships: gender, age, experience, and voluntariness of use.
Lastly, in 2008, apparently after noticing the inherent weaknesses in the previously proposed models, Venkatesh and Hillol (Citation2008) later developed a new integrated model named TAM3, which combined TAM2 proposed by Venkatesh and Davis (Citation2000) and the model of the determinants of PEOU (which was initially based on computer self-efficacy, computer anxiety, computer playfulness, and perceptions of external control (or facilitating factors), and subsequently adjusted to incorporate perceived enjoyment and objective usability) (Venkatesh, Citation2000). Almost a decade after the formulation of UTAUT, Venkatesh et al. (Citation2012) developed UTAUT2 by integrating hedonic motivation, price value and habits into UTAUT.
3. Methodology
3.1. Data Collection and sampling procedure
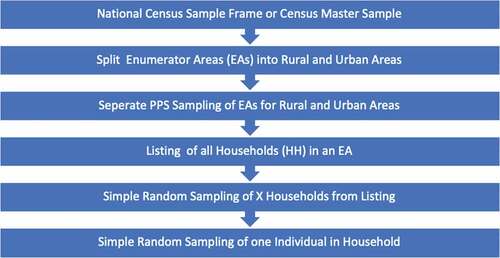
This study adopts a secondary data collected by Research ICT Africa. The data was collected using face-to-face survey, employed random sampling for individuals based on Census sample frames. Ten countries, namely Ghana, Kenya, Lesotho, Mozambique, Nigeria, Rwanda, Senegal, South Africa, Tanzania, and Uganda participated in the survey. Each country was divided by Census into Enumerator Areas (EAs) which roughly has a household density of 200. Five steps as shown in Figure were employed in identifying individuals that participated in the survey. In the first step, the national census sample frames were used to split each country into urban and rural Enumerator Areas (EAs). The second step involves stratification of Enumerator Areas using Probability Proportional to Size (PPS). The third step encompasses the listing and compilation of two EAs, one for households and one for businesses (not included in our analysis). The listings served as the sample frame for the simple random selections of households and businesses. Step four involves the sampling of households using a simple random sample for each selected EA. Lastly, step 5 involves the selection of one member of a household that is 15 years or older or a visitor staying the night at the house based on simple random sampling. The sampling procedure is presented in Figure :
Figure 1. Sampling procedure employed by RIA ICT for identifying study respondents.
Weights were constructed for each individual that participated in the study. The individual weight is based on the inverse selection probabilitiesFootnote1 and the data was grossed up to a national level when the weight is applied in the analysis. The individual weight is calculated using Equationequation 1(1)
(1) :
Where:
= individual weight;
DW = design weight compensation for oversampling or under-sampling of rural EAs;
= Household selection probability;
= Enumeration Area (EA) selection probability;
= Individual selection probability.
Since the two-pm model is compatible with complex survey design (Belloti et al., Citation2015), the individual weight was incorporated in the two-pm model using svyset command in Stata 15 SE. The distribution of respondents across rural areas of the 10 countries that were included in the study analysis is presented in Table :
Table 1. Distribution of respondents across countries
3.2. Estimation technique and data
To estimate the adoption of MMT, the study adopted the two-part model (Belloti et al., Citation2015). The first part involves the identification of respondents who have used mobile money services in the past and those who never used it. This first part is estimated with the logit model. Following this, the study further attempted to investigate the effect of the amount of money sent or received using mobile money services and this is estimated using the Ordinary Least Square model. Essentially, this was implemented to determine the extent to which respondents commit their money when sending or receiving using mobile money. With the two-part model, we also show the impact of the explanatory variables at each stage of the decision in the adoption of MMT. This involves the decision to use mobile services and the decision to send or receive a particular amount of money while using the mobile money service. Presented in Equationequation 2(2)
(2) is the outline of the two-part model.
First part
In the first part, the logit model is regressed and specified as;
P represents the probability that a respondent uses mobile money service. The responses are coded as 1 if a respondent uses mobile money services and 0 otherwise.
The second part
In part 2, the Ordinary Least Square model is estimated which is presented as shown in Equationequation 3(3)
(3) ;
where is a row vector of K of i individual characteristics, b is a set of the parameter to be estimated and
is the error term. The ordinary least square regression measures the maximum amount of money sent or received using mobile money services. The model is estimated using RIA ICT Access Survey 2017–2018 data. The survey was conducted by Research ICT Africa based on multi-stage probability sampling. Information is provided on the mobile money services patronised by the respondents that participated in the study. The description of the variables included in the two-part model is presented in Table .
Table 2. Description of the variables included in the empirical model
4. Results
In this section, we present the descriptive statistics on the sample, uses of mobile money, comparison of mobile money with other means of payment, and users and non-users’ perceptions of MMT in the rural areas of Africa. We then identified the determinants of using mobile money for sending and receiving payment using the two-part model described in Section 3.
4.1. Descriptive results
Descriptive analysis was used to show the characteristics of the study population. The results of the descriptive statistics are presented in Table . Majority of the respondents equivalent to 56% are females, while males constitute 44%. As regards age distribution of the respondents, 42% are below 31 years old whereas 35% and 23% of the respondents fall within the age groups of ‘31–50ʹ and “above 50 years”, respectively. The marital status distribution shows that the majority (54%) of the study participants are married, 30% are single and the remaining 16% are either divorced, separated or widowed. More than half (53%) of the study population completed primary education. Twenty-two per cent (22%) had no formal education whatsoever, but 19% and 6% completed secondary and tertiary education, respectively.
Table 3. Descriptive statistics of the variable used in the study
Furthermore, one out of five persons (20%) in the rural areas of Africa is unemployed. This unemployment rate is moderately lower than what obtains in South Africa and Nigeria- the largest two economies in Africa. At least, 62% of the study population earn less than USD30 monthly whereas 38% receive a monthly income of USD30 or more. The income distribution is an indication of poverty and low quality of lives where people live below USD1 per day. In terms of access to bank accounts, vast majority (80%) of the respondents are without access to bank accounts while 20% have bank accounts or have access to bank accounts. This implies that the vast majority of our study population are excluded from financial services in rural areas of Africa.
Majority of the respondents (62%) own mobile phones, and about 38% answered “no” when asked if they owned a mobile phone. When asked if respondents know about mobile money, 51 of the respondents (51%) say “yes” while the remaining half (49%) say “no”. Concerning the patronage of mobile money service, 40% use mobile money, 4% utilise mobile banking, 3% use both mobile money and 52% do not use any of the mobile money services. This result indicates that the majority of the respondents are yet to adopt mobile money technology, which clearly shows that MMT adoption is not widespread in the rural areas of Africa. On average, respondents send USD8.25 and receive USD10.20 monthly using mobile money in the rural areas of Africa
4.2. Uses of mobile money in rural areas of Africa
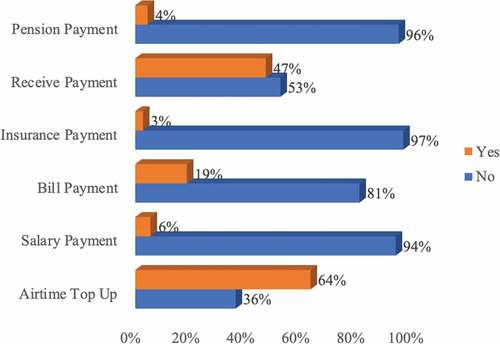
The various uses of mobile money services in rural areas of Africa are presented in Figure where the majority of the respondents (64%) use mobile money for airtime top-up. A previous study by Batista and Vicente (Citation2018) reported that early adopters of mobile money service mostly use it to purchase airtime and 60% of the target individuals who participated in the first year of their study used mobile money for airtime purchase. However, this prominence tends to decline as the number of years of mobile money usage increases. Regarding mobile money usage in rural areas of Africa, the next common usage after airtime top-up is for receiving payment. About 47% of the respondents receive payments using mobile money service. According to InterMedia (Citation2013), mobile money is used for receiving remittances to provide financial support to family members living in different households. Another innovative way of receiving payment using mobile money is the use of prepaid airtime or scratch cards (also known as “e-vouchers”) as a sort of virtual currency, in the rural areas of Nigeria and Kenya (Omwansa, Citation2009). Moreover, 19% of the respondents use mobile money to pay their bills. Common bills that are paid using mobile money in African rural areas include payment of utility bills and payment for goods and services (Subia & Martinez, Citation2014). The remaining respondents use mobile money for salary payment (6%), pension payment (4%) and insurance payment (3%).
Figure 2. Uses of mobile money services in rural areas of Africa.
4.3. Comparison of mobile money with other methods of payment
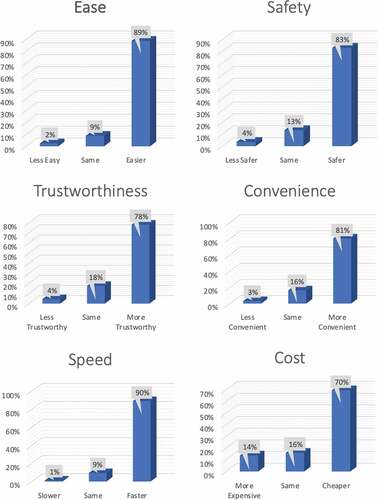
In this section, mobile money services are compared with other means of sending or receiving payment using six indicators of ease, safety, trustworthiness, convenience, speed and cost of usage. The result is then presented in Figure . The vast majority of the respondents represented by 90% and 89% agreed that mobile money is faster and easier than other means of transferring money. A study on M-PESA—the Kenyan mobile money service—affirmed that speed, cheapness, safety, and simplicity characterise the services of mobile money (Jack & Suri, Citation2011; Mas & Morawczynski, Citation2009). For the safety of money transfer using mobile money, 83% confirmed that mobile money is much safer compared with other methods of payment. Mobile money is safe because cash wages pose risks to both employees and employers. Using mobile money reduces the need for rural dwellers to keep cash on hand or make bank trips, both of which have a higher theft risk but mobile money offers a cost-effective and trackable way to manage payment.
Additionally, mobile money can also be a safer way of storing wealth in various forms particularly during the time of natural disasters, and some mobile money schemes in evolving markets are also being adopted as a form of savings vehicle (OCAIC, Citation2010). Concerning the convenience of mobile money usage, 81% of the respondents agree that mobile money is comparatively more convenient than other means of payment. This result corroborates the finding of Yunus et al. (Citation2016) where most of the respondents believed that mobile money could be a very beneficial initiative and considered saving money through mud or plastic-made banks as outdated. Lastly, 78% consider mobile money to be trustworthy and 70% agree that mobile money is cheaper when compared with other means of transferring money.
Figure 3. Comparison of mobile money with other means of money transfer.
4.4. Perceptions of mobile money users and reasons for non-users
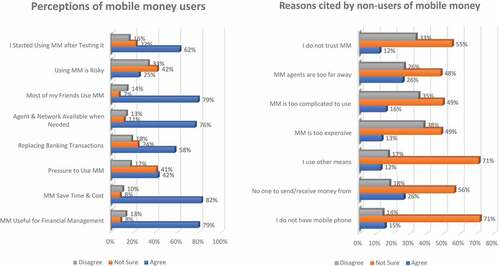
The perceptions of mobile money service users and the reasons for non-users are presented in Figure . Eighty-two per cent (82%) of the mobile money users agree that mobile money saves time and cost. In terms of time, our result aligns with Obiero (Citation2016) who found that it takes lesser time for rural people to reach mobile money agents than reaching a brick and mortar bank branch or to the conventional bank agents. However, Obiero (Citation2016) also discovered that those in rural areas may pay slightly more to a mobile money agent. This contradicts the affirmation of 82% of the respondents in our study that mobile money saves cost. In terms of financial management, 79% of the users affirm that mobile money is useful for financial management. Evidence from the rural area of Africa indicates that the introduction of mobile banking improves financial literacy and trust, while also replacing traditional means of saving and transferring remittances (Batista & Vicente, Citation2018). Moreover, mobile money facilitates financial management by helping customers to achieve financial resilience through saving (Du, Citation2019).
Another factor that can influence mobile money users’ perception is its usage among friends. About 79% of the respondents reveal that most of their friends use mobile money. According to Uzzi and Lancaster (Citation2003), close friends are well suited to transfer mobile financial skills because they understand each other’s learning needs. Also, a majority (75%) of the users agree that mobile money agents are always available. Lashitew et al. (Citation2019) opined that mobile money accessibility and other convenience advantages are proportional with the ubiquity of agents, who provide customer services such as handling cash deposits and withdrawals. Further, the success of mobile money providers in rural areas depends on building an extensive agent network to reach potential customers in remote towns and villages (Lashitew et al., Citation2019). Before using mobile money, 62% of the respondents tested it before committing money to it and 58% consider mobile money as a replacement for traditional banking transactions. Whereas 33% agree that mobile money is risky and 42% are pressured into using mobile money. Only 15% are contemplating whether to stop using mobile money soon. Several challenges that hinder the use of mobile money among rural people in Africa are also presented in Figure . The most cited reasons for not using mobile money among non-users are agents being far away (26%) and having no one to send money to or receive from (26%).
Figure 4. Perception of mobile money users and reasons cited by non-users of mobile money.
4.5. Determinants of sending and receiving payments through mobile money
Factors determining the adoption of mobile money for sending and receiving payment are presented in Tables and below. Due to the disproportionate usage of mobile money services across Africa and within countries (Demirgüç-Kunt & Klapper, Citation2012), we estimate a two-part model with cluster-correlated standard errors to control correlated effects at the country level. We also show the marginal (or incremental) effects for the combined logit and OLS regression of the two-part model. The empirical model results indicate that age, years of education, unemployment, and ownership of bank accounts explain both the adoption of mobile money and the amount of money sent using MMT. However, being married, net monthly income and ownership of mobile phones only determine the adoption of mobile money for payments. Conversely, age, bank account ownership and net monthly income determine both the adoption of mobile money and the amount of money received using MMT.
Table 4. Determinants of sending payment through mobile money
Table 5. Determinants of receiving payment through mobile money
In Table , the variable “age” is significant at 5% with negative estimated coefficients in the first part and significant at 1% with a positive coefficient in the second part model. This inverse relationship implies that the younger the respondent; the higher the probability of adopting MMT. However, the amount of money sent using the technology, conditional on adopting it, tends to increase with the age of the respondent. In previous studies, mixed results have been reported, for instance, Afawubo et al. (Citation2020) in Togo observed a positive relationship between age and the adoption of mobile money whereas Mbiti and Weil (Citation2011) in Kenya reported an inverse relationship when investigating the effect of age on mobile money usage. The marginal effect of age averages 0.05 USD per year of age. The opposite signs of the coefficients of age in the first and second model imply that the joint test of significance might be significant even if the marginal effect is insignificant (Belloti et al., Citation2015).
In Table , a similar result is observed with respect to the effect of age on receiving payment through mobile money. The estimated coefficient for age is negative in the first part at 10% and positive in the second part at 1% in this model. This implies that younger people are less likely to adopt MMT for receiving payment when compared with the older people. However, the amount of money received using the technology, conditional on adopting it, tends to increase with age. The marginal effect averages 0.07 per year of age and the opposite signs of the coefficients in the two parts imply a joint test of significance.
The variable “married” is only significant in the first part model in both Tables and . In Table , the coefficient estimate of being married is positive and significant at 5%. This means that individuals that are married are more likely to adopt mobile money than those that are single, separated, divorced or widowed. The marginal effect shows that the married sent more payment than other marital status groups with about 2.54 USD. In Table , the coefficient of the variable “married” is positive and significant at 10%. Although the marginal effect is insignificant, since the coefficients in the two-part model show opposite signs, we interpret the marginal effect to imply that; the married receive more payment than other marital status groups with about 1.36. USD
In the determinants of sending payment model, the coefficient estimates of the years of education are both positive and significant at 10% in parts. The probability of sending payment and the amount sent, conditional on any amount sent, increases with years of formal education. The marginal effect of years of education averages 0.43 USD per year of education. This finding corroborates Gichuki and Mulu-Mutuku (Citation2018), who also reported a positive coefficient estimate of the marginal effects of education on the adoption of money transfer services among women micro-entrepreneurs in Kenya. Nonetheless, in the determinants of receiving payment in Table , the years of education are insignificant in the first part but strongly significant at 1% with a positive coefficient estimate in the second part model. This implies that the amount of money received (conditional on receiving payment through mobile money) increases with years of formal education of the respondent. The marginal effect shows strong significance at 1% and averages 0.61 USD per year of education.
In Table , being unemployed indicates negative coefficient estimates and 5% significance in both parts. This means that both the probability of adopting and the amount sent using mobile money, conditional on adopting it, decrease with being unemployed. The marginal effect shows that the unemployed sent less payment than the employed people with about 6.76 USD. The first part result agrees with Afawubo et al. (Citation2020)’s finding that unemployed people are less likely to adopt mobile money in Togo. Similarly, being unemployed indicate negative coefficient estimates in the first part model and statistical significance of 10% in Table . This suggests that the likelihood of receiving payment through mobile money is less among the unemployed compared to the employed. The negative coefficient of marginal effect shows that the unemployed received 6.76 USD less than the employed.
Ownership of bank account shows a negative coefficient estimate in the first part model at 10% level of significance and positive coefficient estimate at 5% level of significance in the second part on Table . This means that the probability of sending payment through mobile money is less among respondents with bank accounts. Respondents with bank accounts tend to send more money using the technology. The marginal effect indicates that bank account owners sent more payment than people without bank accounts with about 1.76 USD. In the adoption of mobile money for receiving payment model, bank account ownership also indicates negative and positive coefficient estimate at 5% level of significance in the first and second part models, respectively. This means that the probability of receiving payment through mobile money is less among respondents with bank accounts and, conditional on receiving any amount, respondents with bank account tend to receive more money using mobile money. The marginal effect though insignificant shows that bank account owners receive more payment than the individuals without bank accounts with about 1.32 USD.
Table shows that the net monthly income coefficient estimate is positive and significant at 5% in the first part model only. This implies that the higher the net monthly income of the respondent, the higher the probability of adopting MMT for payment. The adoption model result contradicts the findings of Chowa et al. (Citation2012), and Mas (Citation2010), which indicates that individuals with low-income may find mobile money as accessible innovation and hence rely more on it to overcome predictable and unpredictable life events than people with high income. In Table , the net monthly income is positive in both models but significant at 5% in the first part model and 1% in the second part model. This means that the higher the net monthly income of the respondent, the higher the probability of receiving payment through mobile money (conditional on receiving any amount). Respondents with higher net monthly income will receive more money using the technology. The marginal effect of the coefficient of net monthly income is statistically significant at 10% with a positive coefficient of 0.005 USD. This result is similar to the findings of Kiconco et al. (Citation2019), which reported clear evidence that individuals with access to income are in an advantaged position to adopt MMT.
The estimate of the coefficient of ownership of mobile phone is also positive and statistically significant at 1% in the first part model. This indicates that respondents with mobile phone are more likely to adopt mobile money for sending payment. The observed coefficient of the marginal effect shows that a mobile phone owner will send 10.56 USD more than the person without a mobile phone. Our result on the effect of mobile phone on the adoption of mobile money shares similarity with the findings of Murendo et al. (Citation2018) that mobile phone ownership enhances access to information and facilitates the ease of mobile money. This is because households can register their accounts without locating a mobile money agent each time they wish to make a transaction. Lastly, the estimate of the coefficient of ownership of mobile phone is positive and statistically significant at 5% in the first part model. This reveals that respondents that own mobile phones are more likely to adopt mobile money for receiving payment. The observed coefficient of the marginal effect is strongly significant at 1% with a positive value, which shows that mobile phone owners will receive 11.98 USD more than individuals without mobile phones.
4.6. Average amount sent and received using mobile money monthly
With the margin post-estimation command in Stata 15 SE, the predicted margin of the average amount sent or received using MMT in rural areas of Africa was estimated and the results are presented in Table . The observed coefficients of the predicted margin of the total amount sent using mobile money per month is USD8.11 and USD10.24 per person. This amount sent and received using mobile money is considered close to the actual average amount of USD8.25 and USD10.20 as presented in Table . The result shows that the amount of payment sent (USD8.11) and received (USD10.24) per month through mobile money in rural areas of Africa is still very low and this might be due to the pervasiveness of poverty in the area.
Table 5. Mean monthly payment using mobile money
5. Discussion
The TAM model was applied to mobile money adoption to generate the empirical result presented in sub-section 4.5. The main reason for using TAM is to determine whether the independent variables included in the two-part model explain the dependent variable (adoption of mobile money). This was measured by the amount sent or received by a respondent through mobile money.
In line with Perceived Usefulness (PU) and Perceived Ease of Use (PEOU) of Technology Adoption Model, we observed that users of mobile money perceived it to be easy, safe, trustworthy, convenient, speedy and cost-effective in comparison to other means of sending or receiving payment in rural areas of Africa, which probably explain its growing adoption. This finding further confirms the previous proposition by Davis and Venkatesh (Citation1996), and Gefen and Straub (Citation2000) that technology attributes enhance its adoption. Broadly speaking, the results contribute to our understanding of the mobile money users perceptions of mobile money; however, mobile money operators main focus should be on the actual adoption behavior of mobile money users.
With respect to the effects of employment on the adoption of mobile money, we observed that unemployed individuals in the rural area of Africa as expected are less likely to send or receive payment through mobile money. This result is intuitively anticipated because an unemployed individual often does not have a regular income that may enable him or her to send a payment using mobile money. The fact that most countries in Africa do not have conditional and unconditional cash transfer for the unemployed as a social security safety net (Omilola & Kaniki, Citation2014) probably explains why unemployed do not use mobile money. However, they may still receive remittances through mobile money from their family and friends who work in urban areas or outside their countries.
Ownership of or access to bank account determines whether an individual will use mobile money for sending and receiving payment. Finding from this study shows that individuals that own or have access to bank accounts are unlikely to adopt mobile money for sending or receiving payments. Reasons for not adopting mobile money may be due to the fact that services rendered by mobile money are also provided by conventional banks. These services include among others, online cash transfer and receipt which may be done through mobile devices. Hence, using mobile money may be a duplication of services and costs. A comparable study by Fanta et al. (Citation2016) established that bank account ownership, access to ATMs, mobile banking, and internet banking are inversely related to mobile money ownership. Fanta et al. (Citation2016) also found that mobile money adoption is lower among those that own a bank account and also those who use ATMs, mobile banking, and internet banking to access their bank account.
Moreover, married people tend to adopt mobile money technology for sending and receiving payment than their single, divorced, or widow counterparts. According to Kusimba et al. (Citation2017), mobile money has been integrated into well-established cultural norms and practices to bring about the distribution of wealth through kin ties, flows of mobile money facilitate stronger ties among women, particularly women who act as bridge-builders between siblings and their families. Mobile money also brings about other economic relations identified with forms of care and support and operating through the kin ties formed by mothers and grandmothers, like transfers between a grandmother in a rural area and her daughter or son-in-law in the urban areas or outside the country.
With reference to the effect of income on the adoption of mobile money, we observed that low-income individuals are less likely to use mobile money for sending or receiving payment compared to high-income individuals. According to Coulibaly (Citation2019), greater use of mobile money technology by high-income users could be explained by the fact that a functioning mobile money account must be regularly used for transaction in form of sending, receiving, and making payments. Hence, mobile money accounts are usually more active and efficiently utilized when held by individuals in the highest income quintiles.
As expected, individuals with a mobile phone are more likely to adopt mobile money for sending payment since people without mobile lack the necessary device to carry out mobile money transactions. This finding is not far-fetched as mobile money services are communicated via mobile phones and services cannot be patronized without having access to or owning a mobile phone. In a similar study by Murendo et al. (Citation2015) on social network effects on mobile money adoption in Uganda, finding reveals that on the average, an additional mobile phone in the household increases the likelihood of mobile money adoption by 23.6% and that the contact with mobile-phone-based extension agents increases the probability of adopting mobile money by 22.3%.
Lastly, the average estimated amount sent or received using mobile observed in this study is USD8.11 and USD10.24 per person per month, respectively. These values reinforced the findings reported by Scharwatt (Citation2019), which established that mobile money is particularly compelling for low-value remittances in comparison to other similar remittance channels. In addition to the fact that the average value of remittance sent through mobile money tends to be much lower compared to those sent through alternative channels, transactions are also often more frequent. Our estimated average amount sent or received is comparatively low compared with US$80 globally reported by Scharwatt (Citation2019).
6. Recommendations, conclusions and limitations of the study
6.1. Conclusions and recommendations
We came to the following conclusions based on our initial research questions, the data analysis results and discussion. First, for the main uses of mobile money services in the rural areas of Africa: mobile money is mainly used for airtime top-up, receiving payment, bill payment, payment of salary, pension and insurance payment. Second, by comparing mobile money with other means of payment, the vast majority of the study population agree that mobile money is comparatively easier, safer, trustworthy, convenient, fast and cost-effective Third, users of mobile money technology perceive it as time-saving and a useful tool for financial management. Users also considered mobile money to be a replacement for banking transactions. While some users feel pressured by peers, family and friends to use mobile money, only a few perceived it to be risky and contemplate to stop using it soon. The most cited reasons for not using mobile money among non-users include no one to send or receive payment from; inaccessibility of agents; lack of mobile phones; mobile money complications and trust issues.
Lastly, the study employed the theory of Technology Acceptance Model (TAM) and Two-Part Model to empirically examine the drivers of mobile money adoption and the extent to which payment is sent and received using the technology in rural areas of Africa. The study identified age, years of education, unemployment, ownership of bank accounts and mobile phones as the main determinants of mobile money technology adoption. It is evident from the study findings that younger and educated rural dwellers in Africa patronise mobile money but amount sent or received through mobile money tend to increase with age and years of formal education attained. In view of this, it is recommended that mobile money service providers streamline their strategies to accord priorities to these cohorts of rural dwellers while designing a special package to attract the old and less educated. Ownership of bank accounts discourages the adoption of mobile money, whereas ownership of mobile phones encourages its use. We recommend that mobile money operators target rural dwellers that are young and educated with a net monthly income in their marketing strategies to encourage its adoption among the unbanked.
6.2. Limitations and suggestions for further studies
Despite the contribution of this study to knowledge, it is not without limitations as it is with previous studies. First, our analysis was restricted to the rural areas of Africa; a continental-wide study across rural and urban areas of Africa can be implemented to investigate the determinants of mobile money adoption. Second, previous studies like Gichuki & Mulu-Mutuku (Citation2018) and Kiconco et al. (Citation2019) reported positive relationships between bank accounts ownership and adoption but a negative relationship is reported in this study, which appears counterintuitive to us. Hence, a qualitative research is suggested to further investigate this finding.
Acknowledgements
The data analysed in this paper was collected by Research ICT Africa and documented and made available by DATAFIRST, University of Cape Town, South Africa. We would like to express our profound gratitude to RIA ICT Africa and DATAFIRST UCT for making the data available for public use. All the views and opinions expressed in this article are that of the authors and do not represent that of the University of Fort Hare, Research ICT Africa and DATAFIRST, UCT, South Africa.
Additional information
Funding
Notes on contributors
Babatope E. Akinyemi
Babatope E. Akinyemi is a Post-Doctoral Research Fellow and a part-time lecturer in the Department of Agricultural Economics and Extension, University of Fort Hare, South Africa. He is an Agricultural and Resource Economist with special interest in Sustainable Agriculture with emphasis on rural households’ food security while safeguarding environmental health.
Abbyssinia Mushunje
Abbyssinia Mushunje is a Professor of Agricultural Economics at the University of Fort Hare South Africa. He is the Head of the Department of Agricultural Economics and Extension at the same university. His recent research focus on land reform, farm efficiency, food security, climate change, ecotourism, and food system.
Notes
1. See UNSD (Citation2005) page 119 for a detailed discussion on sampling weights
References
- Afawubo, K., Couchoro, M. K., Agbaglah, M., & Gbandi, T. (2020). Mobile money adoption and households’ vulnerability to shocks: Evidence from Togo. Applied Economics, 52(10), 1141–21. https://doi.org/10.1080/00036846.2019.1659496
- Aggarwal, S., & Klapper, L. (2012). Designing government policies to expand financial in- clusion: Evidence from around the world. Unpublished working paper. World Bank.
- Ajzen, I., & Fishbein, M. (1977). Attitude-behavior relations: A theoretical analysis and review of empirical research. Psychological Bulletin, 84(5), 888–918. https://doi.org/10.1037/0033-2909.84.5.888
- Ajzen, I., & Fishbein, M. (1980). understanding attitudes and predicting social behavior. Prentice-Hall.
- Batista, C., & Vicente, P. C. (2018). NOVAFRICA Working Paper 1805. Is mobile money changing rural Africa? Evidence from a field experiment. Nova School of Business and Economics - Universidade Nova de Lisboa.
- Batista, C., & Vicente, P. C. (2020). Improving access to savings through mobile money: Experimental evidence from African smallholder farmers. World Development, 129, 104905. https://doi.org/10.1016/j.worlddev.2020.104905
- Belloti, F., Deb, P., Manning, W. G., & Norton, E. C. (2015). twopm: Two-part models. The Stata Journal, 15(1), 3–20. https://doi.org/10.1177/1536867X1501500102
- Blechman, J. G. (2016). Mobile credit in Kenya and Tanzania: Emerging regulatory challenges in consumer protection, credit reporting and use of customer transactional data. The African Journal of Information and Communication (AJIC), 17, 61-88.
- Chauhan, S. (2015). Acceptance of mobile money by poor citizens of India: Integrating trust into the technology acceptance model. Info, 17(3), 58–68. https://doi.org/10.1108/info-02-2015-0018
- Cheng, Y. M. (2012). Effects of quality antecedents on e-learning acceptance. Internet Research, 22(3), 361–390. https://doi.org/10.1108/10662241211235699
- Chowa, G., Masa, R., & Sherraden, M. (2012). Wealth effects of an asset-building intervention among rural households in Sub-saharan Africa. Journal of the Society for Social Work and Research, 3(4), 329–345. https://doi.org/10.5243/jsswr.2012.20
- Cobla, G. M., & Osei-Assibey, E. (2018). Mobile money adoption and spending behaviour: The case of students in Ghana. International Journal of Social Economics, 45(1), 29–42. https://doi.org/10.1108/IJSE-11-2016-0302
- Coiera, E. (2015). Guide to health informatics (3rd ed.). CRC Press.
- Costa, A., & Ehrbeck, T. (2015). A market-building approach to financial inclusion. Innovations, 10(1–2), 53–59. https://doi.org/10.1162/inov_a_00229
- Coulibaly, S. S. (2019). Financial inclusion through mobile money banking: An examination of the decision to use mobile money accounts in WAEMU countries. Department of Economics and Management. University Félix Houphouët Boigny of Abidjan-Cocody.
- Davis, F. D. (1986) Technology Acceptance Model for Empirically Testing New End-user Information Systems Theory and Results [Unpublished Doctoral Dissertation]. MIT.
- Davis, F. D. (1989, September). Perceived usefulness, perceived ease of use, and user acceptance of information technology. MIS Quarterly, 13(3), 319–340. https://doi.org/10.2307/249008
- Davis, F. D., & Venkatesh, V. (1996). A critical assessment of potential measurement biases in the technology acceptance model: Three experiments. International Journal of Human-computer Studies, 45(1), 19–45. https://doi.org/10.1006/ijhc.1996.0040
- Demirgüç-Kunt, A., & Klapper, L. (2012). Financial inclusion in Africa. An overview. Policy Research Working Paper. Development Research Group. Finance and Private Sector Development Team. The World Bank.
- Donovan, K. P. (2012). Mobile money, more freedom? The impact of M-PESA’s network power on development as freedom. International Journal of Communication, 6, 23. http://ijoc.org
- Du, L. (2019). Can mobile money boost financial inclusion in Southern Africa? Yale insights. Ideas from the Yale school of management. Yale Insights. Retrieved March 15, 2020, from https://insights.som.yale.edu/insights/can-mobile-money-boost-financial-inclusion-in-southern-africa
- Fanta, A. B., Mutsonziwa, K., Goosen, R., Emanuel, M., & Kettles, N. (2016). FinMark Trust Policy research paper No. 03/2016. The role of mobile money in financial inclusion in the SADC region. Evidence using FinScope Surveys. FinMark Trust.
- Feng, G. C., Su, X., Lin, Z., He, Y., Luo, N., & Zhang, Y. (in press). Determinants of technology acceptance: Two model-based meta-analytic reviews. Journalism & Mass Communication Quarterly. https://doi.org/10.1177/1077699020952400)
- Gefen, D., & Straub, D. (2000). The relative importance of perceived ease of use in IS adoption: A study of e-commerce adoption. Journal of the Association for Information Systems, 1(8), 1–28. https://doi.org/10.17705/1jais.00008
- Gentilini, U., Almenfi, M., & Orton, I. (2020, April 3). Social protection and jobs responses to COVID-19: A real-time review of country measures. Unpublished. The World Bank and ILO.
- Gichuki, C. N., Mulu-Mutuku, M. (2018). Determinants of awareness and adoption of mobile money technologies: Evidence from women micro entrepreneurs in Kenya. Women's Studies International Forum, 67, 18–22 doi:10.1016/j.wsif.2017.11.013
- Global System for Mobile communications Association (GSMA). (2017). State of the industry report on mobile money (Decade edition). 2006-2016. Technical Report. Global System for Mobile communications Association.
- Global System for Mobile communications Association (GSMA). (2019). State of the industry report on mobile money 2018. Technical Report. Global System for Mobile communications Association.
- Goh, E., & Wen, J. (2020). Applying the technology acceptance model to understand hospitality management students’ intentions to use electronic discussion boards as a learning tool. Journal of Teaching in Travel & Tourism, 1–13. https://doi.org/10.1080/15313220.2020.1768621
- Hubert, M., Blut, M., Brock, C., Backhaus, C., & Eberhardt, T. (2017). Acceptance of smartphone-based mobile shopping: Mobile benefits, customer characteristics, perceived risks, and the impact of application context. Psychology and Marketing, 34(2), 175–194. https://doi.org/10.1002/mar.20982
- IFC. (2011). Mobile money study: Summary report. International Finance Corporation. http://www.ifc.org/wps/wcm/connect/fad057004a052eb88b23ffdd29332b51/MobileMoneyReport-Summary.pdf?MOD= AJPERES
- InterMedia (2013). Mobile money: Use, barriers and opportunities, summary report, intermedia. www.intermedia.org/wp-content/uploads/2013/11/FITS_YearEndReport_11-8-134P.pdf.
- Jack, W., & Suri, T. (2011). Mobile money: The economics of M-Pesa (NBER Working Paper Series No. 16721). National Bureau of Economic Research.
- Jeong, H. (2011). An investigation of user perceptions and behavioral intentions towards the e-library. Library Collections, Acquisitions, and Technical Services, 35(2–3), 45–60. https://doi.org/10.1016/j.lcats.2011.03.018
- Kiconco, R., Rooks, G., Solano, G., & Matzat, U. (2019). A skills perspective on the adoption and use of mobile money services in Uganda. Information Development, 35(5), 724–738. https://doi.org/10.1177/0266666918788908
- Kikulwe, E. M., Fischer, E., & Qaim, M. (2013). (GlobalFood Discussion Papers). Mobile money, market transactions, and household income in rural Kenya. GlobalFood, Göttingen.
- Kikulwe, E. M., Fischer, E., & Qaim, M. (2014). Mobile money, smallholder farmers, and household welfare in Kenya. PLoS One, 9(10), e109804. https://doi.org/10.1371/journal.pone.0109804
- Kirui, O. K., Okello, J. J., & Nyikal, R. A. (2012). Determinants of use and intensity of use of mobile phone-based money transfer services in smallholder agriculture: Case of Kenya. 2012 Conference, August 18-24, 2012, Foz do Iguacu, Brazil 125739, International Association of Agricultural Economists.
- Kusimba, S., Yang, Y., & Kunyu, G. (2017). IMTFI Final Report. Dynamics networks of mobile money among unbanked women in western Kenya. Institute for Money, Technology & Financial Inclusion (IMTFI).
- Lashitew, A. A., Tulder, R., & Liasse, Y. (2019). Mobile phones for financial inclusion: What explains the diffusion of mobile money innovations? Research Policy, 49(5), 1201–1215. https://doi.org/10.1016/j.respol.2018.12.010
- Lee, Y., Kozar, K. A., & Larsen, K. R. T. (2003). The technology acceptance model: Past, present, and future. Communications of the Association for Information Systems, 12(1), 50. https://aisel.aisnet.org/cais/vol12/iss1/50
- Lucas, H. C., & Spitler, V. K. (1999). Technology use and performance: A field study of broker workstations. Decision Sciences, 30(2), 291–311. https://doi.org/10.1111/j.1540-5915.1999.tb01611.x
- Mas, I. (2010). Savings for the Poor. World Economics, 11(4), 1–12. https://doi.org/10.2139/ssrn.1663954
- Mas, I., & Kumar, K. (2008). Banking on mobiles: Why, how, for whom? Consultative group to assist the poor (CGAP) report. No 48. World Bank Consultative Group to Assist the Poor (CGAP).
- Mas, I., & Morawczynski, O. (2009). Designing mobile money services: Lessons from M-PESA. Innovations, 4(2), 77–91. https://doi.org/10.1162/itgg.2009.4.2.77
- Mbiti, I. M., & Weil, D. (2011). Mobile banking: The Impact of M-Pesa in Kenya. NBER Working Paper No.17129. National Bureau of Economic Research. 45(5),42-46.
- Morawczynski, O. (2009). Examining the usage and impact of transformational M-Banking in Kenya internationalization, design and global development (Vol. 5623). N. Aykin.
- Murendo, C., & Wollni, M. (2016). GlobalFood Discussion Papers. Mobile money and household food security in Uganda. GlobalFood, Göttingen.
- Murendo, C., Wollni, M., de Brauw, A., & Mugabi, N. (2015). Social network effects on mobile money adoption in Uganda, global food discussion papers, No. 58. Research Training Group (RTG) 1666 -GlobalFood. Georg-August-Universität Göttingen.
- Murendo, C., Wollni, M., De Brauw, A., & Mugabi, N. (2018). Social network effects on mobile money adoption in Uganda. The Journal of Development Studies, 54(2), 327–342. https://doi.org/10.1080/00220388.2017.1296569
- Mwesigwa, A. (2013). Mobile money—Why MTN remains ahead of rivals. Retrieved May 11, 2020, from. http://observer.ug/index.php?option=com.content&view=article& id=25561:mobile-money-why-mtn-remains-ahead-of-rivals
- N’dria, L. M., & Kakinakac, M. (2020). Financial inclusion, mobile money, and individual welfare: The case of Burkina Faso. Telecommunication Policy, 44(3). https://doi.org/10.1016/j.telpol.2020.101926
- Obgonna, K. (2013). Sensitizing Africa’s unbanked about banking and mobile money. #RetailAfrica. http://hotcontentmedia.blogspot.ug/ 2013/03/sensitizing-africas-unbanked-about.html
- Obiero, E. A. (2016). Knowledge and perception on mobile money and its influence on access to formal financial services among the youths in seme sub county: A case of Kombewa division [Masters Dissertation]. University of Nairobi
- OCAIC. (2010). Mobile commerce: New experiences, emerging consumer issues. The consumer trends update, Canada pi Consulting. (2013). Mobile financial services: Consumer insights study. pi Strategy Consulting.
- Okello, G., Bongomin, C., & Munene, J. C. (2019). Analyzing the relationship between mobile money adoption and usage and financial inclusion of MSMEs in developing countries: Mediating role of cultural norms in Uganda. Journal of African Business, 4. https://doi.org/10.1080/15228916.2019.1695189
- Omilola, B., & Kaniki, S. (2014). Social protection in Africa: A review of potential contribution and impact of poverty reduction study report. United Nations Development Program (UNDP.
- Omwansa, T. (2009). M-PESA: Progress and prospects. Innovations Case Discussion: M-PESA/Mobile world congress. GSMA Mobile World Congress. www.strathmore.edu/pdf/innov-gsma-omwansa.pdf
- Rafique, H., Almagrabi, A. O., Shamim, A., Anwar, F., & Bashir, A. K. (2020). Investigating the acceptance of mobile library applications with an extended technology acceptance model (TAM). Computer and Education, 145, 103732. https://doi.org/10.1016/j.compedu.2019.103732
- Rafique, H., Anwer, F., Shamim, A., & Minaei-bidgoli, B. (2018). Factors affecting acceptance of mobile library Applications: Structural equation model. Libri - International Journal of Libraries and Information Services, 68(2), 99–112. https://doi.org/10.1515/libri-2017-0041
- Rahimi, B., Nadri, H., Afshar, H. L., & Timpka, T. (2018). A systematic review of the technology acceptance model in health informatics. Applied Clinical Informatics, 9(3), 604–634. https://doi.org/10.1055/s-0038-1668091
- Research ICT Africa (2018). ICT household and business survey field manual. researchICTAfrica.net
- Scharwatt, C. (2019). Mobile money: A product of choice for women to send and receive remittances. Retrieved June 14, 2020, from. https://www.ifad.org/en/web/latest/blog/asset/41410919
- Subia, M. P., & Martinez, N. (2014). ACP Background Note ACPOBS/2014/BN13. Mobile Money Services: “a bank in your pocket”. Overviews and opportunities. African, Caribbean and Pacific (ACP) Observatory on Migration.
- Suri, T., & Jack, W. (2016). The long-run poverty and gender impacts of mobile money. Science, 354(6317), 1288–1292. https://doi.org/10.1126/science.aah5309
- Trendov, N. M., Varas, S., & Zeng, M. (2019). FAO Status Report. Digital technologies in agriculture and rural areas. Food and Agriculture Organization of the United Nations.
- Uduma, M. (2012). Localise awareness campaign on mobile money. http://www.itrealms.com.ng/2012/04/local-awareness-campaign-on- mobile.html
- UNSD. (2005). Designing Household Surveys Samples: Practical Guidelines. United Nations, New York
- Upadhyay, P., & Jahanyan, S. (2016). Analysing user perspective on the factors affecting use intention of mobile-based transfer payment. Internet Research, 26(1), 38–56. https://doi.org/10.1108/IntR-05-2014-0143
- Uzzi, B., & Lancaster, R. (2003). Relational embeddedness and learning: The case of bank loan managers and their clients. Management Science, 49(4), 383–399. https://doi.org/10.1287/mnsc.49.4.383.14427
- Venkatesh, V. (2000). Determinants of perceived ease of use integrating control, intrinsic motivation, and emotion into the technology acceptance model. Information Systems Research, 11(4), 342–365. https://doi.org/10.1287/isre.11.4.342.11872
- Venkatesh, V., & Davis, F. D. (2000). A theoretical extension of the technology acceptance model: Four longitudinal field studies. Management Science, 46(2), 186–204. https://doi.org/10.1287/mnsc.46.2.186.11926
- Venkatesh, V., & Hillol, B. (2008). Technology acceptance model 3 and a research agenda on interventions. Decision Sciences, 39(2), 273–315. https://doi.org/10.1111/j.1540-5915.2008.00192.x
- Venkatesh, V., Morris, M. G., Davis, G. B., & Davis, F. D. (2003). User acceptance of information technology: toward a unified view. MIS Quarterly, 27(3), 425–478. https://doi.org/10.2307/30036540
- Venkatesh, V., Thong, J. Y., & Xu, X. (2012). Consumer acceptance and use of information technology: Extending the unified theory of acceptance and use of technology. MIS Quarterly, 36(1), 157–178. https://doi.org/10.2307/41410412
- World Bank. (2020) . Assessing the economic impact of COVID-19 and policy responses in sub-Saharan Africa. Africa Pulse. An analysis of issues shaping Africa’s Economic Future.
- Yunus, F. M., Khan, S., Tasnuba, T., Husain, P. A., & Misiti, A. J. (2016). Are we ready to adopt mobile money in non-profit sector? Journal of Innovation and Entrepreneurship, 5(1), 32. https://doi.org/10.1186/s13731-016-0060-x
- Zha, X., Zhang, J., & Yan, Y. (2015). Comparing digital libraries in the web and mobile contexts from the perspective of the digital divide. Journal of Librarianship and Information Science, 47(4), 330–340. https://doi.org/10.1177/0961000614532677
- Zhao, Y., Deng, S., & Zhou, R. (2015). Understanding mobile library apps continuance usage in China: A theoretical framework and empirical study. Libri - International Journal of Libraries and Information Services, 65(3), 161–173. https://doi.org/10.1515/libri-2014-0148
- Zhou, T., Lu, Y., & Wang, B. (2010). Integrating TTF and UTAUT to explain mobile banking user adoption. Computers in Human Behavior, 26(4), 760–767. https://doi.org/10.1016/j.chb.2010.01.013