
 ?Mathematical formulae have been encoded as MathML and are displayed in this HTML version using MathJax in order to improve their display. Uncheck the box to turn MathJax off. This feature requires Javascript. Click on a formula to zoom.
Abstract
The aim of this study was to examine the reliability of performance measures in the different phases and sub-phases of the countermovement jump (CMJ). Seventeen male athletes competing at a regional level completed 204 valid trails consisting of the execution of maximal hands-on-waist CMJs performed on a force platform. The vertical ground reaction force (VGRF) data obtained at a sampling frequency of 1000 Hz were used to calculate performance-derived variables and determine key points and jump sub-phases. The relative reliability of 92 variables was assessed using the intraclass correlation coefficient (ICC) from a two-way mixed effects model analyzing the time, force, power, velocity, and displacement variables across the different phases and sub-phases of the jump. The contact phase serves as a consistent approach (range ICC = .806 to .987), providing reliable information about the jump as a unit. Mean force was the only measure that presented high reliable values throughout all sub-phases (ICC = .931 to .963). The power and velocity variables were reliable from the point where force turned into an increasing value while displacement from minimum velocity was reached. Net impulse and ratios of force development showed high and acceptable values, respectively. Time-related variables were the least reliable measures (ICC = .587 to .720), showing acceptable reliability only in the contact phase and propulsive sub-phase. In conclusion, VGRF may be used to determine specific parameters during CMJ execution, although the appropriate variables should be selected based on acceptable levels of reliability.
PUBLIC INTEREST STATEMENT
Countermovement jump test has become an extended tool to examine athletic performance and neuromuscular status. The present study analyzes the different sub-phases of the jump, providing an insight into the reliability of measures associated with specific parameters of countermovement jump executed on a force platform. A correct interpretation of jump assessments may provide athletes and coaches precise information about the direction that the training process is undertaking, helping to reach the conditioning program goals as well as preventing injury risk. Similarly, understand the different neuromuscular mechanisms involved in jump performance and its reliability could be of interest for researchers at the moment of select specific variables in the field of explosive strength studies.
1. Introduction
An athlete’s ability to rapidly generate high levels of muscular strength and power is a major issue related to performance in many sports disciplines (Cormie et al., Citation2010; Cronin & Hansen, Citation2005; Loturco et al., Citation2015). As a clear manifestation of that capability, vertical jump assessment has been shown to be a valid tool to examine explosive strength and neuromuscular status (Taylor et al., Citation2010), detect the effects of fatigue and super-compensation (Benjaminse et al., Citation2008; Claudino et al., Citation2017), or determine bilateral strength asymmetry (Impellizeri et al., Citation2007). Specifically, the countermovement jump (CMJ) is a vertical test that is used extensively among sports scientists and trainers to provide information related to the stretch-shortening cycle (Harry et al., Citation2018; Pagaduan & De Blas, Citation2004). In addition, if the jump is executed on a force platform, the vertical ground reaction force (VGRF) data will make it possible to estimate the jump height using different methods (Linthorne, Citation2001; Moir, Citation2008), but also to examine the performance measurements during the contact phase (Kibele, Citation1998; Kirby et al., Citation2011).
Furthermore, sub-phases based on key points addressed in the force-time, power-time, and displacement-time curves have been proposed. These approaches state that the contact phase can be broken down into eccentric and concentric sub-phases delimited by the point where the lowest value of the given curve is achieved or positive values were reached (Cormack et al., Citation2008; Cormie et al., Citation2010; Gathercole et al., Citation2015). In this regard, Cormack et al. (Cormack et al., Citation2008) determined eccentric and concentric sub-phases based on the force-time curve. Comparatively, eccentric and concentric sub-phases based on the displacement-curve (Cormie et al., Citation2010) or power-time curve (Gathercole et al., Citation2015) were also reported. More recently, these classifications have been extended by approaches that consider three sub-phases for the contact phase. One approach (Chavda et al., Citation2018) is based on the velocity-time curve and describes: a) an unweighting sub-phase, considered from the start of the jump to the point of minimum velocity (which coincides with the point where body weight is reached), b) a braking sub-phase, from the end of the unweighting sub-phase to the point where the velocity becomes positive, and c) a propulsive sub-phase, from the end of the braking sub-phase to take-off. This last sub-phase is equal to the concentric sub-phase based on displacement and represents the upward movement of the contact phase. The approach described by Harry et al. (Harry et al., Citation2018) is based on the force-time and displacement-time curves and includes: a) an unloading sub-phase (equal to the eccentric sub-phase based on force) that encompasses the period from jump initiation to the point where the lowest value of the force curve (FMIN) is reached, b) an eccentric sub-phase from the end of the unloading sub-phase to the point where the displacement reaches the maximal depth, and c) a concentric sub-phase equal to the aforementioned propulsive sub-phase.
The availability of different sub-phases would enable a more precise diagnosis of the strategies applied by the athlete while generating the jump (Cormie et al., Citation2010; Harry et al., Citation2018). Therefore, it is important to consider the reliability of the variables linked to time, force, power, velocity, and displacement among the different sub-phases by which CMJ performance can be analyzed. Previous studies have focused on this issue and reported high reliability using the percent coefficient of variation for force- and power-related variables, expressed as peak and mean concentric values (Cormack et al., Citation2008; Gathercole et al., Citation2015; Taylor et al., Citation2010). Similar findings have been reported for the same type of variables using the intraclass correlation coefficient (McMahon et al., Citation2018). Time-related variables showed different results among studies, ranging from low to moderate and high reliability (Cormack et al., Citation2008; Gathercole et al., Citation2015). Peak velocity has demonstrated excellent reliability, while the reliability of minimum velocity varied among studies (Gathercole et al., Citation2015; Taylor et al., Citation2010). However, no information is provided regarding the velocity between the different sub-phases.
A similar situation is found for the displacement of the center of mass (COM); while maximal displacement has been reported as a reliable measure (McLellan et al., Citation2011), little information is provided about displacement between the different sub-phases. Relative net impulse was suggested as a major determinant of jump height (JH) (Kirby et al., Citation2011) and high reliability values were reported (Gathercole et al., Citation2015). The role of the rate of force development (RFD) in CMJ performance has also been investigated. McLellan et al. (McLellan et al., Citation2011) reported a significant correlation (r = 0.68) between peak RFD and JH, with high reliability values (ICC = 0.89). However, lower RFD reliability values were observed in other studies (Gathercole et al., Citation2015; Hori et al., Citation2009).
It is important to note that, even though moderate agreement exists in the reliability of certain variables (principally those associated with the concentric/propulsive sub-phase), different descriptions have been proposed for the same variable. In this regard, the mean concentric force can be defined as the average force value from FMIN to take-off (Cormack et al., Citation2008) or the average force from the point of maximal displacement to take-off. This is also the case with the duration of the eccentric sub-phase, which can be considered as the time from the start of the jump to the point of maximal displacement (Cormie et al., Citation2010; Hori et al., Citation2009), the time from initiation of the jump to FMIN (Cormack et al., Citation2008), the period between FMIN and the point of maximal displacement (Barker et al., Citation2018; Harry et al., Citation2018), or the time from the point of minimum velocity to the point where velocity turns into positive values (McMahon et al., Citation2017). This could lead to misinterpretation of the reliability of a given variable if it is not considered as a different variable. In addition, there is a lack of information about the reliability of several variables among the CMJ sub-phases that have not yet been reported. Hence, the general purpose of the present study was to assess the reliability of measures of the time, force, power, velocity, and displacement variables derived from VGRF, associated with the different phases and sub-phases used to analyze the characteristics of CMJ performance.
2. Methods
2.1. Experimental approach to the problem
Each participant completed a total of four sessions separated by at least 48 hours. The sessions were performed in the morning (10:00 AM—2:00 PM) and in the afternoon (4:00 PM–8:00 PM); however, each participant was tested within the same hour range at all four sessions. All the tests were executed in the sports science laboratory, with environmental conditions of 22.0 ± 0.7℃, 44 ± 11% humidity, and 1010 ± 11 hPa. The participants were required to attend the laboratory in their usual training clothes and wearing running shoes. A complete recovery condition was requested before starting all the sessions, which consisted of no previous physical activity during the 48 hours before testing, a minimum of 7 hours of sleep the night before, a carbohydrate-rich diet, avoidance of any food, tobacco, caffeine, or supplement intake for at least 3 hours prior to testing, and drinking water regularly during the testing day. The same testing protocol was conducted in all the sessions and involved three trials of hands-on-waist CMJ. Intra- and inter-day comparisons were performed to assess the reliability of the CMJ variables.
2.2. Subjects
Seventeen male regional-level athletes (age 21.7 ± 3.7 years; height 176 ± 7 cm; body mass 66.4 ± 7.2 kg; fat mass index 9.9 ± 3.5%) participated in the study. All had regularly competed in athletics for no less than 3 years, trained 4.0 ± 1.0 days per week, and reported no injuries in the previous 6 months. At the moment of the study, their training frequency was 4.0 ± 1.0 days per week and none of them reported injuries in the previous 6 months. A complete written and verbal description of the research protocol was given to the volunteers, as well as a demonstration of the test. Afterward, the participants signed an informed consent form prior to any further intervention. The study was approved by the University Ethics Committee.
2.3. Procedures
Standardized warm-up: In order to prepare the athletes for a maximal jump, participants started the sessions by performing a standardized warm-up consisting of 4 minutes of self-regulated walking immediately followed by 3 minutes of running at an intensity set at 70% of the predicted maximal heart rate (range 8.5 km·h−1 to 9.5 km·h−1) on a treadmill (H/P Cosmos Quasar, Cosmos Sports & Medical, Nussdorf-Traunstein, Germany). After this, a set of dynamic activating exercises was completed on a 10-meter track, which included covering the length of the track twice (there and back) for each of the exercises scheduled (alternate knee lifts with arm swing, lateral displacements, and forward hops). According to previous recommendations, no static stretching exercises were included because they may diminish jump performance (Vetter, Citation2007). A minute of recovery was allowed at the end of the set. Afterward, a preparatory set was conducted specifically to practice the CMJ. Participants were asked to perform up to 5 CMJs intercalated with 20-second recovery periods between repetitions. They were also instructed to start with progressive submaximal executions in the two initial attempts. Verbal feedback was given to the athletes to confirm or correct aspects of the execution technique. A 2-minute recovery period was allowed before testing started.
CMJ testing: All tests were performed on a force plate (Kistler 9253B11, Kistler Instrument AG, Winterthur, Switzerland) connected to computer software (Bioware 5.3). The VGRF was recorded at a sampling frequency of 1000 Hz over a period of 10 s for each trial. Then, the data were downloaded and saved for subsequent analysis. Participants were instructed to perform the CMJ according to the following criteria: a) keep hands placed firmly on their hips at all times, b) start the jump standing upright on the force plate after maintaining that position for approximately 5 seconds before initiating the jump, c) execute the jump as fast as possible and try to reach the maximal height on every trial, d) perform a continuous movement, without pausing between the downward and upward displacement, e) self-select the depth of displacement, f) keep the ankles, knees, and hips extended during the flying phase until landing, and g) avoid lateral or frontal displacement during flight, making sure to land on the platform. In each session, the participants had to complete a total of three valid trials of CMJs separated by 30 seconds of recovery.
2.4. Data processing
Initial calculations: The VGRF data from all trials were included in the analysis. The data were exported to Excel files, where the basic calculations were performed. The force-time curve of each trial was entered to obtain a visual reference of the jump (Figure ). Initially, the weighting phase was identified prior to each jump with the subject standing motionless during which weight was calculated as the mean force over a 2-second period. The standard deviation was also calculated for the same period. The weight was divided by 9.81 to obtain the mass. Net force was calculated by subtracting the weight from the VGRF value at each time point. Net force allowed the net impulse to be calculated as the product of the net force and the sampling duration. Net vertical acceleration was calculated as net force divided by the mass. Velocity was calculated through numerical integration of net vertical acceleration. The same procedure was repeated to calculate COM displacement from velocity. Power at each point was obtained by multiplying velocity by the VGRF data.
Figure 1. Vertical ground reaction force of one CMJ trial and phases determined by jump initiation (FSTART), take-off (TO) and landing
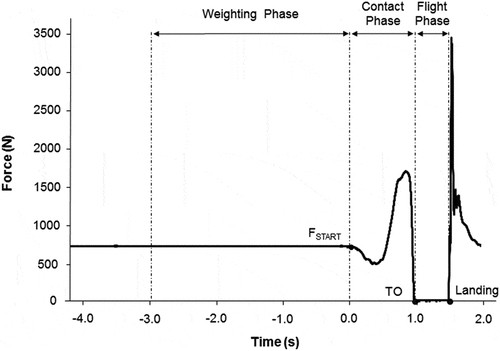
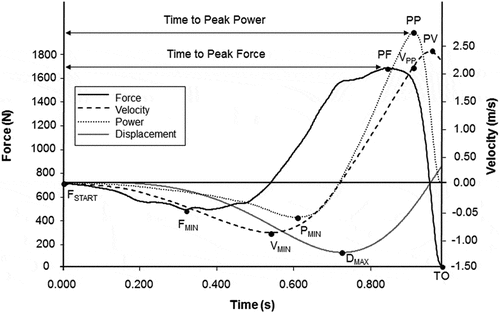
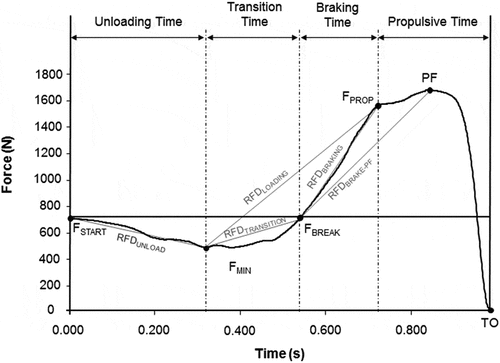
Key points: Several points of interest were marked for further determination of the different phases and sub-phases of the jump (Figure ). Starting force (FSTART) was defined as the value obtained by subtracting five times the SD of the weighting phase from the actual weight. This value represented the initiation of the jump. Minimum power (PMIN) was defined as the lowest power value recorded during the jump. Minimum velocity (VMIN) was determined as the lowest velocity value observed during the jump. The force value for that point was FBRAKE and it equaled body weight. The amplitude of the countermovement (DMAX) was stated as the maximal downward displacement reached during the contact phase (where also velocity = 0.00 m·s−1) and the VGRF for this point was defined as FPROP. Take-off was considered as the point where the force value was below the threshold calculated by subtracting five times the SD for a 30-milliseconds period during the flight phase from the mean of the same period. The same threshold was used to determine landing as the point when the force value was equal to or higher than it.
Figure 2. Performance measurements derived from vertical ground reaction force during the contact phase. Key inflection points indicate the minimum force (FMIN), the minimum velocity (VMIN) and the maximal downward amplitude (DMAX). Peak force (PF), peak power (PP), and peak velocity (PV) indicate the maximum values registered in a given curve, minimum power (PMIN) is the lowest value (peak negative value) of the power-time curve and (VPP) is the velocity achieved at the point where PP occurred. Power and displacement scales have been omitted
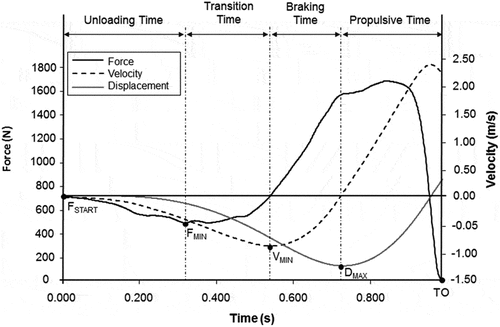
Determination of phases and sub-phases: Once the key points had been addressed, the phases and sub-phases of each jump were established. The contact phase was determined from FSTART to take-off and the flight phase from take-off to landing. In turn, the contact phase was divided into sub-phases corresponding to the different approaches reported. As mentioned above, according to the approach considered, the terms “eccentric” and “concentric” may lead to confusion when interpreting data related to a precise sub-phase. Therefore, in the present study those terms were not associated with any designated sub-phase. Instead, sub-phases were described using the specific name (i.e. braking sub-phase) or abbreviation (i.e. FINC) that represents the characteristic of the given sub-phase. Consequently, a force-increasing sub-phase (FINC) was determined from FMIN to take-off (Figure )). The same procedure was used to state the sub-phases based on displacement, whereby the decreasing-displacement sub-phase (DDEC) was defined from jump initiation to DMAX (Figure )). The unweighting sub-phase was determined from jump initiation to FBRAKE. This point also marked the start of the braking sub-phase, which lasted until FPROP. The propulsive sub-phase was delimited from FPROP to take-off (Figure )). The unloading sub-phase was determined from FSTART to FMIN. The loading sub-phase was defined as the portion of the contact phase from FMIN to DMAX (Figure )). Finally, the inclusion of a transition sub-phase was implemented to describe the zone determined between FMIN and FBRAKE (Figure ).
Figure 3. Different approaches to determine countermovement jump sub-phases based on: (a) force-time curve, where minimum force delimits the decreasing force time (TFDEC) and the increasing force time (TFINC), (b) displacement- or power-time curves, where the downward displacement time (TDDEC) is measured, (c) velocity-time curve, where FBRAKE is the point in the force curve at minimum velocity, FPROP is the point in the force where velocity turns into positive values and TBRAKE-PF is the time from the initiation of the braking sub-phase to peak force, and (d) force- and displacement-curve
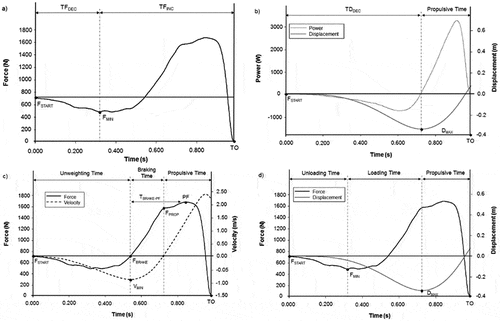
Figure 4. Determination of the transition sub-phase that represents the zone included between the first and second inflection points
Calculation of variables: Time-, force-, power-, and velocity-related variables, as well as integrated variables, were calculated for the contact phase. A description of the variables is summarized in Table .
Table 1. Contact phase variables, abbreviations, and descriptions
A similar procedure was performed to calculate the variables for the different sub-phases. Time-related variables encompassed the total duration of the increasing-force (TFINC), decreasing-displacement (TDDEC), unweighting (TUNWEIGHT), braking (TBRAKE), propulsive (TPROP), unloading (TUNLOAD), loading (TLOAD), and transition (TTRANSITION) sub-phases. They also included the time taken to reach the PF from the initiation of the braking sub-phase (TBRAKE-PF) and the time from initiation of the propulsive sub-phase to both PF and PP (TPROP-PF, TPROP-PP, respectively). Force-related variables included the mean force (MF) for each sub-phase, considered as the average of the force values exerted during each sub-phase (MFINC, MFUNWEIGHT, MFBRAKE, MFPROP, MFUNLOAD, MFLOAD, MFTRANSITION), and the relative mean force values (rMF), calculated by dividing each mean force value by the subject’s body mass (rMFINC, rMFUNWEIGHT, rMFBRAKE, rMFPROP, rMFUNLOAD, rMFLOAD, rMFTRANSITION). Power-related variables included mean power (MP), defined as the average power of each sub-phase (MPDDEC, MPUNWEIGHT, MPBRAKE, MPPROP, MPUNLOAD, MPLOAD, MPTRANSITION), and relative mean power (rMP), defined as the quotient of power divided by mass (rMPDDEC, rMPUNWEIGHT, rMPBRAKE, rMPPROP, rMPUNLOAD, rMPLOAD, rMPTRANSITION). Mean velocity (V) was calculated as the average velocity of the decreasing-displacement sub-phase (VDDEC), unweighting sub-phase (VUNWEIGHT), braking sub-phase (VBRAKE), propulsive sub-phase (VPROP), unloading sub-phase (VUNLOAD), loading sub-phase (VLOAD), and transition sub-phase (VTRANSITION). Displacement (D) was determined as the amplitude of movement from the initiation to the end of the different sub-phases (DUNWEIGHT, DBRAKE, DPROP, DUNLOAD, DLOAD, DTRANSITION). Net impulse (NI) was calculated using the trapezoid rule, NIBRAKE and NIPROP being the impulse corresponded to the braking and propulsive sub-phases, respectively. Relative net impulse (rNI) was also determined by dividing NI by body mass, obtaining rNIBRAKE and rNIPROP. Rate of force development (RFD) was defined as the difference between two force values divided by the time between these points (19). Therefore, RFDBRAKE was calculated as the force difference between FPROP and FBRAKE divided by TBRAKE, RFDBRAKE-PF as the force difference between PF and FBRAKE divided by TBRAKE-PF, RFDUNLOAD as the difference between FMIN and FSTART divided by TUNLOAD, RFDLOAD as the difference between FPROP and FMIN divided by TLOAD, and RFDTRANSITION as the difference between FBRAKE and FMIN divided by TTRANSITION (Figure ).
Figure 5. Ratios of force development of the unloading sub-phase (RFDUNLOAD), the loading sub-phase (RFDLOAD), the transition sub-phase (RFDTRANSITION), the braking sub-phase (RFDBRAKE), and the ratio of force development from the initiation of the braking sub-phase to peak force (RFDBRAKE-PF)
Time and displacement were calculated for the flight phase. Flight time (TFLIGHT) was considered as the time from take-off to landing, and jump height (JH) was calculated using the following equation:
Ratios of performance linked to the flying phase were also calculated. They included the reactive strength index for time (RSITIME) as the quotient of TFLIGHT divided by TCONTACT, the reactive strength index for height (RSIHEIGHT) as the quotient of JH divided by TCONTACT, and the time index of the propulsive sub-phase as the TFLIGHT:TPROP ratio.
2.5. Statistical analysis
Statistical Package for Social Sciences (version 24.0, SPSS, Inc., Chicago, IL, USA) was used to analyze all the data. Normality of the distribution was assumed according to Hopkins et al. (Hopkins et al., Citation2009). A single-factor repeated-measures ANOVA test was used to detect differences between sessions. The relative reliability of all the variables was assessed with the intraclass correlation coefficient (ICC) from a two-way mixed-effects model with a mean of k measurements and absolute agreement definition. It has been suggested that ICC values below 0.50 are indicative of poor reliability, values between 0.50 and 0.75 are indicative of moderate reliability, values between 0.75 and 0.90 are indicative of good reliability, and values above 0.90 are indicative of excellent reliability (Koo & Li, Citation2016)(16). The standard error of measurement (SEM) was used as an absolute index of reliability and was estimated as follows: , where SD is the standard deviation of the scores from all subjects. The SEM was used to determine the minimal difference (MD) and construct the 95% confidence interval (CI95%) using the equation MD95% = SEM × 1.96 ×
(Weir, 2005). The smallest worthwhile change (SWC) was calculated as 0.2 × between-subject standard deviation (Pagaduan & De Blas, Citation2004). Finally, the percent coefficient of variation (%CV) for each variable was defined as between-subject standard deviation divided by the mean, multiplied by 100.
3. Results
A total of 204 valid trials were included in the analysis. For each trail, 92 variables were calculated for the different phases and sub-phases of the CMJ. The ANOVA tests showed no significant mean differences between sessions in 85 of the variables calculated. In the variables that presented significant differences, a Bonferroni post-hoc test was also conducted to determine differences between sessions. A learning effect, represented as significant differences with respect to session 1 only, was observed in the following seven variables: FMIN (F = 2.82, p = .040), VMIN (F = 3.12, p = .027), rMFUNWEIGHT (F = 3.19, p = .025), NIBRAKE (F = 2.99, p = .032), rNIBRAKE (F = 3.61, p = .014), rMFTRANSITION (F = 3.37, p = .020), and VTRANSITION (F = 2.94, p = .035). Therefore, reliability tests were conducted considering only the values from sessions 2, 3, and 4.
All key points showed excellent reliability values, with ICCs ranging from .900 to .998 (Table ).
Table 2. Key Points: data description, mean differences between sessions, and reliability of measures
Variables linked to the flight phase are shown in Table . Flight time and jump height exhibited excellent reliability measures, with ICC = .934 and ICC = 932, respectively. Good reliability values were observed in the three performance indexes: ICC = .852 for RSITIME, ICC = 884 for RSIHEIGHT, and ICC = 857 for the TFLIGHT:TPROP ratio.
Table 3. Flight phase
Within the contact phase, the force, power, velocity, and impulse variables resulted in the most reliable measures, as can be observed in Table . Specifically, MFJUMP, PP, and NIJUMP showed the highest reliability values (ICC > .970) and a SWC > SEM, followed by PF, MPJUMP, and VPP, which displayed ICC > .935 and a lower CI95% > .900. Good to excellent reliability values were observed in PV, MVJUMP, and RNIJUMP, with ICCs > .900 and a lower CI95% > .840. Relative variables showed lower ICCs (range = .822 to .929) but also lower %CVs than the respective absolute variables. TCONTACT and TTPP exhibited good reliability values (ICC = .809 and ICC = .806, respectively), whereas moderate ones were observed in TTPF (ICC = .704) and RFDMAX (ICC = .715).
Table 4. Contact phase
The variables linked to the upward displacement are described in Table . Except for TTPFPROP, all variables of the propulsive sub-phase were highly reliable. MFPROP and NIPROP were the most reliable measures, with ICC = .964 and ICC = .985, respectively, and SWC > SEM. Excellent reliability values were observed in MPPROP and DPROP (ICC > .940 and lower CI95% > .900). Good reliability values were found in TTPPPROP (ICC = .888, lower CI95% = .820) and VPROP (ICC = .837, lower CI95% = .796). Relative variables presented lower values than their respective absolute variables, with ICC = .930 for RNIPROP, ICC = .869 for rMFPROP, and ICC = .860 for rMPPROP.
Table 5. Propulsive sub-phase
In the analysis based exclusively on the force-time curve, MFINC exhibited excellent reliability values, with ICC = .970, a lower CI95% = .970, and also a SWC > SEM (Table ).
Table 6. Sub-phases based on the force curve
In the decreasing-displacement sub-phase, high reliability values were found for MPDDEC (ICC = .935), rMPDDEC (ICC = .913), and VDDEC (ICC = .913). Duration of the decreasing-displacement sub-phase showed moderate reliability with a lower CI95% = .665 (Table ).
Table 7. Sub-phases based on the displacement curve
The reliability of measures assessed for the sub-phases based on the velocity-time curve is presented in Table . The unweighting sub-phase showed excellent reliability measures for MFUNWEIGHT (ICC = .953, lower 95% CI = .921) and VUNWEIGHT (ICC = .901). In the braking sub-phase, MFBRAKE showed the highest reliability value (ICC = .950, lower CI95% = .919), followed by MPBRAKE (ICC = .937, lower CI95% = .899), NIBRAKE, (ICC = .940, lower CI95% = .898), rMPBRAKE (ICC = .923, lower CI95% = .876), RNIBRAKE (ICC = .921, lower CI95% = .867), and VBRAKE (ICC = .905, lower CI95% = .848). Moderate reliability values were found in RFDBRAKE and RFDBRAKE-PF. The time variables of this sub-phase were the most unreliable measures, with a lower CI95% = .338 and lower CI95% = .364 for TBRAKE and TBRAKE-PF, respectively.
Table 8. Sub-phases based on velocity-time curve
Table shows the reliability of measures calculated for the approach based on both force- and displacement-time curves. The variables of the unloading sub-phase that presented high reliability values were MFUNLOAD (ICC = .949, lower CI95% = .918), rMFUNLOAD (ICC = .904), and RFDUNLOAD (ICC = .890). The loading sub-phase exhibited excellent reliability values for MFLOAD (ICC = .949, lower CI95% = .918) and MPLOAD (ICC = .935, lower CI95% = .895), and good to excellent values for rMPLOAD and VLOAD (ICC = .914 and ICC = .912, respectively). Good reliability values were also found in DLOAD, (ICC = .862) and RFDLOAD (ICC = .875). The duration of both the unloading and loading sub-phases showed marginal reliability values.
Table 9. Sub-phases based on force- and displacement-time curves
In the proposed transition sub-phase, MFTRANSITION and VTRANSITION presented the highest reliability values (ICC = .931, lower CI95% = .885 and ICC = .915, lower CI95% = .860, respectively), followed by MPTRANSITION (ICC = .899) and RFDTRANSITION (ICC = .893) (Table ).
Table 10. Transition sub-phase
4. Discussion
The main objective of this investigation was to assess the reliability of measures of CMJ variables derived from VGRF data across the different phases and sub-phases proposed to analyze jumping performance. To our knowledge, this is the first study that has conducted four repeated-session trials to determine reliability measures, considering the different approaches suggested to examine CMJ performance. In addition, the fact that participants were well-trained, experienced athletes from several sports disciplines reduces the risk of possible bias due to specific training.
Overall, the present investigation provides an in-depth insight into the reliable measures that may be used to analyze CMJ performance. Analysis of the contact phase serves as a consistent approach that provides reliable information about the jump as a unit. Mean force was the only measure that presented highly reliable values throughout all sub-phases. The power and velocity variables presented highly reliable values from the point where force turned into an increasing trace while displacement from minimum velocity was reached. Net impulse and RFDs showed highly reliable and acceptable values, respectively, in all the sub-phases for which they were calculated. Surprisingly, time-related variables were the least reliable measures, only showing acceptable reliability in the contact phase and propulsive sub-phase. These findings support the view that variables derived from VGRF data may be used successfully to determine specific parameters during CMJ execution.
Reduced variability will be of interest to detect differences in test–retest assessments. Consequently, procedures that aim to minimize error should be based on reliable measures. Weight and mass determination could be seen as minor issues, but they become crucial in CMJ analysis because they are necessary for defining the jump initiation, calculating derived variables, and expressing the values in relative terms. The mean value of the 2-second controlled weighting phase conducted prior to each trial proved to be an extremely reliable measure, with ICC = .998 for weight and mass. This method has been recommended previously (Moir, Citation2008; Street et al., Citation2001), and the present study adds the reliability needed for its implementation. Our results show that key points are also highly reliable measures; thus, sub-phases determined by them may be considered as reliable parameters to assess performance in specific parts of the jump.
Flight phase variables provide gross information about the final outcome of tests. The present findings indicate that flight time and jump height were the most reliable measures and reactive strength indices based on time or height displayed lower but good reliability. This is consistent with previous studies, which reported excellent reliability values (ICC > .90 and/or CV < 10%) for these variables (Cormack et al., Citation2008; Gathercole et al., Citation2015; Markovic et al., Citation2004; Pagaduan & De Blas, Citation2004). The ratio between flight time and propulsive time proved to be reliable, even though it has not been reported previously.
Based on our results, analysis of the contact phase appears to be a consistently reliable approach that reflects the jumping strategy applied by an athlete as a whole. This is supported by the fact that, with the exception of TTPF and RFD, all performance parameters showed high reliability measures. The reliability pattern observed in peak values of force, power, velocity, and impulse was very similar to those reported in previous studies that used ICC as a reliability measure (Hori et al., Citation2009; McMahon et al., Citation2017), as well as in those that applied a different methodology (Cormack et al., Citation2008; Gathercole et al., Citation2015). The mean power of the contact phase (MPJUMP) expressed in converted values (i.e. not averaging negative with positive values but averaging the module of all values) also serves as a very reliable measure. This variable has been previously reported in only one study (Gathercole et al., Citation2015) and indicated as reliable. Our design also included the calculation of the mean force and mean velocity (converted) of the contact phase, which had not yet been reported. MFJUMP presented the highest reliability value for this phase, while VJUMP presented a lower but completely acceptable value.
The propulsive sub-phase focuses on the portion of the contact phase where the vertical displacement of the center of mass follows an upward direction. Good to excellent reliability measures were found in ten out of the eleven variables, suggesting that the inclusion of this sub-phase is a very consistent approach that can be used to analyze the performance characteristics of CMJ. These variables have been considered as determining factors related to CMJ performance (Harry et al., Citation2018; Kirby et al., Citation2011) or post-training supercompensation conditions (Claudino et al., Citation2017). In addition, the reliability of these variables is further supported in the literature. Hori et al. (Hori et al., Citation2009) reported an ICC of .93 and an ICC of .84 for mean force and mean power, respectively, in a two-trial design performed by young physically active men; these values are similar but even lower than those observed in the present study. In the same respect, mean power, mean force, and impulse associated with the propulsive sub-phase were suggested as reliable measures that are capable of detecting changes due to fatigue (Gathercole et al., Citation2015).
Several approaches were applied in order to analyze the part of the contact phase linked to the downward displacement of the center of mass. The first approach considered the total decreasing-displacement sub-phase, where MPDDEC exhibited the highest reliable value. This variable has been reported as being sensitive to significant changes elicited by power and strength training, suggesting an improvement in performance due to a better strategy adopted during this sub-phase (Cormie et al., Citation2010). To our knowledge, no previous work has measured the reliability of the mean velocity of this sub-phase. However, it is suggested that it may be a reliable measure that would provide sensitive information related to the velocity of the downward movement.
The second approach is based on the velocity-time curve and divides the decreasing-displacement sub-phase into an unweighting and a braking sub-phase. The unweighting sub-phase describes the entire area of the force-time curve that is below body weight, which is important because of the influence it will have on the rate and magnitude of force production required in the subsequent braking sub-phase (Kibele, Citation1998; McMahon et al., Citation2017). However, there are no previous reports about the reliability assessed for the variables of this sub-phase; therefore, the present study provides novel information regarding this matter. In the present results, the mean force of the unweighting sub-phase proved to be an excellent reliability measure, while power, velocity, and displacement showed acceptable reliability values. The braking sub-phase starts at the point where force equals body weight, which also coincides with the point of minimum velocity (or peak negative velocity) and it therefore represents the inflection point where mass starts to slow down in the downward direction (Kibele, Citation1998; McMahon et al., Citation2018). Several variables have been suggested as the main parameters of performance in this sub-phase. Specifically, Kibele (Kibele, Citation1998) stated that the duration (time) and displacement (distance) of this sub-phase are quantitatively useful for estimating stretch-shortening behavior. In addition, as the net impulse required to stop downward displacement of the center of mass is proportional to the net impulse applied to accelerate it during the initial sub-phase(s) of the jump, the shape of the braking sub-phase net impulse is representative of the strategy employed by the athlete (McMahon et al., Citation2018). In the present study, time variables of the braking sub-phase proved to be unreliable measures and are therefore not suggested as reliable parameters to understand differences between test–retest assessments. In contrast, net impulse presented excellent reliability values, and DBRAKE moderate ones. Previous data (McMahon et al., Citation2017) have reported good reliability for net impulse (ICC = .835) and displacement (ICC = .883). Our results are partially consistent with the aforementioned data, considering a higher reliability for net impulse with ICC = .940 and a lower reliability for DBRAKE (ICC = .806, lower CI95% = .690). Mean force presented the highest reliability value in the braking sub-phase. However, it may be insufficient to determine the braking strategy. Therefore, the inclusion of variables that have also reached acceptable reliability values (good to excellent), such as mean power, mean velocity, and ratios of force development, may provide complementary information about this issue.
The third approach integrates both force and displacement. Therefore, the inflection point in the force-time curve delimits the unloading sub-phase, and the inflection point in the displacement-time curve marks the end of the consecutive loading sub-phase. The unloading-sub-phase provides specific information related to the earliest portion of the jump. In this regard, significant differences have been reported in the unloading duration between groups of good and poor jumpers determined by RSI (Harry et al., Citation2018). Furthermore, significant correlations of minimum force with RSIHEIGHT and jump time have been also observed (Barker et al., Citation2018). In contrast, Cormack et al. (Cormack et al., Citation2008) reported minimum force as an unreliable measure. In our results, TUNLOAD showed moderate reliability values (lower CI95% = .570), suggesting that caution should be exercised if considering improvements in performance based only on this variable. The present data indicate that minimum force constitutes an acceptable parameter for test–retest assessments due to the good to excellent reliability values displayed. MFUNLOAD and RFDUNLOAD may also be considered as reliable measures for this sub-phase. Conversely, power, velocity, and displacement seem to be unreliable measures for determining changes in performance in the unloading sub-phase. The loading sub-phase has been associated with elastic energy utilization, as this is where the negative kinetic energy developed in the unloading sub-phase can be used (Barker et al., Citation2018). This author found a strong negative correlation between minimum force and RFDUNLOAD, suggesting that the latter variable is a practical measure for assessing elastic capacity. In our study, RFDUNLOAD displayed good to excellent reliability values, so it can be considered a reliable monitoring tool between sessions. In addition, mean force, mean power, and mean velocity also presented high reliability values, meaning that this sub-phase represents a consistent approach.
This fact also highlights the importance of the first inflection point (FMIN) in CMJ kinetics. However, the second inflection point (velocity) is not included in the aforementioned approach and, consequently, the zone where mass starts to decelerate (braking sub-phase) is not determined. In the present study, this was solved by the inclusion of a transition sub-phase delimited by the first and second inflection points. This sub-phase links the unloading sub-phase with the braking sub-phase and provides a novel approach that can be useful to better explain CMJ performance characteristics. This is supported by the good to excellent reliability of measures observed in force and velocity, as well as in RFDTRANSITION.
As a final consideration, our results showed that in all cases the relative variables displayed similar but lower reliability values than the absolute variable to which they are related (rXSUB-PHASE with respect to XSUB-PHASE). Moreover, relative variables also showed lower %CV than absolute ones. This pattern suggests that absolute variables could be selected in individual test–retest assessments, while relative variables may be useful when different athletes or groups of athletes are evaluated.
4.1. Limitations
It can be argued that there is no evidence of training adaptations or performance correlations determined by the variables of the transition sub-phase. This is explained by the fact that the determination of the parameters that contribute to specific jumping performance characteristics is beyond the scope of this study. Therefore, we recommend cautious utilization of the transition sub-phase variables until further investigation has been completed.
Another limitation is that kinematic data derived from VGRF data conceived the movement running exclusively through the vertical axis, and thus not including lateral or anterior-posterior displacements. This could affect reliability measurements related especially to displacement and velocity. Similarly, segmental kinematic analysis and specific muscle activation have not been included in the design of this study. Therefore, it would be interesting to conduct further research contrasting the present data with testing protocols that assess those parameters directly, e.g., video motion analysis and electromyography data.
5. Practical applications
In summary, CMJ assessments conducted on a force plate are practical and reliable providing specific information about the jumping strategies adopted. However, rigorous procedures should be conducted in order to minimize test–retest variability. Based on our findings, the following practical recommendations are suggested:
Repeat the same execution technique across trials and session, clearly stating the criteria to consider a given trial valid.
Complete a standardized warm-up of around 10 minutes at the beginning of each testing session, which should be progressive and include global dynamic movements. A preparatory set of three to five increasing-intensity CMJs before test initiation is also recommended to allow participants to practice the testing technique specifically.
Implement at least one familiarization session before the first testing session in order to minimize learning effects.
Record at an appropriate sampling frequency (>200 HZ).
Measure body weight prior to each trial, with the subject standing still for 2 seconds.
Identify reliable key points to determine the phases and sub-phases of the jump.
Contact phase parameters provide reliable quantitative information about jump execution, so this should be considered a practical and useful approach to analyze CMJ performance.
If specific aspects of the jump are of interest, an appropriate approach and sub-phases may be selected, according to the aims of the test.
Conduct the analyses based on reliable measures when comparing test–retest values.
Absolute measures seem to be a preferable option when comparing individual assessments, while relative measures may be useful in team testing or inter-subject comparisons.
Disclosure statement
There are no conflict of interests related to this research.
Additional information
Funding
Notes on contributors
Juan Carlos Redondo
This study is part of larger Ph.D. research, in which we analyze the effects of different high-intensity interval training protocols on performance parameters. We initially compared different work-interval duration protocols to determine physiological and perceptual responses (Warr et al., 2018; https://doi.10.1371/journal.pone.0200690). Subsequently, we completed an experimental design focus on the effect that work-interval duration could have on biomechanical parameters of performance. At the moment of the selection of those parameters, we have found some controversies related to countermovement jump subphases determination (especially with the terms “eccentric” and “concentric”).
References
- Barker, L. A., Harry, J. R., & Mercer, J. A. (2018). Relationships between countermovement jump ground reaction forces and jump height, reactive strength index, and jump time. Journal of Strength and Conditioning Research, 32(1), 248–20. https://doi.org/10.1519/JSC.0000000000002160
- Benjaminse, A., Habu, A., Sell, T. C., Abt, J. P., Fu, F. H., Myers, J. B., & Lephart, S. M. (2008). Fatigue alters lower extremity kinematics during a single-leg stop-jump task. Knee Surgery, Sports Traumatology, Arthroscopy, 16(4), 400–407. https://doi.org/10.1007/s00167-007-0432-7
- Chavda, S., Bromley, T., Jarvis, P., Williams, S., Bishop, C., Turner, A. N., Lake, J. P., & Mundy, P. D. (2018). Force-time characteristics of the countermovement jump: Analyzing the curve in Excel. Strength and Conditioning Journal, 40(2), 67–77. https://doi.org/10.1519/SSC.0000000000000353
- Claudino, J. G., Cronin, J., Mezêncio, B., McMaster, D. T., McGuigan, M., Tricoli, V., Amadio, A. C., & Serrão, J. C. (2017). The countermovement jump to monitor neuromuscular status: A meta-analysis. Journal of Science and Medicine in Sport, 20(4), 397–402. https://doi.org/10.1016/j.jsams.2016.08.011
- Cormack, S. J., Newton, R. U., McGuigan, M. R., & Doyle, T. L. (2008). Reliability of measures obtained during single and repeated countermovement jumps. International Journal of Sports Physiology and Performance, 3(2), 131–144. https://doi.org/10.1123/ijspp.3.2.131
- Cormie, P., McGuigan, M. R., & Newton, R. U. (2010). Changes in the eccentric phase contribute to improved stretch-shorten cycle performance after training. Medicine & Science in Sports & Exercise, 42(9), 1731–1744. https://doi.org/10.1249/mss.0b013e3181d392e8
- Cronin, J. B., & Hansen, K. T. (2005). Strength and power predictors of sports speed. Journal Of Strength And Conditioning Research / National Strength & Conditioning Association, 19(2), 349–357. https://doi.org/10.1519/00124278-200505000-00019
- Gathercole, R., Sporer, B., Stellingwerff, T., & Sleivert, G. (2015). Alternative countermovement-jump analysis to quantify acute neuromuscular fatigue. International Journal of Sports Physiology and Performance, 10(1), 84–92. https://doi.org/10.1123/ijspp.2013-0413
- Harry, J. R., Paquette, M. R., Schilling, B. K., Barker, L. A., James, C. R., & Dufek, J. S. (2018). Kinetic and electromyographic subphase characteristics with relation to countermovement vertical jump performance. Journal of Applied Biomechanics, 34(4), 291–297. https://doi.org/10.1123/jab.2017-0305
- Hopkins, W. G., Marshall, S. W., Batterham, A. M., & Hanin, J. (2009). Progressive statistics for studies in sports medicine and exercise science. Medicine & Science in Sports & Exercise, 41(1), 3–12. https://doi.org/10.1249/MSS.0b013e31818cb278
- Hori, N., Newton, R. U., Kawamori, N., McGuigan, M. R., Kraemer, W. J., & Nosaka, K. (2009). Reliability of performance measurements derived from ground reaction force data during countermovement jump and the influence of sampling frequency. Journal of Strength and Conditioning Research, 23(3), 874–882. https://doi.org/10.1519/JSC.0b013e3181a00ca2
- Impellizeri, F., Rampinini, E., Maffiuletti, N., & Marcora, S. (2007). A vertical jump force test for assessing bilateral strength asymmetry in athletes. Medicine & Science in Sports & Exercise, 39(11), 2044–2050. https://doi.org/10.1249/mss.0b013e31814fb55c
- Kibele, A. (1998). Possibilities and limitations in the biomechanical analysis of countermovement jumps: A methodological study. Journal of Applied Biomechanics, 14(1), 105–117. https://doi.org/10.1123/jab.14.1.105
- Kirby, T. J., McBride, J. M., Haines, T. L., & Dayne, A. M. (2011). Relative net vertical impulse determines jumping performance. Journal of Applied Biomechanics, 27(3), 207–214. https://doi.org/10.1123/jab.27.3.207
- Koo, T. K., & Li, M. Y. (2016). A guideline of selecting and reporting intraclass correlation coefficients for reliability research. Journal of Chiropractic Medicine, 15(2), 155–163. https://doi.org/10.1016/j.jcm.2016.02.012
- Linthorne, N. P. (2001). Analysis of standing vertical jumps using a force platform. American Journal of Physics, 69(11), 1198–1204. https://doi.org/10.1119/1.1397460
- Loturco, I., Pereira, L. A., Abad, C. C. C., DʼAngelo, R. A., Fernandes, V., Kitamura, K., Kobal, R., & Nakamura, F. Y. (2015). Vertical and horizontal jump tests are strongly associated with competitive performance in 100-m dash events. Journal of Strength and Conditioning Research, 29(7), 1966–1971. https://doi.org/10.1519/jsc.0000000000000849
- Markovic, G., Dizdar, D., Jukic, I., & Cardinale, M. (2004). Reliability and factorial validity of squat and countermovement jump tests. Journal Of Strength And Conditioning Research / National Strength & Conditioning Association, 18(3), 551–555. https://doi.org/10.1519/1533-4287(2004)18<551:rafvos>2.0.co;2
- McLellan, C., Lovell, D., & Gass, G. (2011). Markers of postmatch fatigue in professional rugby league players. Journal of Strength and Conditioning Research, 25(4), 1030–1039. https://doi.org/10.1519/jsc.0b013e3181cc22cc
- McLellan, C. P., Lovell, D. I., & Gass, G. C. (2011). The role of rate of force development on vertical jump performance. Journal of Strength and Conditioning Research, 25(2), 379–385. https://doi.org/10.1519/JSC.0b013e3181be305c
- McMahon, J. J., Rej, S. J., & Comfort, P. (2017). Sex differences in countermovement jump phase characteristics. Sports, 5(1), 8. https://doi.org/10.3390/sports5010008
- McMahon, J. J., Suchomel, T. J., Lake, J. P., & Comfort, P. (2018). Understanding the key phases of the countermovement jump force-time curve. Strength and Conditioning Journal, 40(4), 96–106. https://doi.org/10.1519/SSC.0000000000000375
- Moir, G. L. (2008). Three different methods of calculating vertical jump height from force platform data in men and women. Measurement in Physical Education and Exercise Science, 12(4), 207–218. https://doi.org/10.1080/10913670802349766
- Pagaduan, J. C., & De Blas, X. (2004). Reliability of countermovement jump performance on chronojump-boscosystem in male and female athletes. Sports SPA, 10(2), 5–8. http://sportspa.ftos.untz.ba/images/dec2013/full/ARTICLE_1.pdf
- Street, G., McMillan, S., Board, W., Rasmussen, M., & Heneghan, J. M. (2001). Sources of error in determining countermovement jump height with the impulse method. Journal of Applied Biomechanics, 17(1), 43–54. https://doi.org/10.1123/jab.17.1.43
- Taylor, K.-L., Cronin, J., Gill, N. D., Chapman, D. W., & Sheppard, J. (2010). Sources of variability in iso-inertial jump assessments. International Journal of Sports Physiology and Performance, 5(4), 546–558. https://doi.org/10.1123/ijspp.5.4.546
- Vetter, R. E. (2007). Effects of six warm-up protocols on sprint and jump performance. Journal Of Strength And Conditioning Research / National Strength & Conditioning Association, 21(3), 819. https://doi.org/10.1519/r-20296.1