
 ?Mathematical formulae have been encoded as MathML and are displayed in this HTML version using MathJax in order to improve their display. Uncheck the box to turn MathJax off. This feature requires Javascript. Click on a formula to zoom.
Abstract
This is a study of the effect of illicit financial flows on government revenues in the West African Economic and Monetary Union countries. The study uses data from 8 countries and covering the 1996–2013 period. Using an empirical investigation with instrumental variables, the study found that illicit financial flows had a negative and significant effect on government revenues and that this effect was tied to per capita income, corruption and governance. It further highlighted the significance of the per capita income in the relationship between illicit financial flows and government revenues. The study therefore recommends that the governments should strengthen their tax collection capacity to better identify and prevent certain illegal activities associated with illicit financial flows. At the regional level, the West African Economic and Monetary Union Commission should consider setting up an appropriate illicit financial flows consultative body that would bring together state and non-state actors and serve as a platform for consultation and discussing illicit financial flows issues. With regard to the per capita income as the main transmission channel, governments should put in place the incentives that people need to keep and invest a large part of their profits and savings in their countries origin.
Public interest statement
In the study, we use sample data on 8 West African Economic and Monetary Union countries (WAEMU) for 1996 to 2013 to explore the effect of illicit financial flows on government revenues in WAEMU. From our results, illicit financial flows had a negative and significant effect on government revenues. Further analysis revealed that illicit financial flows are tried to several transmission channels such are per capita income, corruption and government effectiveness. It further highlighted the significance of the per capita income in the relationship between illicit financial flows and government revenues. These funding suggest that illicit financial flows have not a direct effect on
1. Introduction
Public resource mobilization is an important and indispensable strategy a given government must use in its implementation of investment, poverty reduction and public service provision policies (Culpeper & Bhusshan, Citation2010; Ogunleye & Fashina, Citation2009). Even though this issue has not received the attention it deserves, today increasing government revenues has emerged as a necessary step for developing countries towards reducing their reliance on foreign aid (Diarra, Citation2012).
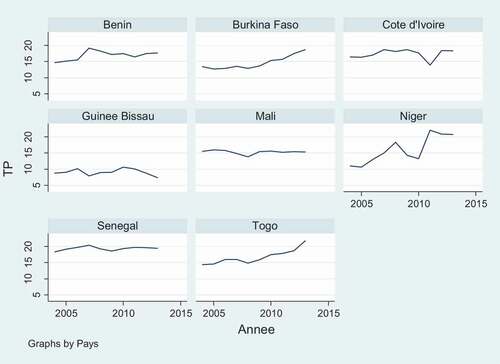
An analysis of public revenue mobilization rates in developing countries taken together or individually reveals contrasting situations. In the West African Economic and Monetary Union area, this rate was 19.1% in 2013, which was lower than the average for sub-Saharan Africa (27.5%) (BCEAO, Citation2013). This notwithstanding, between 2000 and 2014 the West African Economic and Monetary Union member states made great efforts to meet the minimum threshold of 17% of their gross domestic product (GDP). During that period, Senegal and Togo significantly increased their tax collection rate to 19.3% and 19.8% respectively. The two countries were able to achieve these rates because they widened their tax base as a result of the recent boom in their mining industries and in their telecommunications and banking sectors (Annex A).
Burkina Faso and Niger also increased their public revenues to 15% of their GDP in 2014, compared to around 10% in 2000. In contrast, Côte d’Ivoire, Mali and Benin made very little progress during the same period: 14.7% against 15.2% for Côte d’Ivoire, 12.3% against 12.5% for Mali, and 14.1% against 14.8% for Benin. Guinea Bissau had the lowest tax collection rate in the West African Economic and Monetary Union area, with an average rate of only 7% (BCEAO, Citation2013).
Despite the tax collection performance of these countries, their situation constitutes a surprising paradox (Ndikumana, Citation2014). Most of them do not have enough savings to finance their investments. This means that their economies are forced to depend on official development aid, which has been constantly declining as a result of recurring financial crises. However, large sums of money are illegally transferred out of them (and the continent) every year (BCEAO, Citation2013; GFI, Citation2008).
Illicit financial flows have become a major concern for governments and international development agencies. Narrowly defined, illicit financial flows are undeclared funds that are illegally acquired, transferred or used as the product of criminal activities or corruption (BCEAO, Citation2013; GFI, Citation2008). Broadly defined, they are funds acquired and transferred by taking advantage of the loopholes in the law or some other artificial arrangements aimed at circumventing the spirit of the law. This paper will follow the narrow definition and define illicit financial flows as any income that is acquired, transferred or used illegally.
Illicit financial flows are increasingly attracting attention because of their scale and negative impact on countries’ development efforts. Empirical studies (AfDB, Citation2010; BCEAO, Citation2013; GFI, Citation2013) have reported large sums of money that has illegally left the African continent. While there is much controversy about the exact amount of money involved in this capital flight, it most likely exceeds the official development assistance and investment inflows. Estimates of illicit capital flight from Africa show that, on average, it increases by 12% per year (Dickinson, Citation2014; GFI, Citation2013).
According to Global Financial Integrity (2013), illicit financial flows from developing countries grew by 10.2% between 2002 and 2012. In 2012, Asia experienced the highest rate of illicit financial flows (39.6%), while developing Europe and Western countries in the western hemisphere experienced rates of 21.5% and 19.6%, respectively (Annex C). The average rate for the Middle East and North Africa regions was 11.2%. Although sub-Saharan Africa experienced the lowest nominal rate (7.7%), it had the highest average GDP ratio, 5.7% (Kar & Leblanc, Citation2014).
IFFs are tied to several transmission channels, most of which come from corruption, criminal activity and trading activities. GFI (Citation2010) estimated that 30% to 35% of those flows from African countries were linked to organized crime. That is a very high proportion, compared to that of illicit financial flows linked to corruption (5%). But most striking is the fact that 60% to 65% of the total IFFs were related to trading activities.
According to the High Level Group (Citation2015), Africa itself is to blame for illicit financial flows, because of the weaknesses in its governance system and especially of the inability of its regulatory institutions to prevent them. But those illicit financial flows can also be blamed on the opacity and lack of transparency of the international banking system, which is a facilitating factor in the easy transfer, circulation, and concealment of financial resources. They can also be blamed on the existence of safe havens, which makes it difficult for African countries to monitor the illicit financial flows (European Commission for Africa, Citation2014).
All these problems show that illicit financial flows have many and complex effects on countries’ economies and can affect their levels of public revenue mobilization through various mechanisms involving the violation of the law and the undermining of good governance both in the public and the private sectors. Illicit financial flows hinder economic growth, leading to a reduction in investment and, hence, in public revenues (Ndikumana, Citation2014; UNDP, Citation2011).
The link between illicit financial flows and public revenue mobilization, as has been shown in the previous contextual analysis, is crucial to the economies of African countries. This study analyzes how illicit financial flows affect government revenues in the West African Economic and Monetary Union countries. Specifically, it measures the effect and the contribution of the transmission channels through which illicit financial flows affect government revenues. The study was motivated by the observation that illicit financial flows reduce the resources that could have been invested to create wealth in the countries affected. This suggests that illicit financial flows have a potentially negative effect on public revenues.
An analysis of such an illicit financial flows effect is particularly relevant to the situation of the West African Economic and Monetary Union countries for several reasons. First, one of the characteristics of their economies is the existence of a fixed exchange rate between the CFA franc and the euro. This exchange-rate fixity means that the countries concerned are unable to adjust the exchange rate, which has led to a strong sensitivity of their economic growth to shocks (Savvides, Citation1996), a state of affairs which in turn encourages illicit capital outflows. Second, the opening of the capital account increases the countries’ vulnerability to fluctuations in capital flows, particularly by providing the legal channels for an illicit outflow of capital (Ndikumana, Citation2014). Third, the informal networks, which are extremely active in cross-border trade, have fostered the growth of cross-border criminal trafficking across the porous borders of the countries. The local border populations, who rely on these smuggling networks, do not distinguish between illicit and lawful goods (OECD/CSAO, 2014; Reitano & Shaw, Citation2014).
The state of affairs described in the preceding paragraph is conducive to illicit financial flows; these have indeed become a chronic and growing phenomenon in the West African Economic and Monetary Union area. The most recent estimates show that over the 2003–2014 period, illicit financial flows reached the staggering amount of about US$900 billion (GFI, Citation2013). The GFI (Citation2013) estimates show how high the levels of these illicit financial flows are compared to those from the rest of sub-Saharan Africa. In this regard, two WAEMU countries rank in the top 10 sub-Saharan African countries with the highest amounts of illicit financial flows: ranking 5th is Côte d’Ivoire (with US$23 billion, corresponding to 6% of its GDP) and ranking 8th is Togo (with US$18 billion, corresponding to 4.7% of its GDP).
There is unanimity in the literature on econometric research in recognizing the adverse effects of illicit financial flows on an economy (Fofack & n.d.ikumana, Citation2015; Macharia, Citation2014). Against this background, the contribution of this study is twofold.
First, to the best of our knowledge, there is very little work that focuses exclusively on government revenues, especially in Sub-Saharan African countries. However, those related to the impact of illicit capital flight on investment and growth have been conducted on a sample of franc zone countries (Ndiaye, 2011; Ndikumana, Citation2014). This research attempts to fill this gap in the literature.
Second, we seek to determine the transmission channels of the effect of illicit financial flows on government revenues. The objective is first to analyze the direct and indirect effects of illicit financial flows and then to measure the relative contribution of these different transmission channels to the effect of illicit financial flows on the public tax rate.
The study used a method developed by Mo (Citation2001) and adopted by Attila et al. (Citation2009) to empirically analyze the contribution of the various channels through which illicit financial flows affect public revenues. The results showed that illicit financial flows negatively affect public revenues through per capita income, corruption and governance.
The remainder of the paper is structured as follows: Section 2 is a review of the literature on the relationship between illicit financial flows and government revenues. Section 3 provides information on the trends in illicit financial flows. Section 4 outlines the methodology used in the study, and Section 5 is the conclusion.
2. Literature review
Although public revenue mobilization has many determinants, recent literature is not unanimous on their nature. Nevertheless, empirical consensus exists on the significant effect of the level of development and trade openness on the negative relationship between IFFs and public resource mobilization.
2.1. Determinants of public revenue mobilization
Early research on the determinants of public revenue mobilization dates back to Shin (Citation1969), Lotz and Morss (Citation1970), and Bahl (Citation1971). Since this early research, several studies have been conducted in developed and developing countries to explain the structural factors in public resource mobilization (Ángeles Castro & Ramírez Camarillo, Citation2014; Karagöz, Citation2013; Sharma & Singh, Citation2015). For these authors, the development level, often measured by the per capita GDP, is considered one of the primary determinants of the tax burden.
Ghura (Citation1998) analyzed determinants representing macroeconomic and structural policies and the level of corruption based on a panel data of 39 countries in SSA during 1985–1996. Using instrumental variables generalized least squares (IV-GLS) he found that an increase of the level of corruption lowers the tax revenue. Mahdavi (Citation2008) used a modified model with a number of explanatory variables based on 43 developing countries over the time period 1973–2002, using the GMM method with cross-section fixed effects. He finds that total tax revenues is positively related to the degree of international trade and the level of development approximated by per capita income. However, an increase in foreign aid, the degree of monetization and the rate of inflation lead to lower tax revenue.
Ajaz and Ahmad (Citation2010) conducted a study on the effect of institutional and structural variables on tax revenues. Using the Generalized Method of Moments (GMM) estimation technique for the 1990–2005 period for 25 developing countries, they showed that structural variables such as the per capita income, trade openness, the share of the industry in the economy and the inflation rate play an important role in tax mobilization.
Thornton (Citation2014), who added another variable, namely the revenue from natural resources, also found that those structural variables are generally associated with higher tax revenue rates, while corruption and the revenue from natural resources has the opposite effect.
At the same time, other studies have shown that the degree of openness of an economy has a positive effect on fiscal performance thanks to tax collection facilities (Baunsgaard & Keen, Citation2010; Bird et al., Citation2008). Trade openness accounts for the fiscal disparities that exist between developing countries. However, some studies have shown that it leads to losses in public revenues (Cagé & Gadenne, Citation2016; Sokolovskan, Citation2015).
In addition to those factors, empirical studies have shown that the sectoral composition of the economy also accounts for the trends in tax collection (Anware, Citation2014; Botlhole, Citation2011; Mahdavi, Citation2008). Gupta (Citation2007) contributes to the empirical literature on the determinants of tax revenues using data from 105 developing countries over 25 years with different estimation techniques, including both fixed and random effects, panel-corrected standard error estimation using Prais-Winsten regression as well as difference GMM and system-GMM estimation. He finds that countries that depend on agriculture have difficulty collecting taxes because of the predominance of informal activities in this sector. In contrast, since industrial activities and services are better organized, they are easier to tax (Crivelli & Gupta, Citation2014; Thomas & Treviño, Citation2013).
In addition to economic determinants, performance in public revenue mobilization may be affected by the institutional context. Various studies have shown that tax collection is one of the most important areas where corruption is most likely to appear (Feger, Citation2014; Hossain, Citation2014; Syadullah & Wibowo, Citation2015). Ajaz and Ahmad (Citation2010) and Imam and Jacobs (Citation2014) confirms these findings. The GMM and the system-GMM regression results show that institutional variables have significant effect on tax revenues. The study concludes that governance and corruption are two main determinant of tax revenue. Corruption has adverse effect on tax collection, while good governance contributes to better performance in tax collection. The study concludes that corruption has negative and significant effect. Governance has positive and significant effect on tax revenues, this shows that good governance brings good tax system; governance has positive relation with tax system.
2.2. Links between illicit financial flows and resource mobilization
The ever-increasing interest in illicit financial flows has led to production of a large body of literature on the subject (Dyreng et al., Citation2015; Zucman, Citation2014). The same interest is also attributable to the many significant effects which illicit financial flows have on the levels of development of different countries (Epaphra, Citation2015; Herkenrath, Citation2014; Ortega et al., Citation2018). Most striking is the effect they have on public bodies. According to Kar and Cartwright-Smith (Citation2010), those capital outflows, which could have been spent on public service expenditures, undermine economic development in poor countries. Not only do illicit financial flows have a direct impact on public service delivery, they also threaten the stability and credibility of a country’s financial system and its institutions (Fontana, Citation2010).
With respect to the relationship between illicit financial flows and public revenues, existing literature is unanimous about the fact that the former constitute an obstacle to resource mobilization and wealth creation (Ayadi, Citation2008; Ritter, Citation2015). Moreover, some studies suggest that they erode the tax base (Ajayi, Citation1997). In fact, empirical studies conducted in several African countries have indicated that the public debt burden would disappear if illicit financial flows were stopped (Fofack & n.d.ikumana, Citation2015; Forgha, Citation2008).
Ndikumana (Citation2009) found that illicit capital flight affected a country’s budget balance by reducing its tax base through a contraction of its economic activity. The erosion of the tax base occurs because funds sent abroad cannot be taxed since they are out of the reach of tax authorities in the countries of origin. This result corroborates that obtained by Iweala et al. (Citation2003) in a study conducted in Nigeria.
Kar and Leblanc (Citation2014), using a double-squares method, found that illicit financial flows negatively affected domestic revenues in the Philippines over the 1960–2011 period. Incoming IFFs negatively and significantly reduced the country’s tax collection rate and strengthened its underground economy. The country incurred a significant wealth loss representing about 37% of its social budget in 2011. By testing the robustness of their results using a Vector Error Correction Model, the authors showed that in the long run a higher performance in tax collection required a reduction in illicit financial flows. This result corroborates that obtained by Macharia (Citation2014) in a study based on data from Kenya.
All these studies have shown that the effects of illicit financial flows were the same, whether the study used a descriptive approach or an econometric one. However, only a few of them have focused on the impact of illicit financial flows on public revenues through transmission channels to which illicit financial flows seem to be tied (Ndikumana & Boyce, Citation2012). This study attempts to do that.
3. Illicit financial flows in the West African Economic and Monetary Union countries
Given the lack of consensus on the definition of illicit financial flows, measuring them is not easy. Economists frequently use three models to measure the size of illicit financial flows: the hot-money model (Cuddington, Citation1986); the World Bank residual model (World Bank, Citation1985); and trade misinvoicing (GFI, Citation2008).
The hot-money model uses net errors and omissions in the balance of payments to estimate illicit financial flows. A constantly high and negative net value of errors and omissions is seen as a sign of illicit capital flows. The World Bank model is used to determine a country’s source of funds for their registered use. Any inflow of funds that exceeds its stated use is considered non-allocated capital and, hence, illicit financial flows (Boyce & n.d.ikumana, Citation2001). Unlike the previous two models, fraudulent misinvoicing involves comparing exports and imports between partner countries. Differences in trading data, after adjusting for transport and insurance costs, which suggest over- or under-invoicing, are evidence of some illicit financial flows (BCEAO, Citation2013; Kar & Cartwright-Smith, Citation2008).
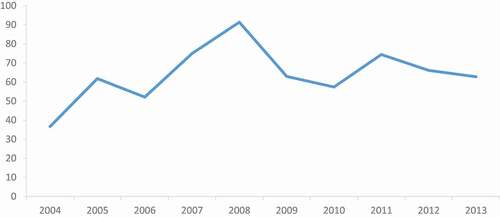
An analysis of illicit financial flows within the West African Economic and Monetary Union area highlights the significance of the phenomenon in the decade 2004–2013 (see ). Illicit financial flows followed an upward trend with uneven fluctuations: for example, they were on an upward trend from 2004 to 2008, decreasing between 2008 and 2009, most likely due to the 2008 financial crisis, and increasing again from 2010 ().
Figure 1. Trends in IFFs in the WAEMU area from 2004 to 2013 (in US$ millions) Source: Author’s based on data from the .GFI (Citation2013)
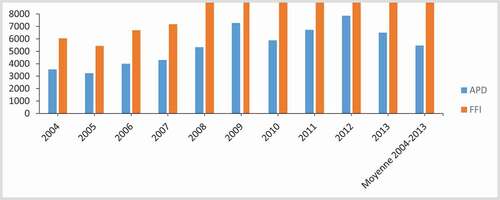
compares illicit financial flows with inflows of ODA in the West African Economic and Monetary Union area from 2004 to 2013, in current US dollars. During this period, illicit financial flows exceeded the ODA received annually and increased over time: the average was US$80 billion, against only US$50 billion for ODA. This observation corroborates that made by the High-Level Group (Citation2015), namely that African countries on average lose between US$50 billion and 148 billion per year (BCEAO, Citation2013).
Figure 2. IFFs vs. ODA in the WAEMU area from 2004 to 2013 Note: In blue, APD: ODA; in orange, FFI: IFF Average for 2004–2013 Source: Author’s compilation based on data from the .GFI (Citation2013) and the World Bank (Citation2014a)
An analysis of the average share of illicit financial flows in GDP during the same period reveale three groups of countries: in the first group, composed of just one country, Togo, this average share was 137%. In the second group, it was between 10% and 20%: Côte d’Ivoire (20%), Guinea Bissau (15%), Senegal (13%), Burkina Faso (10%) and Mali (10%). For the third group it was between 4% and 6%: Niger (6%) and Benin (4%) (see ).
Figure 3. IFFs as a percentage of GDP (averages for the 2004–2013 decade) Source: Author’s compilation based on data from the .GFI (Citation2013)
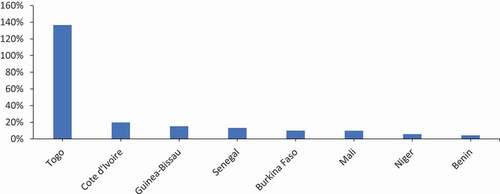
The fact that the average share was highest for Côte d’Ivoire and Togo confirms the conclusion reached by GFI (Citation2013) that these two countries were among the 10 African countries with the highest amounts of illicit financial flows. In the case of Togo, the high proportion is attributable to the role it plays as one of the leading countries in West Africa in “warehouse trade”. Indeed, most of the goods that go through Togo in transit to Burkina Faso are diverted to Nigeria through contraband channels (GFI, Citation2013). During the period under study Côte d’Ivoire was going through a socio-political crisis. In addition, the country is rich in natural resources, for example, cocoa, which according to GFI, Citation2013) accounts for 49.7% of its illicit financial flows, according to GFI (Citation2013).
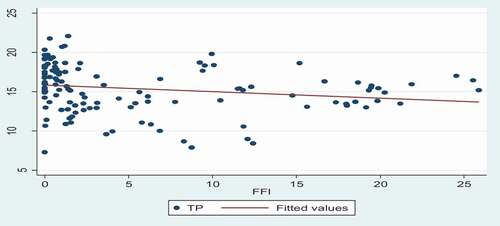
presents a scatter plot of public revenues (as a percentage of GDP) and illicit financial flows. It shows a negative relationship between these two variables: an increase in the illicit financial flows is associated with a decrease in public revenue mobilization. It follows from this that countries experiencing huge amounts of illicit financial flows achieve a low rate of public revenue mobilization.
Figure 4. Relationship between public revenues and IFFs Note: TP is the ratio of government revenues to GDP; FFI: IFFs Source: Author’s compilation
All in all, descriptive statistics attest to high rates of illicit financial flows in the WAEMU countries. Therefore, the following questions arise: Can these rates account for the poor performance in public revenue mobilization in these countries? Which transmission channel contributes most to the effect of those illicit financial flows on this poor performance?
Empirical analysis of the effect of illicit financial flows on government revenues
Section 2 reviewed the theoretical and empirical literature aimed at providing insights into the effect of illicit financial flows on government revenues in the West African Economic and Monetary Union area. This section aims to examine this effect empirically, which means establishing a relationship between the two variables. This relationship is expected because taxation plays a key role in the growth of an economy, since it is the main mode of financing development (Brun et al., Citation2005; Di John, Citation2007; Fakile et al., Citation2014; OECD, 2010).
Since public revenues are a source of development funding (Aghion et al., Citation2016; Dennis-Escoffier & Fortin, Citation2008), any factor that can stimulate economic growth is pro these revenues (and vice versa). That is why research on the impact of illicit financial flows needs to closely examine the relationship between such factors and taxation. More specifically, it is important to establish whether illicit financial flows do indeed have a negative impact on tax collection in the West African Economic and Monetary Union countries.
This study first specifies the model to be used then describes the nature and source of variables, the estimation techniques, and the results of the estimations and how to interpret them.
3.1. Modelling the effect of illicit financial flows on government revenues
The theoretical framework underlying our empirical analysis is known as budget response modeling. The basic model is due to Heller (Citation1975) and has been refined by different authors (Ghura, Citation1998; Leuthold, Citation1991; Sani, Citation2009). Fiscal response models examine the response of the aid-receiving government in terms of the trade-off between various sources of revenue and public expenditure. These models view governments as rational agents who maximize the value of some ultimate goal, such as the rate of economic growth. Governments do this by directing certain policy variables to their desired level value. In practice, the modeling is done in the form of a quadratic loss function that achieves maximum utility when the policy targets are met. This utility function is then optimized within the budget constraint that expenditures cannot exceed revenues.
While the question that these models attempt to address is interesting, the way in which this is typically done has been criticized. The most important criticism is the need to propose credible target variables for intermediate policy variables, such as government expenditures and revenues. Despite the lack of consensus on the theory, Leuthold (Citation1991) and Sani (Citation2009) have adopted Heller’s model. All these models analyze the utility function of the public sector:
where Y-T (GDP exclusive of taxes) represents the private sector’s disposable income; G the total government expenditure; D the net domestic borrowing; and F + L the net foreign financial assistance to the country (F = grants; L = borrowing).
The public sector budget constraint is expressed in the following equation:
Following Leuthold’s (Citation1991) model, the taxation rate (T/Y) is a function of the normal taxation rate (T/Y)* of tax base B; the economic policy (PE); and the level of corruption (C):
In this study, corruption and illicit financial flows are linked and can produce the same effects on public revenue mobilization. In this case, EquationEquation 3(3)
(3) will be rewritten as follows:
The desired public revenue mobilization rate is determined by maximizing EquationEquation 1(1)
(1) under the constraint of EquationEquation 2
(2)
(2) . It is assumed that the utility function takes a quadratic form (Heller, Citation1975).
The literature on the determinants of public revenue mobilization offers a whole series of testable hypotheses. This study seeks to highlight the impact of illicit financial flows on public revenue mobilization. It assumes that this impact is negative. Indeed, studies (such as Attila et al., Citation2009; Ghura, Citation1998) have reported a negative impact of corruption on tax revenues. Starting from the assumption that corruption is likely to be a conducive environment for illicit financial flows, it is only logical to hypothesize that they in turn will have a negative effect on public revenues. This hypothesis will be tested on a group of West African Economic and Monetary Union countries. However, changes will be necessary in order to include the variables of interest that will enable the study to answer its research questions.
Following this theoretical framework, this study will use an approach developed by Mo (Citation2001) and borrowed by Attila et al. (Citation2009). It is a three-step approach: first, it analyzes the direct impact of illicit financial flows on public revenues. At this step, control variables with a temporal dimension are introduced. At the second step the study estimates the effect of illicit financial flows on each of the control variables representing the transmission channels. The third step incorporates this latter model into the first specification.
To estimate the effect of the illicit financial flows on public revenues, the following specification will be used:
where TP represents the ratio of government revenues to GDP; FFI represents the value of the illicit financial flows; X is a vector of the variables that are likely to affect public revenues; µi designates the specific individual effect, which can be fixed or random; νt represents the specific temporal effect; ε represents the error term; i is the name of the country; and t is the period under study.
The specification in EquationEquation 5(5)
(5) represents only the direct effects of illicit financial flows on public revenues. It is suggested (Benassi & Dorigatti, Citation2015; Ndikumana, Citation2014), in line with the existing literature, that illicit financial flows are a ubiquitous phenomenon that negatively affects the functioning of the economy in several ways. The focus in this case is the transmission channels through which illicit financial flows can affect public revenues, channels that are represented by the other explanatory variables.
The aim is to measure the relative effect of the different transmission channels on the level of public revenues. This will be done by isolating the illicit financial flows effect that is transmitted through the other explanatory variables. Two steps will be followed: first, a correlation will be tested between illicit financial flows and each one of the explanatory variables representing the transmission channels:
where represents the explanatory variables considered to be the transmission channels and
the variable “illicit financial flows”.
The second step incorporates EquationEquation 6(6)
(6) into the previously estimated model (EquationEquation 5
(5)
(5) ). This means that as many residues are incorporated as the variables that are likely to represent the transmission channels. The model is expressed as follows:
where i = 1, 2, 3, … .n and j = 1, 2, 3 … … m; α1 FFI is the direct effect of the illicit financial flows on public revenues; (α1+ iβj) FFI is their indirect effect; and ηit the residues of EquationEquation 6(6)
(6) .
3.2. Description and sources of variables
To study the effect of illicit financial flows on public revenues in the West African Economic and Monetary Union countries, it is very useful not only to describe the different variables of the model, but also to provide their sources (Annex B). The data used in the empirical modelling come mainly from the databases of the World Bank (Citation2014a, Citation2014b), the BCEAO (Citation2014) and GFI (Citation2013).
3.2.1. Choice of the dependent variable: government revenues
The two most commonly used indicators in the literature (Ajaz & Ahmad, Citation2010; Torrance & Morrissey, Citation2013) to measure a country’s level of government revenue mobilization are the tax burden ratio and the government revenue mobilization ratio. Since tax revenues do not cover all government revenues, it is difficult to make comparisons between countries that are able to mobilize huge amounts of non-tax revenues; that is the case of countries that are rich in natural resources. This limitation is overcome by using the government revenue mobilization ratio. This ratio is calculated as the sum of the total government revenues as a percentage of the country’s GDP. It is preferable to the tax burden ratio because it has the advantage of being less sensitive to the substitution effect between the major categories of public resources (Diarra, Citation2012). For this reason, it is the ratio that was used in this study.
3.2.2. Analysis of the control variables
The government revenue mobilization rate is a function of a set of variables. Since the pioneer work of Shin (Citation1969), Lotz and Morss (Citation1970), and Bahl (Citation1971), various studies have identified the structural factors in government resource mobilization (Basirat et al., Citation2014; Velaj & Prendi, Citation2014). These empirical studies have explored factors that are likely to affect government revenues in both developing and developed countries. However, it is difficult to encounter all the variables at the same time in the same study (Attila et al., Citation2009; Diarra, Citation2012).
Ajaz and Ahmad (Citation2010) analyzed the effect of institutional (i.e., related to corruption and governance) and structural variables on tax revenues for 25 developing countries between 1990 and 2005. They found that corruption has a negative effect on tax revenues while good governance improves the tax collection rate.
Velaj and Prendi (Citation2014) investigated the relationship between tax revenue collection and other variables, including the per capita GDP, the inflation rate, and imports of goods and services from 2001 to 2013 in the case of Albania. They found a positive relationship between these three variables and tax revenue collection.
Ángeles Castro and Ramírez Camarillo (Citation2014) developed an empirical model for 34 Organisation for Economic Co-operation and Development (OECD) countries for the 2001–2011 period. They found that the per capita GDP, the share of industry in GDP, and civil liberties had a positive impact on tax revenues, while the share of the agriculture sector in GDP had a negative impact on tax collection.
This study mainly followed the framework used by Ajaz and Ahmad (Citation2010), but it also considered the traditional determinants of tax collection. The main difference between this study and that of Ajaz and Ahmad (Citation2010) is that it analyzed the effect of illicit financial flows on government revenues in their totality.
Level of development. The effect of a country’s level of development on its revenue mobilization capacity has been demonstrated both theoretically and empirically (Tanzi, Citation1992). This indicator is most often represented by several variables such as the country’s real per capita income and its degree of monetization. Several studies have found a positive and significant effect of the level of development on government revenues, while only a few have found a negative effect of it (Dioda, Citation2012; Torrance & Morrissey, Citation2013). The positive relationship between the per capita GDP and government revenues has been further expanded by referring to Wagner’s law, which states that the share of public expenditure in GDP increases with the standard of living. In this study, the level of development was represented by the real per capita income.
The share of agriculture in GDP. The share of the agriculture sector and that of the industry sector in GDP are most often considered the two indicators of an economy’s structure. Tanzi (Citation1992) argues that a country’s economic structure is one of the factors likely to influence its tax collection rate. The author shows that in the developing countries the agriculture sector has a significant impact on tax revenues from both demand and supply. The higher the share of the agriculture sector in the GDP, the less well those countries do in raising taxes. This negative relationship is justified by the fact that the agriculture sector is difficult to tax, especially if it is dominated by a large number of subsistence farmers. Torrance and Morrissey (Citation2013) and Imam and Jacobs (Citation2014) drew the same conclusion.
The inflation rate. The inflation rate is used to characterize macroeconomic instability. There is often a mismatch between the tax date and the tax collection date. In such a situation, the real value of the tax revenues collected is influenced by the inflation rate (Tanzi, Citation1992). When this is too high, it discourages the mobilization of public resources by reducing the value of the tax revenues (Hakim & Bujang, Citation2011).
Trade openness. The effect of trade openness on public revenue mobilization, particularly of tax revenues, has been viewed differently by economists. For some, a country’s economic openness has a positive influence on this mobilization (Cagé & Gadenne, Citation2016; Jafri et al., Citation2015). For others, it could have a negative effect on the level of public revenues, particularly through the reduction in tariffs, which trade openness implies (Bevan, Citation1999). So, its effect on government revenue mobilization is more or less uncertain; an econometric analysis is thus needed to clarify the relationship involved. Trade openness is measured by the sum of imports and that of exports in relation to GDP.
Institutional variables. The choice of these variables as explanatory variables is relevant insofar as they allow us to have an idea of the effect of the institutional quality on government revenue mobilization and of a possible policy to fight illicit financial flows. Recently, theoretical and empirical studies have both highlighted the effect of institutional factors on government revenue mobilization (Feger, Citation2014; Hossain, Citation2014; Syadullah & Wibowo, Citation2015). The institutional quality measures come from the data set compiled by Kaufmann et al. (Citation2010). This study uses corruption and governance indicators, namely the control of corruption index and the government effectiveness index.
The variable of interest: Illicit financial flows. In the literature, the phrases illicit financial flows and capital flight are often used interchangeably (Kar & Cartwright-Smith, Citation2008; Ndikumana & Boyce, Citation2012). However, by definition, and in reality, the two are different. There are two forms of capital flight: a legal form and an illegal one. The legal form corresponds to capital that goes out of the country but is registered in the accounting books of the entity performing the outgoing transfer. This form of capital flight is resorted to by savers/investors looking for higher returns or more stable environments. As for the illegal form of capital flight, it is not registered anywhere and most often escapes the tax system.
In the case of illicit financial flows, the goal of the owners of these funds is to hide them and avoid legal action (High Level Group, Citation2015; Ndikumana, Citation2014).Footnote1 The owners are sometimes willing to accept low or even negative returns as long as they manage to hide the illegal origin of the funds. So, it is only fitting to characterize these hidden resources as illicit since they are unregistered capital flows from criminal activities, corrupt practices and trading activities.
3.3. Results of the econometric estimations
This study is about the West African Economic and Monetary Union countries for which data are available and covers the 1996–2013 period. There is thus a double dimension to the size of the sample, which allows the study to group the data into panels. There are many advantages to panel-data models. For one thing, they allow the taking into account of individual and temporal dimensions, unlike time series and cross-sections, and, in addition, they can handle a very large number of varied data (Sevestre, Citation2002).
The descriptive statistics of data used are presented in annex C. The data show that the average public tax rate were about 15.4% of GDP. This low rate confirms the difficulties in meeting the convergence criterion on fiscal mobilization (20% of GDP). There is also a very high average inflation rate of 3.27%, exceeding even the standard set by the Union (3%). The FFI indicator shows that illicit capital flight is relatively high in the WAEMU zone. The average share of these flows in GDP is 5.62 percent. These figures confirm that there is a significant outflow of illicit financial flows in these countries.
Annex D depicts the result the result of the correlation matrix. The result indicates a positive correlation between the public tax rate, average per capita income, trade openness, corruption and governance. On the other hand, the correlation relationship is negative between the public tax rate, the share of value added and illicit financial flows. The correlation coefficient between illicit financial flows and public tax rate is negative (- 0.1961). This suggests that the public tax rate and the illicit financial flows in this sample are not moving in the same direction or negatively correlated.
3.3.1. Illicit financial flows and the government revenue mobilization rate
The model used in this study was first estimated using the quasi-generalized least squares (QGLS) method. According to Sevestre (Citation2002), this method optimally combines intra- and inter-individual variations. It also solves the problems of heteroscedasticity and autocorrelation between the explanatory variables at the individual level and between countries. It rests on the assumption that there is no correlation between the explanatory variables and the country-specific effects. However, in the face of measurement errors and a low temporal variability on the part of the variable of interest, the use of the fixed-effects method is not appropriate.
The results of the estimations of EquationEquation 5(5)
(5) using the QGLS method are reported in . Illicit financial flows have a negative and significant effect on the government revenues of the countries in the sample (). This means that the massive outflow of capital from those countries has led to a significant reduction in their public revenue mobilization rate. These results confirm those obtained by several previous empirical studies (Ayadi, Citation2008; Ndikumana, Citation2009; Pastor, Citation1990).
Table 1. Results of the estimation of the QGLS model
The robustness of these results is validated by the fact that by controlling, through several variables, for the effect of financial flows, the relationship remains negative and significant. Illicit financial flows have a negative effect on public revenue mobilization in the West African Economic and Monetary Union countries. They hinder this mobilization and they are likely to cause honest taxpayers to engage in tax avoidance practices (Diarra, Citation2012).
With respect to control variables, the results show that corruption has a negative and significant effect on the government revenue mobilization rate. This result corroborates those obtained by various other studies (Attila et al., Citation2009; Diarra, Citation2012). It means that the high level of corruption in the West African Economic and Monetary Union countries has contributed to significantly reducing their public revenues. The same result calls into question the old but optimistic theory that corruption “fuels the economic wheel” and renders the economies more efficient. In contrast to corruption, government effectiveness was found to have a positive and significant effect on government revenues. This result suggests that effective institutions contribute to improving public revenue collection (Ajaz & Ahmad, Citation2010).
The level of development was found to have a positive and significant effect on government revenues. This result is consistent with the theoretical literature which argues that government revenues increase with the per capita income (Tanzi, Citation1992).
Trade openness was found to have a positive and significant effect on the public revenues of the West African Economic and Monetary Union countries. This result confirms those obtained by the proponents of a positive effect of trade openness on government revenues (Dioda, Citation2012; Pessino & Fenochietto, Citation2010). It also suggests that the positive effect is due not only to the tax reforms undertaken in the West African Economic and Monetary Union area since the 2000s (cf. the Common External Tariff adopted in 2014), but also to institutional reforms, notably the modernization of the tax administration (for example, with the 2013 new general tax code in Senegal).
3.3.2. The endogeneity test
The Durbin-Wu-Hausman test, the null hypothesis for which is the exogeneity of the suspected endogenous variable, does not reject the null hypothesis of the exogeneity of IFFs. However, it rejects the corruption hypothesis at the 5% threshold. Thus, the corruption variable is endogenous (). Indeed, the endogeneity can first of all come from a measurement error arising from the fact that the estimators provided by the indicators of corruption and their level of precision relate only to the perception of it and not to the phenomenon itself. The endogeneity bias may also result from the omission of explanatory variables that are correlated with the level of corruption. Finally, it can also be attributed to a simultaneity bias (Sanyal et al., Citation2000). To overcome this difficulty, estimations done using the instrumental variable method, which seems more convergent than the ordinary least squares one, were referred to.
Table 2. Results of the Durbin-Wu-Hausman endogeneity test
Traditionally the literature provides four types of instruments: ethnolinguistic division, legal traditions (French and British), distance from the equator,Footnote2 and the urbanization rate (Adserà, Citation2003; Uslaner, Citation2004). By way of instruments, this study used the location of a given West African Economic and Monetary Union country in relation to the coast, the number of borders with countries outside West African Economic and Monetary Union, and the urbanization rate. On the face of it, these variables do not have a direct link with tax revenues while at the same time being correlated with corruption (Attila et al., Citation2009).
Several studies have shown that geographical position, culture and population are determinants of corruption. For example, Sandholtz and Gray (Citation2003) found that countries surrounded by corrupt countries seemed to be equally corrupt. For the authors, this could be attributed to the sharing of the same culture. La Porta et al. (Citation1997) and Gerring and Thacker (Citation2005) suggested that the latitude (relative to the equator) had a negative and significant effect on corruption. Knack and Azfar (Citation2003) and Damania et al. (Citation2004) found a positive correlation between population and corruption. However, their results were contradicted by those obtained by Tavares (Citation2003). The economic rationale for the use of such instruments lies in the fact that a country’s geographical characteristics are said to influence its setting up of sustainable institutions (Acemoglu et al., Citation2001), which in turn have an impact on the extent of corruption.
The results are presented in . The p-value for the Hansen instrument validity test is higher than 5%. Moreover, the Durbin-Wu-Hausman test rejects the hypothesis of exogeneity of the corruption variable, which is an indication of the superiority of the instrumental variable method. To estimate the effects of illicit financial flows on tax revenue, we use the instrumental variable (IV) method in order to address endogeneity problems.
Table 3. Results of the estimation with the instrumental variable (IV) model
Illicit financial flows have a negative and significant effect on government revenues, which corroborates the theoretical predictions. For the entire sample and over the period under study, results showed that a 1 standard-deviation increase in illicit financial flows reduced the public revenue mobilization ratio by 0.85 points.
3.3.3. Highlighting the transmission channels
presents the results of EquationEquation 6(6)
(6) . Illicit financial flows were negatively correlated with the per capita GDP and with the government effectiveness variable. Illicit financial flows undermine good governance to the extent that they contribute to compromising a country’s capacity for action (BCEAO, Citation2013). A positive relationship was observed between illicit financial flows and corruption (Fontana, Citation2010). Typically, illicit financial flows are associated with the high costs of corruption (Benassi & Dorigatti, Citation2015).
Table 4. The effect of the IFFs on the main transmission channels
3.3.4. Relative contributions of the transmission channels
presents the relative contributions of the different transmission channels. These contributions were calculated using the coefficients in . Three channels contribute to the effect of the illicit financial flows on government revenues: the per capita income, corruption and governance. The contribution of the per capita income is the most important: up to 10%. It is followed by that of corruption, 5.5%. The government effectiveness channel contributes only 3.02%. The total indirect effect of illicit financial flows on government revenues represents 60% of the total effect.
Table 5. Relative contributions of the different transmission channels
4. Conclusion
This study has shown that illicit financial flows cause heavy losses to the economies in the West African Economic and Monetary Union area. The study’s econometric results show that illicit financial flows have a negative and significant effect on the public revenue mobilization of the West African Economic and Monetary Union countries. In particular, they highlight the significant impact of the per capita income, corruption, and governance, as transmission channels, on this mobilization.
The study recommends that governments should reconsider their policies for combating illicit financial flows. In particular, they should strengthen their tax collection capacity to better identify and prevent certain illegal activities associated with illicit financial flows. At the regional level, the West African Economic and Monetary Union Commission should consider setting up an appropriate illicit financial flows consultative body that would bring together state and non-state actors. This body would serve as a platform for consultation, sharing of experiences, and discussing illicit financial flows issues.
With regard to the per capita income as the main transmission channel, governments should put in place the incentives that people need to keep and invest a large part of their profits and savings in their countries of origin.
This study has several limitations. The main one lies in the difficulty encountered when collecting data. Research on the issue would be enriched if the econometric analysis focused on the structure of tax revenues, particularly on direct and indirect taxes. Finally, this research can be taken a step further by looking at the investment and job-creation losses resulting from illicit financial flows.
Annex A: Trends in the government revenue mobilization rate by country from 1980 to 2013
Annex B: Description of the variables
Annex C: Descriptive statistics
Annex D: Correlation Matrix
Acknowledgements
The author is grateful for comments and observations from participants at the AERC Biannual Research Workshop, Addis Ababa, Ethiopia, December 2015; Dakar, Senegal, December 2016; Arusha, Tanzania, December 2017.
Disclosure Statement
No potential conflict of interest was reported by the author.
Additional information
Funding
Notes on contributors
Abdou Thiao
Abdou Thiao is a lecturer at Department of Economics, Cheikh Anta Diop University (Senegal). He has his PhD in Applied Economics (Cheikh Anta Diop University). His research interest include Economic Policy, financing development, capital flight, tax revenue, fiscal decentralization, games theories and structural transformation.
Notes
1. GFI (Global Financial Integrity) is a non-governmental organization (NGO) researching issues of illicit financial flows.
2. The exclusion of Guinea Bissau was due to the non-availability of data in the country.
References
- Acemoglu, D., Johnson, S., & Robinson, J. A. (2001). The colonial origins of comparative development: An empirical investigation. American Economic Review, 91(5), 1369–24. https://doi.org/10.1257/aer.91.5.1369
- Adserà, A. (2003). Are you being served? Political accountability and quality of government. Journal of Law, Economics, and Organization, 19(2), 445–490. https://doi.org/10.1093/jleo/ewg017
- AfDB. (2010). Évaluation du potentiel de recettes publiques au Sénégal. In Étude économique et sectorielle. Département-Pays (Vol. 2). Région Ouest.
- Aghion, P., Akcigit, U., Cagé, J., & Kerr, W. R. (2016). Taxation, corruption, and growth. European Economic Review, 86, 24–51. https://doi.org/10.1016/j.euroecorev.2016.01.012
- Ajayi, I. S. (1997). ‘An analysis of external debt and capital flight in the severely indebted low income countries in sub-Saharan Africa’. IMF WP/97/68. International Monetary Fund.
- Ajaz, T., & Ahmad, E. (2010). The effect of corruption and governance on tax revenues. Pakistan Development Review, 49(4II), 405–417. https://doi.org/10.30541/v49i4IIpp.405-417
- Ángeles Castro, G., & Ramírez Camarillo, D. B. (2014). Determinants of tax revenue in OECD countries over the period 2001–2011. Contaduría y Administración, 59(3), 35–59. https://doi.org/10.1016/S0186-1042(14)71265-3
- Anware, N. (2014). Determinants of Tax Revenue Performances in Ethiopia: Mini research paper November 2014. Jimma University.
- Attila, G., Chambas, G., & Combes, J. (2009). Corruption et mobilisation des recettes publiques: Une analyse économétrique. Recherches Économiques de Louvain, 75(2), 229–268. https://doi.org/10.3917/rel.752.0229
- Ayadi, F. S. (2008). Econometric analysis of capital flight in developing countries. Florence, Italy, 18–19 October. Paper presented at 8th Global Conference on Business and Economics, Florence, Italy.
- Bahl, R. W. (1971). A regression approach to tax effort and tax ratio analysis. International Monetary Fund Staff Papers, 18(3), 570–612. https://doi.org/10.2307/3866315
- Bank, W. (1985). World development report.
- Bank, W. (2014a). World Development Indicators.
- Bank, W. (2014b). World governance indicators.
- Basirat, M., Aboodi, F., & Ahangari, A. (2014). Analyzing the effect of economic variables on total tax revenues in Iran. Asian Economic and Financial Review, 4(6), 755–767.
- Baunsgaard, T., & Keen, M. (2010). Tax revenue and (or?) trade liberalization. Journal of Public Economics, 94(9–10), 563–577. https://doi.org/10.1016/j.jpubeco.2009.11.007
- BCEAO. (2013). Base de données économique et financière (Edition en ligne). https://www.bceao.int/
- BCEAO. (2014). Base de données économique et financière (Edition en ligne). https://www.bceao.int/
- Benassi, C., & Dorigatti, L. (2015). Straight to the core: The IG metal campaign towards agency workers. British Journal of Industrial Relations, 53(3), 533–555. https://doi.org/10.1111/bjir.12079
- Bevan, D. (1999). Trade liberalisation and the budget deficit. Journal of Policy Modeling, 21(6), 635–694. https://doi.org/10.1016/S0161-8938(97)00102-6
- Bird, R. M., Martinez-Vazquez, J., & Torgler, B. (2008). Tax effort in developing countries and high income countries: The impact of corruption, voice and accountability. Economic Analysis and Policy, 38(1), 55–71. https://doi.org/10.1016/S0313-5926(08)50006-3
- Botlhole, T. D. (2011). Natural resources, institutions and tax revenue mobilization in sub-Sahara Africa. International Conference on Applied Economics.
- Boyce, J. K., & Ndikumana, L. (2001). Is Africa a net creditor? New estimates of capital flight from severely indebted sub-Saharan African countries, 1970–1996. Journal of Development Studies, 38(2), 27–56. https://doi.org/10.1080/00220380412331322261
- Brun, J. F., Chambas, G., & Combes, J. L. (2005). Chapitre 2. La réduction des inégalités pour une meilleure mobilisation fiscale. In G. Chambas (Ed.), Afrique au Sud du Sahara: Mobiliser des ressources fiscales pour le développement, Economica (pp. 22–38).
- Cagé, J., & Gadenne, L. (2016). Tax revenues and the fiscal cost of trade liberalization, 1792–2006. Explorations in Economic History, 70, 1–24. https://doi.org/10.1016/j.eeh.2018.07.004
- Crivelli, E., & Gupta, S. (2014). Resource blessing, revenue curse? Domestic revenue effort in resource-rich countries. European Journal of Political Economy, 35(C), 88–101. https://doi.org/10.1016/j.ejpoleco.2014.04.001
- Cuddington, J. T. (1986). Capital flight: Estimations, issues, and explanations (English). (Country Policy Department discussion paper no. CPD 1985-51). World Bank.
- Culpeper, R., & Bhusshan, A. (2010). Why enhance domestic resource mobilisation in Africa? Trade Negotiations Insights, 9(6), 5–7. https://www.ictsd.iisd.org/
- Damania, R., Fredriksson, P. G., & Mani, M. (2004). The persistence of corruption and regulatory compliance failures: Theory and evidence. Public Choice, 121(3–4), 363–390. https://doi.org/10.1007/s11127-004-1684-0
- Dennis-Escoffier, S., & Fortin, K. (2008). Taxation for decision makers. South-Western Publishing. South-Western College Pub. Retrieved from March 8 2013, http://www.google.ro/books
- Di John, J. (2007). Oil abundance and violent political conflict: A critical assessment. The Journal of Development Studies, 43(6), 961–986. https://doi.org/10.1080/00220380701466450
- Diarra, S. (2012). Chocs et Mobilisation des Recettes Publiques dans les Pays en Développement. Économies et finances [PhD Thesis], CERDI, University of Auvergne.
- Dickinson, B. (2014). Flux financiers illicites et développement: Commentaires sur « Fuite des capitaux et paradis fiscaux: Impact sur l’investissement et la croissance en Afrique. Revue d’économie du développement, 22(2), 143–149. https://doi.org/10.3917/edd.282.0143
- Dioda, L. (2012). Structural Determinants of Tax Revenue in Latin America and the Caribbean, 1990–2009. In Economic Commission for Latin America and the Caribbean (ECLAC). LC/MEX/L.1087 (pp. 2-39). Press in United Nations.
- Dyreng, S., Hanlon, M., Maydew, E. L., & Thornock, J. R. (2015). Changes in corporate effective tax rates over the past twenty-five years [Mimeo]. MIT Press.
- Epaphra, M. (2015). Tax rates and tax evasion: Evidence from missing imports in Tanzania. International Journal of Economics and Finance, 7(2), 122–137. https://doi.org/10.5539/ijef.v7n2p122
- European Commission for Africa. (2014). Rapport intérimaire du Groupe de haut niveau sur les flux financiers illicites en provenance d’Afrique (research report).
- Fakile, A. S., Adegbie, F. F., & Faboyede, O. S. (2014). Mobilizing domestic revenue for sustainable development in Africa. European Journal of Accounting Auditing and Finance Research, 2(2), 91–108. https://www.ea-journals.org/
- Feger, T. D. (2014). An analysis of the tax revenue components in sub-Sahara Africa. The Journal of Developing Areas, 48(4), 363–379. https://doi.org/10.1353/jda.2014.0077
- Fofack, H., & Ndikumana, L. (2015). Capital flight and monetary policy in Africa. In I. Ajayi & L. Ndikumana (Eds.), Capital flight from Africa: Causes. effects and policy issues, pp. 130–163. Oxford University Press.
- Fontana, A. (2010). What does not get measured does not get done: The methods and limitations of measuring illicit financial flows. U4 Brief 2010-2. U4 Anti-Corruption Resource Centre.
- Forgha, N. G. (2008). Capital flight, measurability and economic growth in Cameroon: An Econometric investigation. International Review of Business Research Papers, 4(2), 74–90. https://www.semanticscholar.org
- Gerring, J., & Thacker, S. C. (2005). Do neoliberal policies deter political corruption? International Organization, 59(1), 233–254. https://doi.org/10.1017/S0020818305050083
- GFI. (2008) . Illicit financial flows from developing countries, 2002–2006. Global Financial Integrity.
- GFI. (2010) . Illicit financial flows from Africa: Hidden resources for development. Global Financial Integrity.
- GFI. (2013) . Illicit financial flows from developing countries: 2004–2013. Global Financial Integrity.
- Ghura, D. A. D. (1998). Tax revenue in sub-Saharan–Africa—Effects of economic policies and corruption. IMF Working Papers 98/135. International Monetary Fund.
- Group, H. L. (2015). Rapport sur les flux financiers illicites en provenance d’Afrique. Groupe de haut niveau sur les flux financiers en provenance d’Afrique [Report]. Nations Unies Commission Economique pour l'Afrique.
- Gupta, A. S. (2007). ‘Determinants of tax revenue efforts in developing countries’. IMF Working. paper WP/07/184. International Monetary Fund.
- Hakim, T. A., & Bujang, I. (2011). The impact and consequences of tax revenues’ components on economic indicators: Evidence from panel group data. International Research Journal of Finance and Economics, 63, 82–95. http://dx.doi.org/10.5772/48415
- Heller, P. S. (1975). A model of public fiscal behavior in developing countries: Aid, investment, and taxation. American Economic Review, 65(3), 429–445. http://www.jstor.org/stable/1804844
- Herkenrath, M. (2014). Paradis fiscaux et fuite des capitaux en provenance des pays en développement: Implications sociales et politiques: Commentaires sur « Fuite des capitaux et paradis fiscaux: Impact sur l’investissement et la croissance en Afrique ». Revue d’économie du développement, 22(2), 151–156. https://doi.org/10.3917/edd.282.0151
- Hossain, M. I. (2014). The quality of governance and tax effort: Evidence from developed and developing countries. Research Report prepared for Case Study 5140143: International Political Economy.
- Imam, P. A., & Jacobs, D. (2014). Effect of corruption on tax revenues in the Middle East. Review of Middle East Economics and Finance, 10(1), 1–24. https://doi.org/10.1515/rmeef-2014-0001
- Iweala, O. N., Soludo, C. C., & Muhtar, M. (2003). The debt trap in Nigeria: Towards a sustainable debt strategy. Africa World Press.
- Jaffri, A. A., Tabassum, F., & Asjed, R. (2015). An empirical investigation of the relationship between trade liberalization and tax revenue in Pakistan. Pakistan Economic and Social Review, 53(2), 317–330. http://pu.edu.pk/home/journal/7/
- Kar, D., & Cartwright-Smith, D. (2008). Illicit financial flows from developing countries: 2002–2006. GFI Technical Report. Center for International Policy.
- Kar, D., & Cartwright-Smith, D. (2010). Illicit financial flows from Africa: Hidden resource for development. In Global financial integrity (GFI) (pp. 1-39). Global Financial Integrity.
- Kar, D., & Leblanc, B. (2014). Illicit financial flows from developing countries: 2002–2011. Global Financial Integrity.
- Karagöz, K. (2013). Determinants of tax revenue: Does sectorial composition matter? Journal of Finance, Accounting and Management, 4(2), 50–63.
- Kaufmann, D., Kraay, A., & Mastruzzi, M. (2010). ‘The worldwide governance indicators: A summary of methodology, data and analytical issues’. World Bank Policy Research Working Paper no. 5430. World Bank.
- Knack, S., & Azfar, O. (2003). Trade intensity, country size and corruption. Economics of Governance, 4(1), 1–18. https://doi.org/10.1007/s101010200051
- La Porta, R., Lopez-de-silanes, F., Shleifer, A., & Vishny, R. W. (1997). Legal determinants of external finance. Journal of Finance, 52(3), 1131–1150. https://doi.org/10.1111/j.1540-6261.1997.tb02727.x
- Leuthold, J. H. (1991). Taxes shares in developing countries: A panel study. Journal of Development Economics, 35(1), 3–6. https://doi.org/10.1016/0304-3878(91)90072-4
- Lotz, J. R., & Morss, E. R. (1970). A theory of tax level determinants for developing countries. Economic Development and Cultural Change, 18(3), 328–341. https://doi.org/10.1086/450436
- Macharia, J. K. (2014). The effect of tax evasion on tax revenues in Kenya. University of Nairobi.
- Mahdavi, S. (2008). The level and composition of tax revenue in developing countries: Evidence from unbalanced panel data. International Review of Economics and Finance, 17(4), 607–617. https://doi.org/10.1016/j.iref.2008.01.001
- Mo, P. H. (2001). Corruption and economic growth. Journal of Comparative Economics, 29(1), 66–79. https://doi.org/10.1006/jcec.2000.1703
- Ndikumana, L. (2009). Capital flight (K. Reinert & R. Rajah, eds.). The Princeton Encyclopedia of the World Economy, pp.1-6.Princeton University Press.
- Ndikumana, L. (2014). Fuite des capitaux et paradis fiscaux: Impact sur l’investissement et la croissance en Afrique. Revue d’Economie du développement, 22(2), 113–141. https://doi.org/10.3917/edd.282.0113
- Ndikumana, L., & Boyce, J. K. (2012). Capital flight from sub-Saharan African countries: Updated estimates, 1970–2010. Political Economy Research Institute (PERI) Research Report. Political Economy Research Institute.
- Ogunleye, E. K., & Fashina, A. D. (2009). The imperatives for domestic resource mobilization for sustained post-crisis recovery and growth in sub-Saharan Africa. African Economic Conference manuscript.
- Ortega, B., Sanjuán, J., & Casquero, A. (2018). Social costs of illicit financial flows in low- and middle-income countries: The case of infant vaccination coverage. Health Policy and Planning, 33(2), 224–236. https://doi.org/10.1093/heapol/czx170
- Pastor, M. (1990). Capital flight and the Latin American debt crises. Economic Policy Institute.
- Pessino, C., & Fenochietto, R. (2010). Determining countries’ tax effort. In [Hacienda pública española]. Revistã de Economía Pública (Vol. 195, pp. 61–68). Instituto de Estudios Fiscales.
- Reitano, T., & Shaw, M. (2014). People’s perceptions of organised crime in West Africa and the Sahel. Institute for Security Studies.
- Ritter, I. (2015). Illicit financial flows: An analysis and some initial policy proposals. Friedrich-Ebert-Stiftung.
- Sandholtz, W., & Gray, M. M. (2003). International integration and national corruption. International Organization, 57(4), 761–800. https://doi.org/10.1017/S0020818303574045
- Sani, M. (2009). Secteur non enregistré et mobilisation fiscale dans les pays en développement (PED): Le cas des pays d’Afrique au sud du Sahara (PASS) [PhD Thesis], CERDI.
- Sanyal, A., Gang, I. N., & Goswami, O. (2000). Corruption, tax evasion and the Laffer Curve. Public Choice, 105(1–2), 61–78. https://doi.org/10.1023/A:1005105822911
- Savvides, A. (1996). CFA franc Zone membership and exchange rate variability. Journal of African Economies, 5(1), 52–68. https://doi.org/10.1093/oxfordjournals.jae.a020899
- Sevestre, P. (2002). Économétrie des données de panel. Eco sup. Dunod septembre 2002. Ecop Sup, Dunod.
- Sharma, P., & Singh, J. (2015). Determinants of tax-revenue in India: A principal component analysis approach. International Journal of Economics and Business Research, 10(1), 18–29. https://doi.org/10.1504/IJEBR.2015.070268
- Shin, K. (1969). International difference in tax ratio. The Review of Economics and Statistics, 51(2), 213–220. https://doi.org/10.2307/1926733
- Sokolovskan, O. (2015). Trade freedom and revenue from trade taxes: A cross-country analysis. In MPRA 66421, University Library of Munich, Germany, revised 2015.
- Syadullah, M., & Wibowo, T. (2015). Governance and tax revenue in ASEAN countries. Journal of Social and Development Sciences, 6(2), 76–88. https://doi.org/10.22610/jsds.v6i2.845
- Tanzi, V. (1992). Fiscal policies in economies in transition. International Monetary Fund Publication Services.
- Tavares, J. (2003). Does foreign aid corrupt? Economics Letters, 79(1), 99–106. https://doi.org/10.1016/S0165-1765(02)00293-8
- Thomas, A., & Treviño, J. P. (2013). ‘Resource dependence and fiscal effort in sub-Saharan Africa’. IMF Working Paper, WP/13/188. International Monetary Fund.
- Thornton, J. (2014). Does foreign aid reduce tax revenue? Further evidence. Applied Economics, 46(4), 359–373. https://doi.org/10.1080/00036846.2013.829207
- Torrance, S., & Morrissey, O. (2013). Taxation and indigenous institutions in sub-Saharan Africa, CREDIT Research Paper, no. 14/04. The University of Nottingham, Centre for Research in Economic Development and International Trade (Credit), Nottingham.
- UNDP. (2011). Illicit financial flows from the least developed countries: 1990–2008 [UNDP discussion paper]. United Nations Development Programme.
- Uslaner, E. M. (2004). Trust and social bonds: Faith in others and policy outcomes reconsidered. Political Research Quarterly, 37(3), 501–508. https://doi.org/10.1177/106591290405700314
- Velaj, E., & Prendi, L. (2014). Tax revenue—The determinant factors. The case of Albania. European Scientific Journal, 10(1), 525–531. https://eujournal.org/index.php/esj/article/view/4121
- Zucman, G. (2014). Taxing across borders: Tracking personal wealth and corporate profits. Journal of Economic Perspectives, 28(4), 121–148. https://doi.org/10.1257/jep.28.4.121