
Abstract
The Omo National Park is under immense pressure as a result of the expansion of the Kuraz Sugar Factory and rapid population growth that resulted in illegal settlement and interferences. The present study assesses the trend and magnitude of LULCC and its major drivers in Omo National Park. To assess land cover changes, satellite imageries had been used within four dates of 1988, 1998, 2008 and 2018. Household surveys, key informant interviews, and FGDs were used to assess peoples understanding of the change and identify the potential drivers of LULCC. Semiautomatic Classification tool (QGIS) was used to extract information related to the trend and magnitude of LULCC. The classification has been done using six LC (grassland, woodland, forest, riverine-forest, built-up, and industrial-farm) classes. Image classification and accuracy assessment were properly performed. The results showed that overall accuracy was 84.95%, 85.93%, 82.70%, and 85.71% and the kappa coefficient value was 75%, 80%, 75% and 80% for the years 1988, 1998, 2008, and 2018, respectively. This study showed that in the last 30-year period, the national parks had been exposed to modification of land use. Within this time frame, grassland, forest, and riverine forest had significantly decreased by 41.36%, 3.95% and 0.19%, respectively, while woodland increased by 18.33%. Expansion of settlements and Kuraz-Sugar-Factory, population growth, and overgrazing coupled with the absence of well-defined boundary, and clear LU policies were identified as the main drivers of LCC in Park. Therefore, proper land and park management strategies and strong legal and regulatory frameworks should be developed.
PUBLIC INTEREST STATEMENT
Antropogenic activities are the major responsible factor for the modification of natural environment anywhere in the world. Land cover change has become one of the major challenges in Ethiopia. Land cover change affects the natural balance of the parks and the surrounding environment, this will resulted destruction of wildlife habitat and socio-economic dynamics on a global as well as local scale. Therefore, knowing the complexities of land cover change and its effect, is very critical for effective land resource management, particularly, where most people rely on natural resources from the park’s landscape. Therefore, this study provide an insights for researchers, park managers, planners and decision-makers to understand the dynamic nature of the park environment for the last decades and helps to expand further researches and take appropriate measures to reconcile the conflict between human being and natural environment.
1. Introduction
Land use and land cover modification (LUCC) comprise some of the most significant human shifts influencing the surface of the earth (Geist and Lambin, 2001). The assessment of sources of problems, processes and effects of LUCC is one of the major research agendas in environmental conservation studies (Admassu et al., Citation2008). Driven by human activity and natural forces, land-use change (LUC) has culminated in the global depletion of native habitats and ecological processes and resources through diverse environments (Molla, Citation2015; Ellis, 2016; Hailemariam et al., Citation2016; Sanchayeeta et al., Citation2017). Knowing the complexities of land usage (LU) is critical for effective land resource management in developing countries; particularly in Ethiopia, where most people rely on natural resources from the landscape for their livelihoods (Alex, Citation2002; Ellis, 2016; Yadav et al.). Land cover change occurs through conversion and intensification by human intervention, altering the natural balance of ecosystems, generating a response expressed as the system changes (Dale & Fortin, Citation2014; Hailemariam et al., Citation2016). Land-use change strongly affects water resources and local climate change; hence, its consequences affect the whole environmental ecosystem (Elmqvist et al., Citation2003; Hollmann et al., Citation2013). Biodiversity is reduced when the land cover is changed or forest resources coverage is reduced continuously through the unmanaged farming system practiced. Research results on LULCC show that woodlands are alarmingly changed into grassland and farmlands worldwide (Muke, Citation2019; Payes et al., Citation2013; Russell & Ward, Citation2016; Zeleke & Hurni, Citation2001).
National parks are protected areas of land for the protection of endangered plants, wildlife and their ecosystems, as well as sites of ecological beauty, historical heritage and indigenous cultures (Abate & Angassa, Citation2016; Mombeshora & Le Bel, Citation2009). Ethiopia’s protected areas; particularly Omo National Park has been increasingly degraded due to land is being converted to settlement, subsistence and commercial agricultural practices such as sugar cane farm/plantation. The natural resources and its product have been alarmingly degraded by the local community’s influence for different purposes. The protection guarantee is not properly institutionalized and is not supported by local communities. The wildlife habitat of the park is strongly disturbed and some of the wild animals migrate to the neighbour countries national parks and Mago National Park.
The protected area is not only a conservation hotspot because of its high ecological diversity (fauna and flora) but also for its complex dynamic cultural diversity. The majorities of the people are partially or dependent on the exploitation of natural resources which are found in the park. Access to resources is crucial for these communities who continue to have deadly conflicts to gain suitable territories and rights to use and access to natural resources. Therefore, the Omo National Park is a huge and dynamic ecological and ethnical system with communities having their social and economic structure closely linked to natural resource utilization (Owoeye & Popoola, Citation2017; Pierre-Cyril, 2007; Guo, 2018).
In general, due to human interference and natural factors, the entire landscape is distorted and fragmented into different geographical features. In the past several decades, the trend of land-use land cover change is not studied yet since the park is established. Thus, there is no clear information on the trends and pattern of land cover change inside the park and not properly identified the major driving forces on the change of the park’s habitat over time.
Therefore, the main objective of this study was to assess the trend and magnitude of the LULCC from 1988 to 2018, to identify the major driving forces of LULC changes and the consequences associated with these changes. Such a case study will help to identify the root problems and enables the suggestion of alternative management options and strategies for the Omo National Park. The finding of this study could also contribute information for decision-makers, land managers and planners for sustainable development and management of natural resources.
2. Material and methods
2.1. Description of the study area
The Omo National Park is located between 35.380–36.140E longitude and 5.430–6.640 N latitude, with an altitude ranging from 500 to 1,541 m.a.s.l. (). It is found at 870 km southwest of Addis Ababa, and 324 Km far from the regional city of Hawassa. The park is the largest and most biologically rich in Ethiopia, and it was designated in 1966, but it was established in 1968 as a proposed National Park, it covers 4068sqkm (ONP Annual report, Citation2008).
Figure 1. Map of study area.
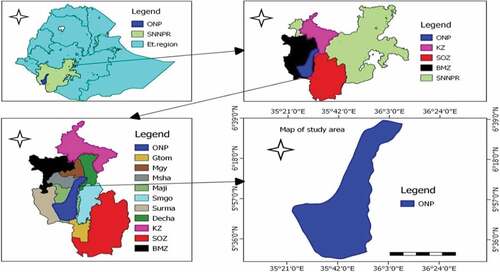
The average annual rainfall is 810 mm and the minimum and maximum temperatures are ranging from 20°C to 40°C, respectively (Pierre-Cyril, 2007; Tadie & Fischer, Citation2013). Savannah grassland, riparian formation and deciduous woodlands are the main vegetation composition. About 325 bird species and 75 mammal species have been recorded in the park. The key land features of ONP also include the Omo River, the Maji Range, Sharum and Sai plains, the Elilibai plains, and the Dirga Hills to the south. The park is surrounded and was used as a home for Surma, Kwegu Nyangatom, and Dizzy (ONP Annual report, 2018).
The area has various geographical features; these include the Omo River, Maji Mountains, Sharum and Sai plains, ELilibai plains and Dirga Hills. Vegetation composition includes savannah, riparian formation and deciduous woodland. The edges of the Omo River are covered by different tree species including Tamarindus indica, Ficus sycamorus and salicifolia, Kigelia aethiopium, Phoenix reclinata, Terminalia brownii, Acacia polyacantha etc. Besides, 325 species of birds and 75 species of mammals have been recorded so far in the park. A well-structured shrub layer combined with woody and herbaceous climbers provides dense cover along the edge of the Omo River (ONP annual report, 2018). Based on the ONP annual report (2018) since 2011, the ONP is the home for various tribes such as Mursi, Surma, Chai, Nyangatom, Dizi, Me’en (Bodi) and Kwegu tribes. But currently, it is home to only Surma, Kwegu Nyangatom, and Dizzy, the rest Mursi tribe was far away from the park due to the expansion of (KSF) kuraz sugar factories (ONP annual report, 2018).
2.2. Methods
2.2.1. Image acquisition & digital processing
The remotely sensed data were collected from satellite images corresponding to two main sensors, Landsat 5 TM (Thematic Mapper), Landsat 8 OLI (Operational Land Imager), which is distributed in four images by different decades 1988, 1998, 2008, and 2018. All the images were collected with no cost from the United States Geological Survey (USGS), archive https://ers.cr.usgs.gov/ (). The acquisition dates of the satellite images slightly differ within and between years, though the acquisition was carried out within January and February (). The main reason why the satellite images are collected from January and February was very important to the research area. Because, this time in our country is, a dry season clear sky (cloud-free) and we can properly discriminate the required information about the vegetation and can distinguish it from other farmland and grassland. Semi-automatic Classification Plugin in QGIS version 3.2 was used for image processing and classification. For LULC classification and analysis all the reflective bands were used, excluding the thermal bands ().
Table 1. Details of satellite images
Figure 2. Flowchart of Omo National Park land use and land cover/change detection.
2.2.2. Image Pre-processing
Both radiometric and geometric correction was properly conducted to reduce some defects and improve the quality of the image (Goslee, Citation2011; Hansen & Loveland, Citation2012; Lyapustin et al., Citation2012; Rani et al., Citation2017; Zhu, Citation2017). The corrections are very useful to make a comparison of information or multiple data over time (Hansen & Loveland, Citation2012; Hilker et al., Citation2012; Mucova et al., Citation2018).
Good opportunities in this study are all images collected from the U.S. Geological Survey (USGS) between 1988 and 2018 were level 2, which means that they were fully corrected (Zhu, Citation2017). By referring to different image processing standards, the research was performed major image processing steps, which are of utmost importance for LULC analyses using Semi-Automatic Classification (QGIS Desktop v.3.2) software.
2.2.3. Field Data Collection
Ground truth points were collected at random locations to confirm observations obtained from satellite images. During fieldwork, pictures were taken in various forms of land cover and spatial coordinates were registered using a handheld GPS reviver (GPS 78). Details on the historical background of the park were gathered from interviews with senior native wildlife scouts who have been involved in the park since its creation and sponsored the collecting of field data. Based on field findings and awareness of residents, the land cover of the Omo National Park has been divided into gender-specific groups, including grassland, woods, wetlands, river forests, built-up and commercial farms and areas dominated by grassland and woodlands ().
Table 2. Identified Land cover Classes delineated on the basis of supervised classification
2.2.4. Image classification
After the preprocessing of remotely sensed data, the next step is image classification. Practically, in this study, supervised classification (maximum likelihood algorism analysis) was employed using the Semi-Automatic Classification tool. This classification technique is a classical and updated, high-resolution multispectral satellite image classification technique that allows detailed analysis of the objects on the surface under study (Dimobe et al., Citation2015; Lu & Weng, Citation2007).
A total of more than 250 samples were selected for each decade. The samples are statistically significant, according to the parameters suggested by Richards and Jia (Citation2006). For the classification process, the maximum likelihood of the algorism was used (Lu & Weng, Citation2007).
2.2.5. Accuracy assessment
To determine its efficiency and measure its accuracy, a classified image or change detection map must be measured against reference evidence, believed to be real (Foody, Citation2002). The accuracy of remotely sensed data was evaluated based on the detailed analyzes of the classified images since 1988, 1998, 2009 and 2018 and finally, the confusion matrix approach was applied. It helps to evaluate the overall accuracy, kappa coefficient, commission errors, omission errors, producer’s and consumer’s accuracy (Congalton & Green, Citation2019; Liu & Yang, Citation2015; Lunetta & Lyon, Citation2004). The method used to approximate the accuracy of the image classification by comparing the classified map with the reference map. Therefore, the maximum accuracy evaluation needs to include the overall accuracy survey; Consumer Accuracy and Producer Accuracy have been examined using the Kappa coefficient. The classification validation was analyzing about 30% of the samples of each class of the LULC maps from 1988, 1998, 2009 and 2018, and supported by 300 ground truth reference data (GCPs) and google earth professional maps to validate the past image data.
2.2.6. LULC change detection analysis
The value of the identification of transition is to decide which class of land use is shifting to the other. The most widely used methods of land change identification include image overlay, land-based classification reference figures, vector change analysis, key component analysis, image rationing and variation in the normalized vegetation difference index (NDVI; Han et al., Citation2009). In this study, the change detection analysis was made using the Semi-Automatic Classification tool on the QGIS software (). Classification comparisons with land cover figures have been used. In the last several years, the areas occupied by each type of land cover have been compared. Maps of the changes that occurred over the last 30 years have been produced comparing the LULC maps of 1988 and 2018. The map overlay method was applied resulting in the final cross matrix results.
2.2.7. Socio-Economic Survey
To have a better understanding of the major driving force of LULCC and the community’s perception and attitudes on the temporal patterns (type and extent) and causes of LULCC in the park, a total of 133 respondents were interviewed as a household using simple random sampling techniques. The samples were taken from farmers (47 households) and 86 are pastoralist’s communities. Semi-structured questionnaires were designed to identify the driver of LULCC and its effect on the local environment. Besides, a total of 3 different focus group discussions (FGDs) were conducted and 25 key informants from different institutions were interviewed to crosscheck and validate data collected through household surveys (Krueger & Richard, Citation1994; USAID, Citation1996). Finally, simple descriptive statistics were used to identify and describe the major driving forces in LULCC of the study area.
3. Results and discussion
3.1. Omo National Park land use and land cover (1988-2018)
The major LULC categories identified are given in . Six major LULC types were identified for this study: namely, grassland, open woodland, forest, and riverine forest, built-up and industrial farmland. As observed in , the pattern of LULCC between 1988 and 2018 is shown different geographical features in the ONP. Accordingly, grassland was covered 245,950.650 ha (57.21%) during the initial period (1988) but, it showed a decreasing pattern by −68,149.305 ha (−27.71%) in the last 30 years. Relatively greater modifications took place from grassland to industrial farmland (). In contrast, woodland coverage showed an increasing pattern and covers 107,541.72 ha (25.02%) during the initial period (1988), but in the final period (2018) the area coverage accounted for 186,360.12 ha (43.35%) and increased by 78,817.545 ha (73.29%).
Table 3. Area and proportion of LULC in Omo National Park in 1988, 1998, 2009, and 2018
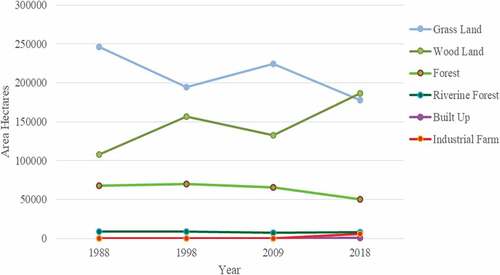
During 1988, forest area was covered 67,616.10 ha (15.73%), however, its coverage was showing a decreasing pattern by −16,955.82 ha (−25.08%) and accounted for 50, 660.28 ha (11.78%) in (2018). Similarly, riverine forest, covered, 8791.29 ha (2.04%) during the initial period (1988) and 30 years later it was reduced by −824.85 ha (−9.38%) and covered 7,966.44 ha (1.85%) on (2018) respectively (). On the other hand, the expansion of industrial farmland (Kuraz Sugar Factory (KSF)) and the built-up area was covered 6218.19 ha (1.45%) and 894.24 ha (0.21%), respectively, at the expense of grassland and forest. In general, the area covered by woodland built up, and the KSF farm showed an increasing pattern across the study area. While, grassland, riverine forest, and forest land cover show a decreasing pattern in between the indicated period ( and , and ).
Figure 3. Land use land cover change of 1988, 1998, 2009, and 2018.
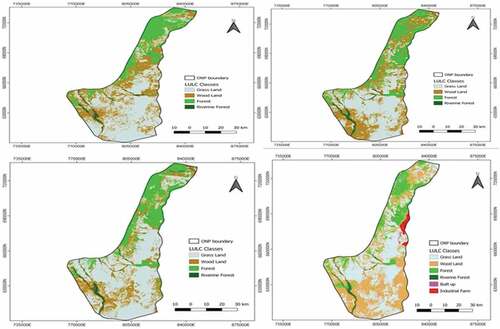
Figure 4. Trends of LULCC in ONP (1988–2018).
3.2. The magnitude of land-use land cover changes in Omo National Park
As illustrated in , grassland was covering a very large amount of areas in the first period, but it was dramatically modified and decreased by −51,171.795 ha with a rate change of −11.9%. While, woodland, forest and riverine forest increased by 48,960.405 ha (11.39%), 2097.99 ha (0. 49%), and 113.4 ha (0.03%), respectively, at the expense of grassland ( and ). This implies that 51,171.795 ha of grassland was converted into other land cover such as woodland, forest, and riverine forest at different rates and extents over the last ten year period ().
Historical information obtained from FGDs and Key informants was confirmed that the rise of overgrazing and human-induced fire between 1988 and 1998 and the expansion of industrial farmland between 2009 and 2018 were played a great role in the reduction of grassland. Similarly, between 1998 and 2009, woodland, forest, and riverine forest coverage were shown a decreasing trend by 5.5%, 1.01%, and 0.42%, respectively, as compared to the previous period (). However, grassland was increased by 6.93% as compared to the first period ( and ).
The main reason why woodland, forest, and riverine forests show a decreasing trend was the expansion of temporary settlements, the establishment of industrial farmland inside the park boundary, deforestation for building/fuelwood consumption, and mining especially, at Kollu kebele. On the other hand, relatively, there was no drought, human-induced fire and a reduction of overgrazing, which might cause the increment of grassland in the study area (1998–2009) ().
Besides, there was a high scarcity of animal forage and water sources that happened during this time the surrounding the park, so human interference was very high during this period. Local communities (FGD members and key informants) also confirmed the above information and identified the lack of awareness among communities, forest fire, and the absence of land use policy/weakness of implementation as additional reasons for the reduction of vegetation coverage.
The results of the third period (2009–2018) shows grassland decreased by −46,789.83 ha/year (−10.88%) and forest coverage reduced by −14,698.44 ha (−3.42%) with a corresponding increase in woodland about 53,489.025 ha (12.44%), riverine forest 886.815 ha (0.21%), built up 894.24 ha (0.21%), and industry farm 6,218.19 ha (1.45%) respectively ().
In this case, almost 100% of the respondents confirmed that there was an expansion of industrial farmland (KSF), infrastructure development, mining process of minerals/digging beach soil for road construction, expansion of temporary settlements, overgrazing, and human-induced forest fire contributed to the decline of grassland and forest coverage. On the other hand, woodland increased because it was abundantly distributed in the steep slope area and there was a reduction in woody vegetation in the park.
The information obtained from FGD and key informants were also confirmed that the major reason for the continual expansion of settlements in the park was to be searching for animal fodder and water sources during dry seasons. But, built up and industrial farms showed an increasing trend of about 894.24 ha with a rate change of 0.21% and 6,218.19 ha with a change rate of 1.45% accordingly.
3.3. Rate of LULCC Change in the Omo National Park
The rate of change of each LULC is the result of the area change per interval period and it was calculated for each land cover class for three decades. Therefore, the rate of each LULC was varied from year to year, grassland between (1988–1998) is equal to −1.19% and that of the woodland was 1.139%. Similarly, the rate of forest coverage change was 0.049%, whereas riverine forest was 0.003% respectively (). In the second interval (1998–2009), the rate change of grassland became 0.63% and that of the woodland was about −0.50% respectively.
Table 4. Magnitude of LULCC in hectare and percentage in Omo national park (1988–2018)
The rate of forest land cover and the riverine forest became −0.09% and −0.04% and in between (2009–2018) the rate of grassland becomes −1.21%, whereas the rate of woodland is equal to 1.38% and forest coverage has become −0.38%. On the other hand, the rate of the riverine forest was 0.008% and that of built-up becomes 0.02%. Similarly, the rate of (KSF) farm becomes 0.16% respectively. In general, within 30 years, the rate of change of woodland, and grassland was recorded a higher rate of change at −68,149.305 ha (−1.77%), woodland, 78,817.545 ha (2.02%), forest coverage was −16,955.82 ha (−0.42%), the riverine forest was −824.85 ha (−0.02%), built-up 894.24 ha (0.02%) and industry farm was 6218.19 ha (1.16%; ).
Table 5. Rate and percentage change of LULCs in Omo National Park
3.4. Land use-land cover conversion matrix
The results of the LULC change matrix analysis are presented in . During the study period between 1988 and 2018 about 255,834.54 ha (59.51%) of the landscape in the ONP was remained unchanged. This implies 174,065.175 ha (40.49%) of the total landscape of the park was converted from one land cover type to others within the 30 years ().
Table 6. LULC Conversion matrix of 1988 to 2018
1Sum of diagonals and represents the overall persistence, 2NC = gain−loss. 3NP = net change/diagonals of each class.
The highest conservation was observed on the grassland, which was converted to woodland about 93,601.845 ha (38.06%) and forest coverage converted to woodland about 21,541.5 ha (31.86%). In contrast, woodland converted to the forest about 21,541.5 ha (19.20%). So, woodland gained about 115,143.345 ha from both land cover types within the 30 years (). The least area conversion was from riverine to industry farm about 3.33 ha respectively. All change matrixes were shown gross gain and loss of each land cover category during the study periods and the diagonal numbers in bold show the unchanged pixels
In this study, woodland experienced the lowest persistence, whereas riverine forest was the most persistent cover type in the last 30 years. The net persistence for forest and grassland was large (relatively far from zero), whereas riverine forest, built-up area, and industrial farmland were closer to zero (). The net persistence value closer to zero shows the higher probability of the LULC forms to maintain rather than decrease or increase.
3.5. Classification accuracy assessment
The accuracy assessment result for ONP shows that, for 1988, overall accuracy was 84.95% with Kappa equal to 75%. For 1998, overall accuracy was 85.93%, Kappa equal to 80%. In 2009, the overall accuracy was 82.70%, Kappa equal to 75%. Finally, in 2018, the overall accuracy was 85.71%, Kappa equal to 80% (). For this accuracy assessment, the results show a slight variation of the accuracy and kappa from 1988 to 2018. However, both metrics were considered statistically significant, above the minimum required for the accuracy assessment.
Table 7. Overall Accuracy and Kappa Coefficient Assessment
3.6. Drivers of land-use/land cover change
3.6.1. Proximity Drivers of LULC changes in Omo National Park
The perceptions of the local community on LULC change are summarized in . Based on the survey result, expansion of settlements, deforestation and mining, expansion of Kuraz Sugar Factory, overgrazing, infrastructure development (road, and canals), human-induced fire is the major identified proximity causes for LULC changes in Omo National Park. LULCC has been widely investigated in different parts of the country (Bewket & Abebe, Citation2013; Biazin & Sterk, Citation2013; Kidane et al., Citation2012; Kindu et al., Citation2013; Mengistu & Waktola, Citation2016). All these studies have shown that the population growth and expansion of agricultural lands is the main driver of LULCC (Hosonuma et al., Citation2012). Similarly, in our case, the majority of the communities who live around the ONP are pastoralists, and most of the population of pastoralists is settled in and around the park especially during the dry season. This results in the reduction of vegetation of coverage and ecosystem disturbance in the Park. This problem can exert more pressure on natural resources degradation such as water, wild animal pasture soil degradation, and loss of biodiversity in the area. As indicated in , 96% of the respondents were reported that the expansion of settlements is one of the direct causes of LULCC in the park. Especially, Gnagatom and Surma pastoralist communities are living and settled in the park during dry seasons. Mostly, Ellil bay grassland, Kite open woodland, Dirga open woodland, and Gella open woodlands are the most suitable areas for pastoralists in the park, especially during the dry season.
Table 8. Proximate driving forces for LULCC in the ONP
The current modification of land by humans to obtain livelihoods and other necessities were drivers for LULCC than that was done in the past and human population growth and poverty are the main factors of change in LULC (Demel, 2000; Mikias, 2014; Mekonnen et al., Citation2018).
Forest products/biomass is the major energy source in the study area and it is the major cause of deforestation and land degradation. Communities accelerate deforestation through harvesting forest products for building (fuelwood consumptions), by engaging fire and extensive overgrazing (Fearnside, Citation2000; Muller, Citation2009; Shalaby & Tateishi, Citation2007). This was confirmed by key informants and FGDs, which were agreed that deforestation and mining are the main driving forces for the natural ecosystem of the park, but this is happening due to the expansion of Kuraz Sugar Factories (KSF) and infrastructures. About 122 (92%) of respondents revealed that deforestation and mining are some of the major factors for LULCC in the study area (). All the respondents, in FGD, and mining process, extensively grazing, conflicts between communities, forest fire are the major drivers of deforestation in the Omo National Park.
As indicated in , 94 (79%) of respondents indicate that the expansion of Kuraz Sugar Factories is another factor for the change of land cover of the park. The factory was clearing the vegetation to plant fabric, sugar cane plantation and staff residential areas that cause disturbance on the ecosystems and reduce the vegetation coverage of the park. Mostly, native species diversity is come into danger and creates a suitable opportunity for exotic species expansion in the ONP along the main road-side. The expansion of infrastructure development (constructing a road, installation of electricity and building residential houses, and constructing canals for irrigation) followed by expansion of KSF is also another problem of the change of park’s land cover ().
Intensive overgrazing in the park is another factor for the change of vegetation coverage in the park. The population density of livestock in the park was extremely greater than the wild animals, especially during dry seasons from December to February; because during this time searching for water and animal forages in the pastoralist area is the big issue. Human-induced fire affects both plants and wild animals’ directly by destroying their habitats. The survey result showed that 11 (8.27%), pastoralist communities are released deliberately fire into the forest grassland area to protect their livestock from other wild animals and to improve grazing land and when conflicts happen between tribes ().
3.6.2. Underlying Causes of LULCC in Omo National Park
Several studies confirmed and this study verified that proximate causes have been caused by various underlying causes of land cover transition. In this study, conflicts between communities and with park administration, absence of well-defined boundary, population growth, and absence/weak land-use policy implementation were identified as indirect causes of LULCC in the study area. As indicated in , 100% of the respondent revealed that conflict between communities’ and with the parks administration is one of the main underlying causes for the change of land cover in the park. Especially, conflicts between Surima and Gnangatom tribes/pastoralists have very disasters; they are setting fire in the forest/grassland to harsh the livestock of their tussle neighbours, thus resulting in the reduction of vegetation and ecosystem disturbance.
Table 9. Underlying driving forces for LULCC in the ONP
Source:- Field survey, 2019
On the other hand, the absence or weak implementation of land use policy gave a chance for illegal people to abuse the park (to settle in the park, to hunt wild animals and setting fire in the park). Lack of appropriate land management planning is indeed the policy catalyst for improvement in the canopy of woodland and grassland. It is characterized by the encroachment of vegetated lands, especially forests and grasslands for settlement and agricultural activities (Alemayehu et al., Citation2019). About 109 (81.95%) of the respondents revealed that weak policy implementation and punishment took on illegal people causes LULCC in the ONP. However, some of the communities (pastoralists) are taken advantage of because they create a good opportunity for temporary settlement and are used as a communal land to settle and overgrazing. There are the main driving factors of deforestation and LULCC in the protected areas, according to the Winter (Citation2000) report, weak and strong land-use policy implementation and hunting of wild animals.
Population growth is also another indirect factor for the change of LULCC in the park. Population growth has contributed to LULCC. For example, the results of a survey carried out by Geist and Lambin (2001) showed that 61% of deforestation were related to human population dynamics. The data obtained from survey 122 (91.73%) show that population growth, especially in the pastoralist area pushes communities to settle in the park, and can cause deforestation and high environmental disturbances on the vegetation coverage (). The pastoralist communities, particularly, Surma, Gnangatom and Dizzy (farmers) around ONP have been increased from time to time. These communities are highly dependent on the park’s resources. There is a continuous migration for searching water and animal forages during the dry season in the park, this results, in forest and wildlife habitat destruction (Mundia and Murayama, 2009).
4. Conclusion
In this study, the land cover change detection of the Omo National Park over the last three decades (30 years) had analyzed. The result of the study showed that significant change detection had been observed during the study period. The results of the present study showed that substantial land cover changes have been modified and converted into another land-use type in the ONP over the last 30 years. This study showed that in the last 30 year period, grassland, forest, and riverine forest had significantly decreased by 41.36%, 3.95% and 0.19%, respectively, in the study area, while woodland increased by 18.33%. This result revealed that the change of grassland, forest and riverine forest to industry, settlement and infrastructural development may cause land degradation, deforestation, ecological imbalance, and soil degradation in the park. These changes continuously alter the spatial patterns of the landscape and greatly modify the entire ecosystem of the park. The major direct causes of land cover change in the area were the expansion of settlement, deforestation and mining, expansion of Kuraz Sugar Factory farm, overgrazing, infrastructure (road and canals), and human-induced fire. Besides, the absence of a well-defined boundary, the conflict between communities, population growth, and the absence of land use policy were also identified as the underlying drivers of LUC in the area. Consequently, the following key management actions should be made to reduce the negative impacts of the LULCC in the Omo National Park. Proper compliance activities affecting local populations should be improved to mitigate the cumulative human stresses on the park. A sustainable protected area management strategy, a strong legal and regulatory framework, and inclusive and community-centered management of natural resources systems should be established at the local, regional and federal levels. Furthermore, to determine the effect of human-induced activities on the park’s environment, further in-depth research activities should be conducted on the spatial-temporal consequences of such human activities in the park. This study can be used to assist the park managers and land-use planners to define key areas that are actually under accelerated development and modification, so that management can be taken to stop or slow down the existing pace of land transition.
Data Availability
The data used to support the findings of this study are available from the corresponding author upon request.
Acknowledgements
The authors are grateful to Ethiopian Wildlife Conservation Authority (EWCA) for the financial support and all the logistics. The authors sincerely thank the ONP management, member’s for their assistance to succeed in this study and for permitting us to carry out this study in the area.
Disclosure statement
No potential conflict of interest was reported by the author(s).
Additional information
Funding
Notes on contributors

Abebe Armaw
Abebe Armaw is working as an expert at department of Technical and Vocational Education and Training, South Omo Zone Jinka Town, Ethiopia. He has MSc degree in Climate change and development at Hawassa University, WGCRNRs in 2019.
Mikias Biazen Molla
Mikias Biazen Molla (PhD) is a lecture and researcher at Hawassa University, WGCRNRs, Ethiopia. He has been lecturing different course related to geo-spatial technology and environmental and /or natural resources related studies. He conducted various researches and community service activities and also advised so many MSc and PhD student’s research projects in his field of study. His current research interests include GIS, Remote Sensing, Environmental planning and Management, Green infrastructure and the environmental performance of Cities, Ecosystem services, Climate change, geo-spatial technologies application in various fields of study.
Mikias Biazen Molla (PhD), he is a cooresponding Author of this Article
References
- Abate, T., & Angassa, A. (2016). Conversion of savanna rangelands to bush dominated the landscape in Borana, Southern Ethiopia. Ecological Processes, 5(1), 6. https://doi.org/10.1186/s13717-016-0049-1
- Admassu, Y.M. (2008). Assessment of livestock feed resources utilization in Alaba Woreda, Southern Ethiopia. Assessment of livestock feed resources utilization in Alaba Woreda, Southern Ethiopia. 127p. Haramaya (Ethiopia): Haramaya University.
- Alemayehu, F., Tolera, M., & Tesfaye, G. (2019). Land use land cover change trend and its drivers in Somodo watershed South Western, Ethiopia. African Journal of Agricultural Research, 14(2), 102–18. https://doi.org/10.5897/AJAR2018.13672
- Alex, D. (2002). Land-use and land-cover change. A CIESIN Thematic Guide Center for International Earth Science Information Network (CIESIN) of. Columbia University Palisades.
- Bewket, W., & Abebe, S. (2013). Land-use and land-cover change and its environmental implications in a tropical highland watershed, Ethiopia. International Journal of Environmental Studies, 70(1), 126–139. https://doi.org/10.1080/00207233.2012.755765
- Biazin, B., & Sterk, G. (2013). Drought vulnerability drives land-use and land cover changes in the Rift Valley drylands of Ethiopia. Agriculture, Ecosystems & Environment, 164, 100–113. https://doi.org/10.1016/j.agee.2012.09.012
- Congalton, R. G., & Green, K. (2019). Assessing the accuracy of remotely sensed data: Principles and practices. CRC press.
- Dale, M. R., & Fortin, M. J. (2014). Spatial analysis: A guide for ecologists. Cambridge University Press.
- Dimobe, K., Ouédraogo, A., Soma, S., Goetze, D., Porembski, S., & Thiombiano, A. (2015). Identification of driving factors of land degradation and deforestation in the Wildlife Reserve of Bontioli (Burkina Faso, West Africa). Global Ecology and Conservation, 4, 559–571. https://doi.org/10.1016/j.gecco.2015.10.006
- Elmqvist, T., Folke, C., Nyström, M., Peterson, G., Bengtsson, J., Walker, B., & Norberg, J. (2003). Response diversity, ecosystem change, and resilience. Frontiers in Ecology and the Environment, 1(9), 488–494. https://doi.org/10.1890/1540-9295(2003)001[0488:RDECAR]2.0.CO;2
- Fearnside, P. M. (2000). Global warming and tropical land-use change: Greenhouse gas emissions from biomass burning, decomposition and soils in forest conversion, shifting cultivation and secondary vegetation. Climatic Change, 46(1–2), 115–158. https://doi.org/10.1023/A:1005569915357
- Foody, G. M. (2002). Status of Land Cover Accuracy Assessclassificationment. Remote Sensing of Environment, 80(1), 185–201. https://doi.org/10.1016/S0034-4257(01)00295-4
- Goslee, S. C. (2011). Analyzing remote sensing data in R: The Landsat package. Journal of Statistical Software, 43(4), 1–25. https://doi.org/10.18637/jss.v043.i04
- Hailemariam, S. N., Soromessa, T., & Teketay, D. (2016). Land use and land cover change in the bale mountain eco-region of Ethiopia from 1985 to 2015. Land, 5(4), 41. https://doi.org/10.3390/land5040041
- Han, J., Hayashi, Y., Cao, X., & Imura, H. (2009). Evaluating land-use change in rapidly urbanizing China: Case study of Shanghai. Journal of Urban Planning and Development, 135(4), 166–171. https://doi.org/10.1061/(ASCE)0733-9488(2009)135:4(166)
- Hansen, M. C., & Loveland, T. R. (2012). A review of large area monitoring of land cover change using Landsat data. Remote Sensing of Environment, 122, 66–74. https://doi.org/10.1016/j.rse.2011.08.024
- Hilker, T., Lyapustin, A. I., Tucker, C. J., Sellers, P. J., Hall, F. G., & Wang, Y. (2012). Remote sensing of tropical ecosystems: Atmospheric correction and cloud masking matter. Remote Sensing of Environment, 127, 370–384. https://doi.org/10.1016/j.rse.2012.08.035
- Hollmann, R., Merchant, C. J., Saunders, R., Downy, C., Buchwitz, M., Cazenave, A., … Holzer-Popp, T. (2013). The ESA climate change initiative: Satellite data records for essential climate variables. Bulletin of the American Meteorological Society, 94(10), 1541–1552. https://doi.org/10.1175/BAMS-D-11-00254.1
- Hosonuma, N., Herold, M., De Sy, V., De Fries, R. S., Brockhaus, M., Verchot, L., … Romijn, E. (2012). An assessment of deforestation and forest degradation drivers in developing countries. Environmental Research Letters, 7(4), 044009. https://doi.org/10.1088/1748-9326/7/4/044009
- Kidane, Y., Stahlmann, R., & Beierkuhnlein, C. (2012). Vegetation dynamics, and land use and land cover change in the Bale Mountains, Ethiopia. Environmental Monitoring and Assessment, 184(12), 7473–7489. https://doi.org/10.1007/s10661-011–2514-8
- Kindu, M., Schneider, T., Teketay, D., & Knoke, T. (2013). Land use/land cover change analysis using object-based classification approach in Munessa-Shashemene landscape of the Ethiopian highlands. Remote Sensing, 5(5), 2411–2435. https://doi.org/10.3390/rs5052411
- Krueger, K., & Richard, R. (1994). Focus groups: A practical guide for applied research (2nd edn, 3–175). Sage publications, Newbury Park.
- Liu, T., & Yang, X. (2015). Monitoring land changes in an urban area using satellite imagery, GIS and landscape metrics. Appl. Geogr, 56, 42–54. https://doi.org/10.1016/j.apgeog.2014.10.002
- Lu, D., & Weng, Q. (2007). A survey of image classification methods and techniques for improving classification performance. Int. J. Rem. Sens, 28(5), 823–870. https://doi.org/10.1080/01431160600746456
- Lunetta, R. S., & Lyon, J. G. (Eds.). (2004). Remote sensing and GIS accuracy assessment. CRC press.
- Lyapustin, A. I., Wang, Y., Laszlo, I., Hilker, T., Hall, F. G., Sellers, P. J., Tucker, C. J., & Korkin, S. V. (2012). Multi-angle implementation of atmospheric correction for MODIS (MAIAC): 3. Atmospheric Correction. Remote Sensing of Environment, 127, 385–393. https://doi.org/10.1016/j.rse.2012.09.002
- Mekonnen, Z., Berie, H. T., Woldeamanuel, T., Asfaw, Z., & Kassa, H. (2018). Land use and land cover changes and the link to land degradation in Arsi Negele district, Central Rift Valley, Ethiopia. Remote Sensing Applications: Society and Environment, 12, 1–9. https://doi.org/10.1016/j.rsase.2018.07.012
- Mengistu, D. A., & Waktola, D. K. (2016). Monitoring land use/land cover change impacts on soils in data-scarce environments: A case of south-central Ethiopia. Journal of Land Use Science, 11(1), 96–112. https://doi.org/10.1080/1747423X.2014.927011
- Molla, M. B. (2015). Land use/land cover dynamics in the central rift valley region of Ethiopia: Case of Arsi Negele District. African Journal of Agricultural Research, 10(5), 434–449. https://doi.org/10.5897/AJAR2014.8728
- Mombeshora, S., & Le Bel, S. (2009). Parks-people conflicts: The case of Gonarezhou National Park and the Chitsa community in south-east Zimbabwe. Biodiversity and Conservation, 18(10), 2601–2623. https://doi.org/10.1007/s10531-009-9676-5
- Mucova, S. A. R., Leal Filho, W., Azeiteiro, U. M., & Pereira, M. J. (2018). Assessment of land use and land cover changes from 1979 to 2017 and biodiversity & land management approach in Quirimbas National Park, Northern Mozambique, Africa. Global Ecology and Conservation, 16, e00447. https://doi.org/10.1016/j.gecco.2018.e00447
- Muke, M. (2019). Reported driving factors of land-use/cover changes and its mounting consequences in Ethiopia: A Review. African Journal of Environmental Science and Technology, 13(7), 273–280. https://doi.org/10.5897/AJEST2019.2680
- Muller, A. (2009). Sustainable agriculture and the production of biomass for energy use. Climatic Change, 94(3–4), 319–331. https://doi.org/10.1007/s10584-008-9501-2
- Omo National Park. (2008). Annual report on the status and existing situation of Omo National Park (unpublished material).
- Owoeye, J. O., & Popoola, O. O. (2017). Predicting urban sprawl and land-use changes in Akure region using Markov chains modelling. Journal of Geography and Regional Planning, 10(7), 197–207. https://doi.org/10.5897/JGRP2016.0578
- Payes, A. C. L. M., Pavao, T., & Santos, R. F. (2013). The conservation success over time: Evaluating the land use and cover change in a protected area under a long re-categorization process. Land Use Pol, 30(1), 177e185. https://doi.org/10.1016/j.landusepol.2012.03.004
- Rani, N., Mandla, V. R., & Singh, T. (2017). Evaluation of atmospheric corrections on hyperspectral data with special reference to mineral mapping. Geoscience Frontiers, 8(4), 797–808. https://doi.org/10.1016/j.gsf.2016.06.004
- Richards, J. A., & Jia, X. (2006). Interpretation of hyperspectral image data. Remote Sensing Digital Image Analysis: An Introduction, 359–388. https://link.springer.com/content/pdf/10.1007/3-540-29711-1_13.pdf
- Russell, J. M., & Ward, D. (2016). Historical land‐use and vegetation change in Northern Kwazulu‐Natal, South Africa. Land Degradation & Development, 27(7), 1691–1699. https://doi.org/10.1002/ldr.2476
- Sanchayeeta, A., Fik, T., & Dwivedi, P. (2017). Proximate causes of land-use and land-cover change in Bannerghatta National Park: A spatial statistical model. Forests, 8(9), 342. https://doi.org/10.3390/f8090342
- Shalaby, A., & Tateishi, R. (2007). Remote sensing and GIS for mapping and monitoring land cover and land-use changes in the Northwestern coastal zone of Egypt. Applied Geography, 27(1), 28–41. https://doi.org/10.1016/j.apgeog.2006.09.004
- Tadie, D., & Fischer, A. (2013). Hunting, social structure and human-nature relationships in lower Omo, Ethiopia: People and wildlife at a crossroads. Human Ecology, 41(3), 447–457. https://doi.org/10.1007/s10745-012-9561-9
- USAID. (1996). Conducting key informant’s interviews. Center for Development Information and Evaluation, 1–4. https://pdf.usaid.gov/pdf_docs/PNABS541.pdf
- Winter, M. (2000). Strong policy or weak policy? The environmental impact of the 1992 reforms to the CAP arable regime in Great Britain. Journal of Rural Studies, 16(1), 47–59. https://doi.org/10.1016/S0743-0167(99)00018-2
- Zeleke, G., & Hurni, H. (2001). Implications of Land use and Land cover Dynamics for Mountain Resource Degradation in the North-Western Ethiopian Highlands. Mountain Research and Development, 21(2), 184–193. https://doi.org/10.1659/0276-4741(2001)021[0184:IOLUAL]2.0.CO;2
- Zhu, Z. (2017). Change detection using Landsat time series: A review of frequencies, preprocessing, algorithms, and applications. ISPRS Journal of Photogrammetry and Remote Sensing, 130, 370–384. https://doi.org/10.1016/j.isprsjprs.2017.06.013