
 ?Mathematical formulae have been encoded as MathML and are displayed in this HTML version using MathJax in order to improve their display. Uncheck the box to turn MathJax off. This feature requires Javascript. Click on a formula to zoom.
Abstract
The paper analyzes the determinants of vegetable market participation in Ethiopia. The study procures data from primary and secondary databases. The primary data for this study are collected from vegetable producers through appropriate statistical procedures. Heckman two stages Econometrics model was applied to analyze the collected data. Among factors affecting farmers market participation decision, the first stage Heackman results disclose that district, family size, irrigation access, credit use, extension contact and lagged price are major factors that determine market participation decision of farmers. The second stage Heackman results indicates that sex, family size, irrigation access, land, credit use, extension service and inverse mill’s ratio were the key factors significantly determining how much would be sold into the market. Therefore, policy aiming at increasing farmers’ access to modern irrigation, gender consideration, credit access and improving extension service are recommended to accelerate the vegetable sector development.
PUBLIC INTEREST STATEMENT
The vegetable and root crop sector has been important for the employment opportunity, nutrition and food security. Ethiopia had a long year experience in vegetable and root crop marketing due to the existence of favorable enabling environment. However, the marketing of vegetables was affected by money factor. So, this research identified factors responsible for vegetable market participation decision and volume of supply in Ethiopia.
1. Background
Efficient marketing system plays an important role in stimulating production and accelerating the pace of economic development. It increases the income of farmers by reducing the number of middle men who hide market information or restricting the commission on marketing services. The establishments of an efficient marketing system would enhance farmers’ prices for their farm products and enable them to invest their surplus in purchasing modern inputs. This may lead to an increase of production and productivity and it contributes to an increase in the marketable surplus by cutting down losses in the process of storage, transportation, and processing. Inefficient marketing system and poor market infrastructure hinder factor for proper function of the marketing.
Figure 1. The conceptual framework used for the research. Source: own conceptualization.
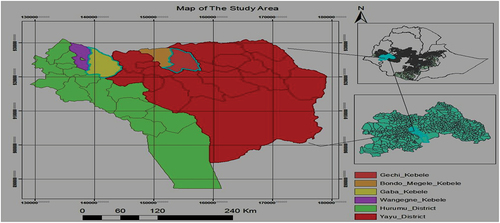
Figure 2. Geographical location of the study areas.
Horticultural sector plays a significant role in Ethiopia, it increases the income and nutrition condition of people. Moreover, it provides employment opportunities as their management being labour intensive, and Ethiopia is a labour abundant and capital scarce country. The horticultural products demand grows very rapidly with urbanization and increased income. Ethiopia earns around (US$ 318 million) from fruit and vegetables exports in 2019 (New Business Ethiopia [NBE], 2019).
Vegetables are considered as sources of minerals, vitamin and income for those engaged in the sector. Its production gives an opportunity for intensive production and increases male and female farmer’s participation in the market (Emana & Gebremedihin, Citation2007). In Ethiopia, the area under these crops (vegetables and root vegetables) was estimated to be 486,921.58 hectares with a total production of 55, 310,251.41Qt. In the year 2019/20 vegetables took up about 1.64 % of the area under all crops at national level (Central Statistical Agency(CSA), Citation2020).
In Oromia region in 2019/20 production year 4,276,864 small holder root crop and vegetable producers were engaged in production and 20,893,791.59Qt of vegetables were produced (Central Statistical Agency(CSA), Citation2020). Illuababora zone is conducive for vegetable production and different vegetables are grown with different production level depending on environmental condition and level of marketability. Accordingly, in 2019/20 production year, 19,3420 smallholder farmers were engaged in vegetable and root crop production and 1,069,692.39Qt of vegetables and root crops were produced in Illuababora zones (Central Statistical Agency(CSA), Citation2020).
In Illuababora zone the life of many smallholder producers is dependent on the cash income from commerce of agricultural products like coffee, cereals and other agricultural product. In addition, vegetable and root crop production have significant contribution in supporting household income and used as source of food in both districts. Vegetable and root crop marketing is constrained by a number of factors: perishability, seasonality and bulkiness nature, high post-harvest losses, high incidence of diseases and insect pests, poor marketing and weak linkage and integration among stakeholders.
There are many studies conducted in marketing of horticultural products which employed different approaches to study marketing of those products. However, to suggest proper intervention and to solve those problems deep analysis of vegetable marketing is needed to make the marketing environment more competitive, fair price for suppliers and as consumers pay reasonable price. An understanding of vegetable marketing plays an important role for any development plan for commercial vegetable growing society. In Illuababora zone limited studies have focused on vegetable marketing and there is limited empirical evidence to inform agricultural practitioners’ on vegetable marketing. This information provides insights on where to focus to maximize profit and improve benefits for all actors. Therefore, this study was initiated to analyze determinants of participation and extent of participation of farmers in vegetables marketing.
2. Related works
Market participation by small holder farmers plays a crucial role particularly in rural development and economic development as a whole. It creates job opportunity for different classes in the form of sorting, grading, packing and transportation among other activities there by increase farmer’s income. It initiates the farmers who engaged in different agricultural activities to move from subsistence farming system to commercial farming (Ngqangweni, Citation2000; Makhura, Citation2001).
Market participation is very vital for sustaining economic development and growth, to insure food security and poverty alleviation. It has a great contribution to rural infrastructural development and industrialization. Farmers who participated in the market tend to be food secure and economically strong. Farmers diversify their products and take their surplus to nearby markets removing trade barriers and discouraging local monopoly (Asfaw & N.d, Citation2010; Jari & Fraser, Citation2009; Shiferaw & Teklewold, Citation2007).
Decision of farmers to participate or not to the market is affected by different factors, including socio-economic factors, institutional factors, market factors and external factors. The above listed factors could have negative and positive effects on welfare of the agents. Georey et al. (Citation2014) identifies the factors that influencing market participation decision among small-scale pineapple farmers in Kericho County, Kenya, the authors reported that that age, sex, education status and quantity produced were important factors that determine decision to participate in the market. Sex, price information, group marketing, marketing experience, vehicle ownership and marketing under contract significantly influenced quantity of sold.
Christopher et al. (Citation2014) reported on smallholder farmer’s decision and level of participation in the potato market in Uganda. The results indicated that proximity to a village market positively and significantly influenced decision to participate in the potato market and non-farm income earned negatively and significantly affected the potato farmer’s level of market participation.
Jaleta et al. (Citation2009) found that household crop market participation was determined by literacy of the head of household, distance of the market place and household’s market orientation, which is making of production decisions based on market signals.
Ngaruko (Citation2015) reported on the determinants of tomato market participation and extent of participation in Tanzania. The author gives emphasis on the factors like extension services especially in the aspect of market information to farmers in order to enlighten them on the recommended production techniques, market price and on modern agronomic practice and the government should intervene on these factors to increase tomato production.
The results of Olwande and Mathenge (Citation2012) shows that group membership, extension contact and marketing infrastructure have an influence on market participation decision.
Lefebo et al. (Citation2016) reported on factors affecting market participation decision and extent of participation of bulla in Ethiopia. The results showed that age, sex, access to market information, availability of labor, perception of bulla price, extension visit and quantity of bulla output had significantly influenced on market participation decision and extent of marketed surplus.
Habtamu (Citation2014) reported on potato market participation decision, and level of market participation in Hadiya zone of Ethiopia. The result shows that, age, education, ownership of oxen and distance to the nearest market were the key factors that determine the decision of farmers and sex, total annual potato harvested, extension service, credit access, district, ownership of livestock, and ownership of oxen were the key factors significantly determining how much would be sold into the market.
Agete (Citation2014) conducted study on factors affecting market participation decision of red bean and extent of market participation decision in Halaba special district, Ethiopia. The author pointed out that price of output, ownership of transportation means, number of extension contact, quantity produced, awareness about quality standards; market information, number of family, access to credit, and gender determine decision of market participation.
Aman et al. (Citation2013), in their study of determinants of commercialization of smallholder horticultural crops in Gemechis district, Ethiopia, indicate that gender, distance to the nearest market and cultivated land played a significant role in smallholder commercialization decision. Whereas, education status, household size, access to irrigation, area of land under cultivation, livestock and distance to the nearest market were the key determinants of the level of commercialization.
A. Abay (Citation2007) reported on determinants of vegetable market supply. The author reported that number of family, distance from main road, number of oxen owned, extension service and perception of lagged price are among factors responsible for market participation decision.
2.1. Conceptual frame work
Market participation is both a cause and a consequence of economic development and it forms commercialized society. It creates linkage between the input supplier and output side producer. Producers with low market participation have low agricultural productivity and they are the poorest and food insecure. Market participation increases production and productivity by providing price information and cash to purchase inputs. Higher production and productivity could drive market participation because farmers with high productivity have surplus to participate in the market, ceteris paribus. Market helps producers to specialize based on their comparative advantage and thus producers enjoy welfare gain from trade () this study conducted on ().
3. Methodology of the study
3.1. Description of study areas
Illubabor Zone: is one of zone in Oromia regional state and located in south-west Ethiopia. The altitude varies from 1500–2000 m a.s.l, with an average annual rainfall of approximately 2000 mm. The annual average temperature in the zone varies between 16°c and 24°c and the climax vegetation is tropical mountain rainforest. Total population of Illubabor zone was estimated about 847,048 and an average population density of 58 km2. About 40% of the area of the zone is covered by forest while agriculture, which is dominated by maize cultivation, accounts for 20% of the area. Coffee is the major cash crop, which grows wild in the forest but is increasingly cultivated in domesticated stands Citation(Illuababora Zone Report [IZR], 2020).
Yayu and Hurumu districts were two districts in the Illuababora zone of Oromia region which this study conducted on. Yayu forest is recently registered by the government of Ethiopia as United Nations Educational, Scientific and Cultural Organization (UNESCO) biosphere reserve sites for biodiversity conservation including wild coffee gene pools. These districts receive sufficient rainfall to support vegetables adapted to the respective climatic conditions. Yayu district has sufficient rainfall distribution pattern with alternative wet and dry seasons with the major rain falling between March and November while being dry throughout the rest of the months. As a result, crop production by irrigation is not required between March and November because of sufficient amount of rainfall for crop production and the production process is done by fully irrigation.
The agro-climatic zone of the district is humid “Weynadega” (mid land) and humid “kola” (low land) and altitude ranges from 1160–2200 m.a.s.l. The annual precipitation of the area ranges from 1191–1960 mm and the average maximum and minimum daily temperatures are 29°C and 18°C, respectively in general, the Yayu district has mono modal rainfall distribution pattern (Abera, 2013).
The total population for Yayu district is about 64,475, of total population 32,490 were men and 31,985 were women. Coffee is an important cash crop in Yayu; over 50 square kilometers are planted with this crop. The largest share of the proposed Yayu Biosphere Reservation, a project of the Ethiopian Coffee Forest Forum, lies in this district. The major crops produced in the district include maize, teff, vegetables (lettuce, cabbage, kale, tomato, green peppers, red peppers, Swiss chard and Root vegetables include beetroots, onion, carrot, potatoes, yam/boye, garlic and sweet potato), khat and coffee.
Hurumu District: was part of Yayu district the major town is Hurumu. Total population for Hurumu district is about 51,717 in which the number of male and female population is 25,752 and 25,965, respectively. Similarly, the major crops produced in the district include maize, teff, vegetables (lettuce, head cabbage, kale, tomato, green peppers, red peppers, Swiss chard and root vegetables include beetroots, onion, carrot, potatoes, yam/boye, garlic and sweet potato), khat and coffee.
3.2. Sampling procedure and sample size determination
To develop sampling frame for this study three stage random sampling procedure were used. In the first stage districts were selected based on vegetable production potential. In the second stage by consulting with district experts and development agents four kebele from the two districts were selected purposely based on production potential and marketing experience of vegetables. In the third stage to select vegetable producer of selected rural kebeles, sample farmers were selected randomly based on proportional to the population size from the selected kebeles (Table ). To identify the respondent random lottery method was applied on fresh list of vegetable growers. Accordingly, 117 respondents were selected by using Yamane (Citation1967) formula.
Table 1. Sampling frame
n = sample size
N = total number of vegetable producer of selected kebeles
e = 9% level of precision
3.3. Types, sources and methods of data collection
For this study data was collected on different variables, demographic, socioeconomic and institutional characteristics. Survey was made to obtain this information. The study was requiring both qualitative and quantitative data and used information from different sources of primary and secondary databases. Primary data were collected by using surveys. The survey was undertaken through formal interviews with sample farmers and collected using structured questionnaire through Key Informant Interview and Focus Group Discussions. The secondary data sources were documents of published/unpublished reports, websites and articles.
3.4. Data analysis
SPSS version 20 was used for data entry and for descriptive analysis and for econometrics model analysis STATA version 13 computer programs were used to process the data. Two types of analysis, namely descriptive statistics and econometric model, were used for analyzing the collected data.
3.4.1. Descriptive statistics
This method of data analysis refers to the use of percentages, frequencies, means, standard deviations, t-test and χ2-test were used to describe and examine the socio-economic characteristics of small-scale vegetable farmers, institutional and market characteristics of vegetable marketing.
3.4.2. Econometric analysis
3.4.2.1. Econometric approaches to modeling market participation
Models used in analyzing the determinants of participation of smallholder farmers in the output market were reviewed as follows:
3.4.2.2. Tobit model
Is a statistical model proposed by James Tobin to describe the relationship between non-negative dependent variable and independent variable (Tobin, Citation1958). The modeling approach assumes that the participation and intensity of sales are made simultaneously and hence factors that affect the participation decision and the intensity of sales decision are the same. The limitation is that it assumes the same set of variables determine both the probability of market participation and the extent of participation. Additionally, the partial effects of a particular variable, on the probability that the farmer will participate and the expected value of the quantity traded conditional on participation, have the same signs (Wooldridge, Citation2005).
Double hurdle model was first introduced as a class of models by Cragg (Citation1971) as a more modified alternative to Tobit model. The approach assumes a two-step decision process. The modeling approaches are based on the assumption that household makes two separate decisions; the first step involves the participate decision in the market and secondly, the level of participation. The model in the first stage estimation involves a probit regression to identify factors affecting the decision to participate in market, and a truncated regression model to analyze the extent of participation, in the second stage. The model has no restrictions regarding the elements of explanatory variable in each decision stage.
Different authors used this model, Reyes et al. (Citation2012) used double hurdle model to identify market participation and quantity of potatoes sold by smallholder farmers in the central highlands of Angola. Aman et al. (Citation2013) used double hurdle model for the determinants of smallholder commercialization of horticultural crops in Gemechis district, Ethiopia. The limitation of the model is it does not capture sample selection bias when the error of the selection and outcome equation are dependent or correlated i.e. in the case of incidental selection, some part of the dependent variable is not observed because of the outcome of another variable.
Heckman two-stage model was developed by Heckman (Citation1979) and has been used extensively to correct for bias arising from sample selection. The Heckman procedure provides consistent and asymptotically efficient estimates for all the parameters (Heckman, Citation1979; Maddala, Citation1983; Amemiya, Citation1985). This model assumes that the missing value of dependent variable implies that the dependent variable is unobserved (not selected). Heckman model first uses a probit regression with all variable data to estimate the probability of market participation. Then the inverse Mills ratio is computed from the probit regression, and is used as a regressor with other explanatory variables to help explain the outcome dependent variable. In addition, different authors used this model (Siziba et al., Citation2011; Georey et al., Citation2014).
In this study Heckman two-stage model for econometric analysis of the participation decision of vegetables and marketed surplus of vegetables was used to hold the problem of selectivity bias.
In order to identify determinants of vegetable market participation decision and extent of participation Heckman two-stage selection model was used. In selectivity models, the decision to participate has been seen as a sequential two-stage decision-making process. In the first stage vegetable farmers make a dual decision whether to participate or not in vegetable market. In the second stage, farmers make continuous decision on marketed surplus.
In the first stage a selection equation is estimated using a probit model which attempts to capture the factors that determine the likelihood of an individual household participate or does not in vegetable market. Since the probit parameter estimate does not show by how much a particular variable increases or decreases the likelihood of participating in vegetable market. Marginal effects of the independent variables on the probability of participating in vegetable market were considered (Habtamu, Citation2014).
Conditional on participation decision, the variables determining marketed surplus were modeled using the second-stage Heckman selection model (Heckman, Citation1979). One problem with the two equations is that the two-stage decision-making processes are not separable due to unmeasured farmer variables determining both the discrete and continuous decision thereby leading to the correlation between the errors of the equations. If the two errors are correlated, the estimated parameter values on the variables determining the marketed surplus is biased (Woodridge, 2002).
According to Greene (Citation2003) the missing observations would cause what is referred to as incidental truncation. Thus, it needs to specify a model that corrects for selectivity bias while estimating the determinants of marketed surplus. For this purpose, in the first step, inverse Mills ratio is created using predicted probability values obtained from the first-stage probit regression of the participation decision. Then, in the second step, include the inverse Mills ratio as one of the independent variables in marketed surplus regression. The inverse Mill’s ratio is a variable for controlling bias due to sample selection. Moreover, with the inclusion of extra term, the coefficient in the second stage selectivity corrected equation is unbiased (Heckman, Citation1979). Specification of the Heckman two-step equation procedure, which is written in terms of the household market participation decision and for marketed surplus, is defined as follow using the probit and OLS models.
i) Probit Model Specification (Selection Equation)
Where,
Is a latent (unobservable) variable representing farmer’s dual decision whether to participate in vegetables market or not.
= is a vector of independent variables hypothesized to affect farmer’s decision to participate in vegetables market,
Is a vector of parameters to be estimated which measures the effects of explanatory variables on the farmers decision
= is normally distributed disturbance with mean (0) and constant variance and captures all unmeasured variables
Y = is a dependent variable which takes the value of 1 if the farmers participate in vegetable market and 0 otherwise.
3.4.3. Estimation of factors affecting extent of market participation
ii) The OLS Model Specification (Outcome Equation)
In the second stage of the Heckman model, OLS are estimated to test the effect/outcome of hypothesized factors on the extent of participation measured by the amount of vegetable sales in the market. The model is stated as:
Where; is the volume of vegetable sold
Vector of the explanatory variables determining the volume sold
= explanatory variable to be estimated in the volume sold
= an inverse Mill’s Ratio
= a parameter that shows the impact of participation on the quantity traded
= the error term
The Inverse Mills Ratio: The inverse Mills ratio, or hazard function, which is commonly denoted as λ. Heckman’s sample selection model uses the inverse Mills ratio to estimate the outcome regression. It was included as additional explanatory variable in the linear regression estimation equation of the extent of participation. It is non-selection hazard included data set for further analysis. This ratio test is a comparison of the joint likelihood of an independent probit model on the observed data against the treatment effect model likelihood. An ordinary least squares regression with and the inverse Mills ratio included as regressors. The estimator is consistent when the assumptions are met (Shawn et al., Citation2007). Mills ratio is created using predicted probability values obtained from the first—stage probit regression of the participation decisions. Then, in the second step, the Mills ratio was included as one of the independent variable in the extent of participation regression.
3.4.4. Test for multicollinearity, heteroscedasticity problems
It is important to check variables used in both stages for multicollinearity and, heteroscedasticity problems before running the model. Multicollinearity problem arises due to a linear relationship among explanatory variables; and becomes difficult to identify the separate effect of independent variables on the dependent variable because of existence of strong relationship among them (Gujarati, Citation2004). Variance inflation factors (VIF) technique was employed to detect multicollinearity in explanatory variable. According to Gujarati (2003), Can be defined as:
Where, are the multiple correlation coefficients between
and other explanatory variables. If the value of variance inflation factor (VIF) is 10 and above the variables are collinear. Contingency coefficient (CC) is used to detect the degree of association among discrete explanatory variables (Healy, Citation1984). It measures the relationship between the raw and column variables of a cross-tabulation. The value ranges between 0–1, with 0 indicating no association between the raw and column variables and value close to 1 indicating a high degree of association between variables. The decision criterion, if the contingency coefficient value is (CC >0.75) the discrete variables are said to be collinear. If there is Heteroscedasticity problem in the data set, the parameter estimates of the coefficients of the independent variables cannot be BLUE. Breusch-Pagan test of heteroscedasticity was employed for detecting heteroscedasticity in the study.
3.5. Hypothesis, variable selection and definition
In this section, definitions of dependent variables and independent variables are presented with the related hypotheses. The study had two dependent variables, market participation and extent of participation; analyzed by Heckman two-stage model.
3.5.1. Market participation decision and extent of market participation
3.5.1.1. Market participation decision
A dummy variable takes a value 1 if a household participates in vegetable marketing and 0 otherwise.
3.5.1.2. Extent of market participation
It is continuous variable, which was measured by the quantity of vegetable sell in quintals. It shows the volume of vegetable sell annually in the market by a smallholder farmer.
3.5.2. Independent variables
3.5.2.1. Age of household head (AGE)
): It is a continuous variable and measured in years. Ayelech (Citation2011) found that as an individual stay long, he have better knowledge and was decide to allocate more size of land, produce more and supply more. On the other hand Adugna (Citation2009) found that age of the household head has negative effect on the elasticity of onion supply to the market. So, it was expected to have either positive or negative effect on market participation and extent of participation.
3.5.2.2. Sex of the household head (SEX)
: A dummy variable taking 0 if female and 1 if male. Male households have been observed to have a better tendency than female household in fruit production and supply of fruit due to obstacles such as lack of capital, and access to credit and extension services (Ayelech, Citation2011). Male households are participated in the pineapple market more than females and females are disadvantaged in marketing because of unequal distribution of resources as well as cultural barriers (Samboko, Citation2011). It was expected to have positive effect on market participation and extent of participation.
3.5.2.3. Education (EDU)
): It is continuous variable and measured in years of schooling. Tegegn (2013) education broadens farmers’ intelligence and enables them to perform the farming activities intelligently, accurately and efficiently. Moreover, better educated farmers tend to be more innovative and are therefore more likely to adopt the marketing systems (Habtamu, Citation2014). So, it was hypothesized to affect positively both market participation and extent of participation of the farmer.
3.5.2.4. Family sizelman equivalent)
: it is continuous variable and measured in man equivalent. Vegetable production and marketing is labor-intensive activity, since vegetable is bulky product in nature. Hence, families with more household labour tend to have more labor which in turn increases market entry (Almaz et al., Citation2014). So, it was hypothesized to affect positively both market participation and extent of participation of the farmer.
3.5.2.5. Distance from the nearest market (DMKT)
: It is continuous variables and the distance of the vegetables producer households from the nearest market and it is measured in walking hour of time. The closer the market, the lesser would be the transportation charges, reduced walking time, and reduced other marketing costs, better access to market information and facilities and vice versa (Tegegn 2013). The results of Christopher et al. (Citation2014) revealed that distance to the nearest town had a positive and significant effect on potato farmer’s decision to participate in the market. This is because the nearer the farmer is to town the easier it is to access buyers who offer better payment terms than in the case of farmers far away from towns (Habtamu, Citation2014). Therefore, it was hypothesized to affect participation and extent of participation positively.
3.5.2.6. Size of irrigation land used (TIRRIG)
: It is a continuous variable measured in hectare. Irrigation system fills the gap occurred due to water shortage enhance vegetable production and there by marketing (Tadesse, Citation2011). So, it was expected to affect market participation and extent of participation positively.
3.5.2.7. Access to extension service (AEXT)
: A dummy variable taking a value of 1 if vegetables producer household has access to extension service and 0 otherwise and representing extension services as a source of information on technology. It is expected that extension service widens the household’s knowledge with regard to the use of improved and new technologies and has positive impact on vegetable sale volume. Therefore, this variable is hypothesized to influence farmer’s income. Tegegn (2013) found that if vegetable producer gets extension service, the amount of vegetables supplied to the market increases. Similarly, Aysheshm (Citation2007) found that extension service had positive effect from his study for market participation through, its stimulation of production and productivity. Since, farmers that have contact with DAs will have better access to information and could adopt better technology that would increase their marketable supply. Hence, it was hypothesized to affect participation and extent of participation in vegetable market positively.
3.5.2.8. Land allocated for vegetable production (TLA)
: It refers to the current vegetable farm plots allocated for cultivation. It is continuous variable, which is measured in hectare. If households allocated more land for vegetable cultivation, then they produced and supplied more to market. Therefore, land size was directly related to production, which in turn to marketed surplus. Asset endowments have higher probability of market participation as a seller and higher sale volume (Barrett, Citation2007; Aman et al., Citation2013). Thus, it is expected that cultivated land under vegetable production have a positive influence on participation decision and volume of sold.
3.5.2.9. Livestock (TLU)
: It is a continuous variable measured in terms of TLU. As the number of animals increase, the probability of market participation is expected to decrease since the alternative income as well as food could be found from animals (Habtamu, Citation2014). Farmers who have a number of livestock were specializing in livestock production so, that they allocated large share of their land for pasture (Tegegn 2013). So, it was expected to affect market participation and extent of participation negatively.
3.5.2.10. Credit access (CREDIT)
: It is a dummy variable taking the value 1 if the farmer used loan and 0 otherwise. Muhammed (Citation2011) also found that if pepper producer gets credit, the amount of pepper supplied to the market increased. Therefore, it was hypothesized to affect participation and extent of participation positively.
3.5.2.11. Income from None and Off Farming Activities (NOFI)
: It is a continuous variable measured in ETB. This variable was assumed to measure the amount of non/off farm income ETB that the sample household had earned per year at the survey time. Some farmers were engaged in non/off-farm activities such as working as daily laborers (selling of labor to the fellow farmers), petty trading, handicraft, etc., which helped them earn additional income. This additional income would increase farmers‟ financial capacity and was expected to increase the probability of investing in vegetable production (Tadesse, Citation2011). This income may strengthen farming activity on one side and may weaken it on the other side. Mussema (Citation2006) found that if pepper producer has non-farm income, the amount of pepper supplied to the market decreases. Therefore, it was hypothesized that it affects participation and extent of participation either positively or negatively.
3.5.2.12. District (DIST)
: It is a dummy variable that takes a value 1 if Yayu and 0 if Hurumu. Similarly, Tegegn (2013) took districts (Kombolcha and Habro) as a dummy variable, and he found that districts had to affect regarding in access to information, access to market, production potential and etc. Habtamu (Citation2014) found that farmers in the district which was more accessible to infrastructure were producing and supplying more cash crops than potato in compare to their counterparts. This illustrates that the district which was less accessible than the other one in terms of road and transport facilities that a farmers was living could supply his/her potato to the market, thereby increases the quantity of potato supplied to the market. Hence, this variable hypothesized to affect household’s market participation and volume of supplied to the market either positively or negatively.
Lagged price of vegetables (LPRI): It is a dummy variable and perception of farmers on vegetable price in previous year, taking a value of 1 if it was good and 0 otherwise. If vegetables market price was attractive enough at previous year, the quantity of vegetables produced and supplied to the market was increased. So, it was affect market participation positively.
4. Result and discussion
4.1. Socioeconomic, demographic and institutional characteristics of sample households
The total sample size of respondents handled during the survey was 117; of which, 54.7% were male and 45.3% were female farmers. The descriptive result (Appendix Table A1) shows that, the youngest and oldest ages of the respondents. The youngest age was 19 years old while the oldest was 77 years. In terms of vegetable market participation the average age was 43.87 for market participant and 42.78 for non-participants. The overall mean age was 43.62. According to the t-test results (Table ), there is no significant age difference between market participants and non-participants. This implies that the difference in age didn’t bring any difference in vegetables market participation.
Table 2. T-test comparison of means for continuous variables
The minimum and maximum education of household head was 0 and 12 years of schooling, respectively, while in terms of vegetables market participation the average education status of households was 3.2 years of schooling for market participants and 2.9 for non-market participants. It was statistically insignificant indicating absence of variation of households in terms of year of schooling between market participants and non-participants (Appendix ).The minimum family size was 1 Man Equivalent [ME] and maximum family size was 9 ME while in terms of vegetable market participation the average family size was 3ME for market participant and 2ME for non- participants. The two tailed t-test result shows that the family size was statistically significant at 1% it indicated that the variation of farmers in terms of total family size influences market participation (Appendix ). Those households who have more family size tend to participate into vegetable market than those with no or small number.
The average total irrigation area of the farmers found to be 0.12 ha. The minimum and maximum irrigation area was 0 ha and 1.25 ha, respectively. In terms of vegetable market participants and non-participants, the mean total irrigation area was 0.14 ha and 0.01 ha, respectively. The two-tailed test results of t-test showed that the irrigation area significantly influenced market participation at 1% and this indicated that those farmers with larger irrigated area have more opportunity to participate in vegetable marketing (Appendix Tables ). The average land allocated for vegetables production found to be 0.123 ha and the minimum and maximum land was 0.03 ha and 0.5 ha, respectively. In terms of vegetable market participants and non-participants, the mean total land allocated for vegetable production was 0.14 ha and 0.06 ha, respectively. The two tailed test results of t-test showed that the land allocated for vegetables production was significantly influenced market participation at 1% and this indicated that those farmers who allocated larger area of land have more opportunity to participate in vegetable marketing (Appendix Tables ).
Ownership of livestock in terms of Tropical Livestock Unit [TLU] by vegetables farmers found to be 5.8 in average and the minimum and maximum numbers of livestock owned were found to be 0 and 15.6 TLU, respectively. In terms of vegetable market participants and non-participants, the mean total livestock owned in terms of TLU was 6.2 and 4.6, respectively. It was statistically significant at 5% indicating that the mean difference between the two groups create difference in households regarding vegetables market participation (Appendix Tables ).
The average market distance for vegetable farmers was found to be 1.1 walking hour whereas the minimum and maximum distance recorded from farmers’ villages to vegetable market was found to be 0.5 hr and 3 hr, respectively. The results of t-test showed that market distance was statistically insignificant implying that there is no statistically mean difference between market participants and non-participants regarding market distance (Appendix Tables ). The average off and non-farm income for the farmers was found to be 404Ethiopian Birr [ETB] whereas the minimum and maximum income recorded was found to be 0 and 7000ETB, respectively. The results of t-test showed that off and non-farm income was statistically insignificant implying that there is no statistically mean difference between market participants and non-participants regarding off and non-farm income (Appendix Tables ).
The result in Table shows that 53.3% vegetable producers were market participants while 66.7% of them were non-participants from Yayu district. On the other hand, 46.7% of vegetables farmers were vegetables market participants while 33.3% were found to be non-participants from Hurumu district. The result of the chi-square test indicates that district was found to be insignificant. The result in Table shows that 58.9% of market participants were male while 41.1% of vegetable market participants were female. On the other hand, out of non-participant respondents, 40.7% of non- participants were found to be male and 59.3 % were female farmers. The result of chi-square test result shows that sex was statistically significant at 10% significant level. The result indicating that variation in sex caused significant differences in relation to vegetables market participation between the two groups.
Table 3. χ2- test of dummy variables in relation to vegetable market participation
According to the result in the Table , the lagged price for 36.7% of vegetables market participants had been not good (cheap), whereas 63.3% of vegetables market participants said, the lagged price had been good. On the other hand, for 92.6% of non-participant vegetables producers reported that, lagged price had not been good price (cheap), whereas for the rest of 7.4% of non-market participants were good price. The result of chi-square test shows that lagged price was statistically significant at 1% significant level. The result indicating that variation in cheap and good price caused significant differences in relation to vegetables market participation between the two groups.
In terms of credit access within the vegetables market participants, 45.6% of vegetables producers had access to credit and 54.4% were inaccessible to credit regarding market participation. On the other hand, within the non-participants, 11.1% had access to credit and 88.9% were inaccessible to credit. The result shows that it was statistically significant at 1% significance level, indicating that difference in the access to credit between market participant and non-participant in terms of market participation.
In terms of access to extension services, the result shows that 92.2% of the vegetables market participants had an access to extension service while 7.8% did not have access. On the other hand, within the non-participants, 29.6 % had access to extension and 70.4% were did not have extension service. The result shows that it was statistically significant at 1% significance level, indicating that that access to extension service brings statistical change between the market participant and non-participant in terms of market participation (Table ).
4.2. Econometric model outputs
4.2.1. Heckman two-stage estimation result
Before the execution of the econometric analysis the hypothesized independent variables were tested for the presence of serious multicollinearity problem. The variance inflation factor and contingency coefficient were computed to check association among continuous variables and dummy variables, respectively. Both the VIF values and the contingency coefficients shows there is no multicollinearity problem in the data. The values of VIF for continuous explanatory variables were less than 2 and the contingency coefficients for dummy explanatory variables was less than 0.75; which indicated that both sets of continuous and dummy variables have no serious multicollinearity problem (Appendix Tables ). Thus, all hypothesized explanatory variables were included in the econometric analysis. Breusch-Pagan/Cook-Weisberg test was also employed to detect heteroscedasticity (Gujarati, Citation2004). The problem was solved by robust standard error. In addition, omitted variable test, with Ramsey RESET test using powers of the fitted values of extent of market participation; F (3, 100) = 7.83; prob > F = 0.0001; which showed there was no omitted variable in the model.
4.2.2. Determinants of market participation
Under this analysis 117 sample vegetable producers were included. Using two-step Heckman selection model the analysis had provided the results of the determinant factors influencing decision to participation and the extent of participation in the vegetables market. In addition, the Inverse Mills Ratio generated from the first stage had been added as an additional explanatory variable in the second stage.
The result of the Heckman first stage model is summarized in Table . To examine what factors determine sample households decision to sell or not vegetable in the market, a total of thirteen explanatory variables were selected and entered in to the model. Accordingly, one exclusion restriction variable that is lagged price was included in the participation equation but not in the outcome equation. Therefore, lagged price have effect on market participation decision but not on marketed surplus. The marginal effects were used for interpretation, since the coefficients of selection equation have no direct interpretation. The reason is that they are just values that maximize the likelihood function (Heckman, Citation1979).
Table 4. Determinants of vegetable market participation decisions
The chi-square test shows that the overall goodness of fit of the probit model. It is statistically significant at a probability of less than 1%. This shows that jointly the explanatory variables included in the probit model regression explain the variations in the households probability to participate in vegetables market. Second, Pseudo R2 values indicate that the explanatory variables included in the regression explain 66% of the variations in the likelihood to participate in vegetables market.
In identifying the factors that influence the decision of farmers either to participate or not in the vegetables market, thirteen variables were entered in to the model out of this six variables were found to be significant. Accordingly, district, family size, irrigation access, credit use, extension contact, lagged price had significant influence on market participation of sample farmers in vegetables market (Table ).
4.2.2.1. District
District had been negatively and statistically significant at 5% probability level. As the district becomes Yayu the probability of participating in the vegetable market decrease by 15.2%, all other factors held constant. Since, in Hurumu district the trend of vegetable production and marketing is high and access to irrigation was high which forces farmers to produce high value and short period crops like vegetables as compared to Yayu district. The result is in agreement with Erko (Citation2014) who stated that study areas of the two districts differ in their total production and market entry and have significant effect on market participation.
4.2.2.2. Family size
Family size of farmers had been associated positively with farmers likelihood to participate in vegetable market and statistically significant at 5% probability level. As the sample farmers family size increases by 1ME, the probability of participating in the vegetable market increases by 6.3% all other factors held constant. The higher the number of productive household members in the household, the amount of vegetable produced increased and as a result farmers’ likelihood to participate in vegetable has been increased. In line to this Agete (Citation2014) reported that family size positively influenced farmers market participation decision.
4.2.2.3. Irrigation
Similarly to the prior expectation, irrigation had been positively associated with the likelihood of farmer to participate in vegetable market and statistically significant at 10% probability level. This indicates that as the irrigated land increases by one hectare, it increases the production of vegetable in dry season and probability of participating in the vegetable market by 107%, all other factors held constant. Irrigation system fill the gap occurred due to water shortage enhance vegetable production and marketing. In line to these Alim et al. (Citation2017) who found that availability of irrigation land affect vegetables market participation positively and significantly.
4.2.2.4. Credit
Econometric analysis shows that access to credit is another important variable having significant and positive impact on the decision of smallholder farmers to participate in the vegetable market. It is statistically significant at 5% probability level indicating that households who have access to credit tend to participate in the vegetable market than those who haven’t access to credit. As households have access to credit, the probability of participating in the vegetable market increases by 25% all other factors held constant. Households who have credit access purchase inputs which are required for the production of vegetables and can implement modern farm practices: thereby market participation will increase as production increases. In line to this, Matz (Citation2014) indicated that credit having positive and significant effect on smallholder farmer’s decision to enter the vegetables market.
4.2.2.5. Extension
The study, results indicated that the number of extension visits from extension agent had a positive and significant effect at 5% probability level on the decision to participate in the vegetable market. As households have access to extension contact, the probability of participating in the vegetables market increases by 13%, all other factors held constant. This is because extension workers advise farmers on modern production process of vegetable and provide information on market availability as well as information on new and improved varieties that improve the farmer’s knowledge and increase their bargaining power. Christopher et al. (Citation2014) also got a similar result; they found a positive and significant effect of extension access on the market participation of potato.
4.2.2.6. Lagged price
As expected the lagged price had a positive effect on the probability of vegetables market participation and found to be statistically significant at 1% probability level. The marginal effect show that, as market price of vegetables was good in previous year it increases the probability of farmers in participating in the vegetable market by 27%. This is an indicator that, price is among driving and influential factors that encourages participation in vegetable markets. From the time when vegetable price is high in the market in the previous year, farmers would be interested to allocate more land, enough time and budget for production of vegetables as result production of vegetables increases and farmers has willingness and ability to participate in the market. This is because a farmer is more likely to sell their produce to markets because they need to increase their income. The result is in agreement with Abera (Citation2015) who state that households who perceived the lagged market price of previous year was good, they are interested to produce and participate in the market more than those farmers who did not perceived the lagged market price was not good.
4.2.3. Determinants of extent of vegetable market participation
To identify the factors that influencing the extent of market participation in vegetable marketing, OLS regression was estimated in the second step of the Heckman outcome equation. The results are presented in Table . Sex, family size, irrigation access, land, credit use, extension service and inverse mills ratio (lambda) were significant factors which influence the extent of market participation.
Table 5. Determinants of extent of vegetables market participation OLS estimates
4.2.3.1. Sex
Sex of the household head significantly and positively influences the extent of market participation at 5% significant level. The positive sign shows, being a male head of a household significantly increase quantity of vegetable supplied to market by 1.7Qt, as compared to that of female-headed households, keeping other variables constant. The male-headed households are believed to have access and control over resources, has better contact with extension agent and member in different farmers organization, produce large amount of vegetables as compare with female headed households, so have strong bargaining power which in turn increases the proportion of vegetables sales. This is in line with the finding of Abitew et al. (Citation2015) who found that gender of the household head positively and significantly influenced potato marketed supply. The authors stated as the reason that male headed households have better financial capability, better land size, better extension contacts, and better access to market information than female headed households. Georey et al. (Citation2014) who argued that men are likely to sell more due to their acumen in bargaining, negotiating and enforcing contracts.
4.2.3.2. Family size
It affects vegetable market supply positively and significantly at less than 10% significance level. The sign of the coefficient is positive and it means that if a farm family has more labour or productive age its participation in the output market increases. The model output shows that as family size increased by 1ME the quantity of vegetable supplied to the market increased by 0.5Qt, other factors held constant. Therefore, the households with a large number of active family labour or active productive labors can reduce their cost of production and marketing, produce surplus production and market-oriented. This result is consistent with (Hossain, Citation2015).
4.2.3.3. Irrigation
As proposed and expected, this variable is a positive relationship and significant at 1% probability level. The significant and positive sign indicates that as irrigation land increased the probability of quantity of vegetables production increases and the more would be supplied to market. The model output indicated that as irrigation land increased by one hectare the quantity of vegetable sold increased by 9Qt, other factors held constant. Irrigation is an important influential factor of extent of market participation because farmers who have irrigation land may produce better quality at off season and more consistent products and have greater ability to have multiple production cycles over a year. This is in line with Yohanes (Citation2015) who found that irrigation significantly and positively influences on the extent of market participation.
4.2.3.4. Land allocated for vegetable
The result shows that land allocated for vegetables production has significant effect on volume of sales of vegetables at 1% significant level with expected positive sign. The positive sign of the coefficient implies that as farmers allocate large size of land for vegetable production large amount of vegetable produced; thereby quantity of vegetable supplied to the marked increased. Increase in the size of one hectare of land allocated for vegetables production is increase volume sales of vegetable by 11.6Qt, keeping other factors constant. In support of the finding here, Alemnew (Citation2010), Tola (Citation2014), and Hailu (Citation2016) indicated that the area of land allocated for red pepper, tomato and vegetable production affected the amount of sold of each commodity significantly and positively.
4.2.3.5. Credit
As expected, credit access had been positively and statistically significant at 1% level of significance. This indicates that as credit access increases by a unit, increases the quantity of vegetable supplied to the market by 2.7Qt, all other factors held constant. As households get credit, they use it to purchase inputs, to hire labour which is required for the production of vegetables; as result quantity of vegetable supplied to the market increased. Inline to this, study by Habtamu (Citation2014) found that a positive and significant effect of credit access on the volume of potato sold. Further study by Alemnew (Citation2010) and Muhammed (Citation2011) found that if producers access credit for production of pepper, the intensity of pepper supplied to the market increased.
4.2.3.6. Extension
The other significant variable was extension service, which affected positively the marketed supply of vegetable. Extension access had been positively and statistically significant at 5% level of significance. This indicates that as extension access increases by a unit, increases the quantity of vegetable supplied to the market by 1.3Qt, all other factors held constant. This suggests that access to extension service avails information regarding technology which improves production that affects the marketable surplus. This result is consistent with (Ayelech, Citation2011).
4.2.3.7. Inverse mills ratio (Lamda)
It was significant and negatively related to marketed surplus at 10% significance level which implies that the error term in the selection and outcome equation is negatively correlated. This indicates sample selection bias, the existence of unobserved factors that determine farmers’ likelihood to participate in vegetables market and thereby affecting the marketed surplus.
5. Conclusion and recommendations
5.1. Conclusion
This study provides information on the factors affecting participation and extent of participation of farm households in vegetable market and identifies important factors that affect the vegetable marketing sector. The influential variables which were found to be significantly affecting decision of smallholder vegetables farmers to participate in the vegetable market were district, family size, irrigation access, credit use, extension contact and lagged price, whereas after farmers decide to participate in vegetables market; sex, family size, irrigation access, land, credit use, extension service and inverse mill’s ratio influencing the volume of vegetables sold to the market. Hence, these significant factors need to be intervening so as to enhance the possible gain that could be drawn from vegetables market particularly in the study area. So, concerned body should have been focus on those factors and possible intervention is needed to increase smallholders’ farmer well-being. Therefore, this study can be shed light on required efforts and shows the ways of intervention for agricultural practitioner and policy makers to enhance the production and utilization of vegetable at larger scale to bring about economic development in the areas.
5.2. Recommendations
The recommendations or policy implications to be drawn from this study were based on the significant variables from the analysis of study.
Helping farmers and providing new technology to use irrigation become very important for farmers to produces high value vegetable products two times in a year in terms of nutrition and cash and also to participate on vegetable market.
Cultivated land size had positive effects on volume of vegetable sold. However, increasing the size of land only not a possible alternative to increase market surplus since land is finite resource rather proper land management and using improved modern farm practice increase productivity and volume of vegetable sold. This will leads to those farm households who owned small size of land will participate in the market. Thus, interventions by governmental and nongovernmental organizations through promoting and provision of improved technology packages, climate smart vegetable variety and better practices would increase the productivity and marketing surplus of vegetables and improve the level of market surplus of households who own small size of land.
Accessing credit for farmers becomes very important for purchasing of inputs, hiring labour for production; as a result farmers participate in vegetables market and quantity of vegetable supplies to the market increases. So, concerned body specially microfinance institutions and cooperatives should be facilitating credit services for farmers are important.
Strengthening efficient and effective extension service for all farmers, supporting development agents by giving continuous capacity building trainings and assigning plant and horticultural professional for each kebeles and separating the political and professional work increases vegetable market participation and supply to the market.
Lagged market price has positive effect on the market participation. The output price is an incentive for farm households to supply more produce for sale. Therefore, in order to increase the quantity produced and sold, interventions by government should focus on, arranging and encouraging farmers in collective organization, minimizing transaction costs and linking farmers with exporters through which they can take the advantage of bargaining power in output market.
Strengthen integration among vegetables marketing agent.
Finally, further studies on the market chain of vegetables, market integration and commercialization are recommended to identify important factors that affect marketing of vegetables so that a well-organized regional and national vegetable production and marketing can be implemented.

Abbreviations
CSA: Central Statistics Agency,CC Contingency Coefficient, Ha: Hectare; Hr: Hour; IZR;Illuabora Zone Report, Masl: Meter above Sea Level; ME; Man Equivalent,OLS;Ordinary Least Square,TLU: Tropical Livestock Unit and VIF; Variance Inflation Factor.
Kebele
The lowest administration unit
Acknowledgements
At the first we would like to praise the everlasting father and the prince of love and peace the Almighty God, who always let the bulk of unfinished work to be completed at a moment. Moreover, we would like to appreciate the respondents and district experts for their valuable response during data collection process.
Disclosure statement
No potential conflict of interest was reported by the author(s).
Additional information
Funding
Notes on contributors
Banchamlak Hegena
Banchamlak Hegena is a Lecturer in Agribusiness and Value Chain Management at Wolkite University, Ethiopia. She did her M.Sc from Jimma University in Agribusiness and Value Chain Management in 2018. She has special interest, in conducting research and identifying problems on agribusiness, value chain analysis, cooperative, food security, marketing, and gender issues in addition to offering the course for students.
References
- Abay, A. 2007. Vegetable Market Chain Analysis: The Case of Fogera Woreda in ANRS of Ethiopia. MSc Thesis Presented to the School of Graduate Studies of Haramaya University. 79p.
- Abay, A. 2010. Market Chain Analysis of Red Pepper: The Case of Bure Woreda, West Gojjam Zone, Amhara National Regional State, Ethiopia. MSc Thesis.
- Abera, S. (2015). Determinants of haricot bean market participation: the case of East Badawacho district, Hadiya Zone,Southern nations nationalities and peoples regional state.
- Abitew, M., Emana, B., Ketema, M., Mutimba, J. K., & Yousuf, J. (2015). gender role in market supply of potato in Eastern Hararghe Zone, Ethiopia. African Journal of Agricultural Marketing, 3(8), 241–23.
- Adugna, G. 2009. Analysis of Fruit and Vegetable Market Chains in Alamata, Southern zone of Tigray: The Case of Onion, Tomato and Papaya. MSc. Thesis presented to the School of Graduate Studies of Alemaya University
- Agete, J. (2014). An analysis of factors influencing participation of smallholder farmers in red bean marketing in halaba special district Ethiopia. University of Nairobi.
- Alemnew, A. 2010. Market Chain Analysis of Red Pepper: The Case of Bure Woreda, West Gojjam Zone. MSc Thesis, Haramaya University, Haramaya, Ethiopia.
- Alim, S., Akira, N., & Masahiro, I. (2017). Small-scale vegetable farmers’ participation inModern retail market channels in Indonesia:. Mdpi, 16.
- Almaz, G., Negatu, W., Wale, E., & Ayele, G. (2014). Constraints of vegetables value chain in Ethiopia: A gender perspective. International Journal of Advanced Research.
- Aman, T., Bekele, A., & Zemedu, L. (2013). Determinants of smallholder commercialization of horticultural crops in Gemechis District, west Hararge Zone, Ethiopia. African Journal of Agricultural Research, 3, 310–319.
- Amemiya, T. (1985). Advanced Econometrics. Harvard University Press.
- Asfaw, S., & N.d, M. D. (2010). What impact are EU supermarket standards having on developing countries’ export of high value horticultural products? Journal of international food and agribusiness marketing. Evidence from Kenya, 252276.
- Ayelech, T. 2011. Market chain analysis of fruits for Gomma woreda, Jimma zone, Oromia National Regional State. MSc Thesis presented to School of Graduate Studies, Haramaya University.
- Aysheshm, K. 2007. Sesame market chain analysis: the case of Metema woreda, north Gondar zone, Amhara National Regional State. MSc. Thesis Submitted to Haramaya University.
- Barrett, C. B. (2007). Smallholder market participation: Concepts and evidence from eastern Africa. Food Policy, forthcoming.
- Central Statistical Agency(CSA). 2020. Annual agricultural sample survey (meher season) report on crops area and production. Addis Ababa.
- Christopher, S. 1., Johnny, M. 1., Enid, K. 1., Apolo, K. 2., & Harriet, K. 1. (2014). Smallholder farmers’ decision and level of participation in the potato market in Uganda.
- Cragg, J. (1971). Some statistical models for limited dependent variables with application to the demand for durable goods. Econometrica, 39(5), 829–844. https://doi.org/10.2307/1909582
- Emana, B., & Gebremedihin, H. 2007. Constraints and opportunities of horticulture production and marketing in Eastern Ethiopia. Dry Lands Coordination Group Report No 46. Grensen 9b.
- Erko, B. (2014). Faba bean value chains the case of Bako Tibe and Gobu Seyo. Haramaya.
- Georey, S., Bett, H., & Kibet, L. (2014). Determinants of market participation among small scale pineapple farmers in Kericho County. Egerton University.
- Greene, W. H. (2003). Econometric analysis (Fifth ed.). Pearson Education International.
- Gujarati, D. (2004). Basic. (Econometrics.4th edition.Tata ed. pp. 614). McGraw-Hill Publishing Company Limited.
- Habtamu, G. (2014). Analysis of potato value chain in Hadiya Zone of Ethiopia, School of Agricultural Economics and Agribusiness (pp. 140). Haramaya University.
- Hailu, A. (2016). Value chain analysis of vegetables: The case of Ejere District. West ShoaZone, Oromia National Regional State of Ethiopia.
- Healy, F. J. (1984). Statistics: A tool for social research. Wads worth publishing company.
- Heckman, J. J. (1979). Sample selection bias as a specification error. Econometrica, 47(1), 153–161. https://doi.org/10.2307/1912352
- Hossain, A. G. (2015). Market participation decision of smallholder farmers and its determinants in Bangladesh. Economics of Agriculture.
- IZR(Illuababora zone Report).2018. Description of Illuababora zone.
- Jaleta, M., Beyera, G., & Hoekstra, D. 2009. Smallholder Commercialization: Processes, Improving Productivity and Market Success of Ethiopian Farmers.
- Jari, B., & Fraser, G. (2009). An analysis of institutional and technical factors influencing agricultural marketing amongst smallholder farmers in the kat river valley, Eastern Cape Province, South Africa. African Journal of Agricultural Research, 4(11), 1129–1137.
- Lefebo, N., Haji, J., Geta, E., & Zemedu, L. (2016). Determinants of status and extent of market participation amongBulla producers in Hadiya Zone, Southern Ethiopia. Journal of Biology, Agriculture and Healthcare, 84.
- Maddala, G. S. (1983). Limited dependent and qualitative variables in econometrics. Cambridge University Press.
- Makhura, M. T. 2001. Overcoming transaction costs barriers to market participation of smallholder farmers in the Northern Province of South Africa. PhD Dissertation, University of Pretoria.
- Matz, B. W. (2014). Smallholder participation in the commercialisation of vegetables.
- Muhammed, U. 2011. Market chain analysis of teff and wheat production in halaba special woreda, southern Ethiopia.M.Sc thesis submitted to the School of Graduate Studies, Haramaya University. 104p.
- Mussema, R., 2006. Analysis of red pepper marketing: The case of Alaba and Siltie in SNNPRS of Ethiopia. M.Sc thesis presented to the School of Graduate Studies, Haramaya University. 105 p
- NBE(New Business Ethiopia).2020. Annual business report, vegetables and fruit export.
- Ngaruko, V. M. (2015). Determinants of Farmers’ participation in high value crops in Tanzania. African Journal of Economic Review, III.
- Ngqangweni, S. 2000. Promoting Income and Employment Growth in the Rural Economy of the Eastern Cape through Smallholder Agriculture. Unpublished PhD Thesis, University of Pretoria.
- Olwande, J., & Mathenge, M. 2012. Market participation among the poor rural household in Kenya. Tegemeo Institute, Egerton University, Kenya. Selected paper prepared for presentation at The International Association Of Agricultural Economists (IAAE)Triennial Conference, Foz do Iguaçu, Brazil, 18-24 August 2012.
- Reyes, B., Donovan, C., Bernsten, R., & Maredia, M., 2012. Market participation and sale of potatoes by smallholder farmers in the central highlands of Angola: A double hurdle approach selected poster prepared for presentation at the International Association of Agricultural Economists (IAAE) Triennial Conference, Foz do Iguaçu, Brazil, 18-24 August, 2012.
- Samboko, P. C. (2011). an assessment of factors influencing the profitability of bean production in Zambia. University of Zambia.: UNZA.
- Shawn, B., Brian, D., & Johnson, L. (2007). Is the magic still there? The use of the Heckman two-step correction for selection bias in criminology.
- Shiferaw, B., & Teklewold, H. (2007). Structure and functioning of chickpea markets in Ethiopia: evidence bases on analyses of value chains linking smallholders and markets. Improving Productivity and Market Success (IPMS) of Ethiopian Farmers Project Working ILRI (International Livestock Research Institute) (pp. 63).
- Siziba, S., Nyikahadzoi, K., Diagne, A., Fatunbi, A. O., & Adekunle, A. A. (2011). Determinants of cereal market participation by sub Saharan Africa smallholder farmer. Learning Public journal of Agriculture and Environmental Studies, 2(1), 180–193. Accessed on 6 August 2014 www.Learningpublics.org
- Tadesse, N. (2011). Value chain analysis of vegetables in daro lebu district of west hararghe zone, Oromia region, Ethiopia. Haramaya University.
- Tobin, J. (1958). Estimation of relationships for limited dependent variables. Econometrica, 46(1), 24–36. https://doi.org/10.2307/1907382
- Tola, M. (2014). Tomato value chain analysis in the central rift valley: The case of Dugda woreda. Haramaya University.
- Wooldridge, J. M. (2005). Introductory Econometrics: A modern approach. South western collage publishing.
- Yamane, T. (1967). Statistics, an introductory analysis (2nd ed.). Harper and Row.
- Yohanes, M. (2015). Performance and challenges of vegetable market: The case of kombolcha district, east hararghe zone, Oromia national regional state, Ethiopia. Haramaya university.
Appendix
Table A1. Mean values of continuous variables of sample farmers
Table A2. Variance inflation factor for continuous explanatory variables inserted in Heackman
Table A3. Contingency coefficient for discrete explanatory variables