
 ?Mathematical formulae have been encoded as MathML and are displayed in this HTML version using MathJax in order to improve their display. Uncheck the box to turn MathJax off. This feature requires Javascript. Click on a formula to zoom.
Abstract
Many literature linked poverty with income, assets, and government support activities. This study however posited that the financial behaviour of households’ is also vital in poverty reduction along with other income enhancing activities. The study therefore investigated the effect of financial behaviour of households’ on urban poverty status. Data were collected randomly from 253 household heads and the collected data were analyzed descriptively and empirically using the logit model. The study found that besides the increase in income, good financial behaviour of households have vital role in reducing their poverty status. Therefore, it is recommended that when the government and other stakeholders work to reduce poverty, an emphasis should also be given to improvement of households’ financial behaviour through training or synchronization of financial education into the education curriculum. Financial behaviour improvement should become the mainstream issue in poverty reduction strategies along with other mechanisms.
PUBLIC INTEREST STATEMENT
One of the big problem developing countries faced is poverty. Previously, to reduce poverty it was prescribed that income boosting activities and pro-poor growth strategies. This study, however, argued that the financial behaviour of people is also a vital strategy to further reduce poverty. This is because, even though the income of households is improved, if they do not have healthy financial behaviour the income obtained from income boosting activities will be properly used. Therefore, this study shed light the effect of financial behaviour on urban households’ poverty status in Gurage zone evidence from Wolkite town. The study result confirmed that financial planning and living within financial plan, saving and risk behaviour, debit and price comparison behaviour of households has paramount relevance for the poverty reduction.
1. Introduction
Many writers define poverty in various ways based on the objective they want to achieve. Stating alternatively, there is no comprehensive and generally accepted definition of poverty. In most studies, the concept of poverty is closely related to measurement approach used in their study. Nevertheless, poverty is a multidimensional issue which describes a variety of interrelated and reinforcing deprivations (UN- High Commission for Human Right, Citation2012). It can also be understood from the perspectives of income and capability poverty (JICA, Citation2011). The income dimension focus on income and consumption while the capability dimension of poverty focus on political, socio-cultural, economic, human, and protective capabilities. Thus, poverty is a multifaceted problem to human being which requires different measures. WB (Citation2021a) and GIZ (Citation2015) documented that Ethiopia is Africa’s second most populous country with rapid economic growth and abundant resources in the one hand and an entrenched poverty on the other hand. Poverty is one of the major problems of Ethiopia, and the percentage of people living with poverty is substantial. It is one of the poorest countries in the world with a lowest per capita income as a result of prolonged war, drought, and other natural disasters such as floods, and the recent locust. The share of population living under poverty was 30% in 2012 although it was declined to 24% in 2016 (WB 2021). Moreover, UNDP (Citation2018) indicated that headcount poverty was dropped to 23.5% in 2015. Therefore, both of the evidences suggested that more than 20 million people of the country are living with poverty. As poverty is a deep-rooted problem of the country, poverty reduction becomes the most important objective of policy makers. For instance, during the sustainable development and poverty reduction program (SDPRP), the main objective of the government was poverty reduction along with macroeconomic stability (MOFED, Citation2002). Moreover, the Growth and Transformation Plan of Ethiopia was focused poverty reduction as the main objective of the government (NPC, Citation2015).Footnote1 To achieve the poverty reduction objective, various strategies were forwarded by governments such as encouraging the growth of agriculture sector, micro and small enterprises, infrastructure development, credit access and many others. In addition, this study posited that the financial behaviour of households has significant implication for the poverty reduction of households by influencing financial behaviour such as spending, saving, borrowing and pricing behaviours.
Financial behaviour can be defined as human being activities in relation to money and money related asset budgeting and management. It comprises concepts such as cash management, saving behaviour, debit behaviour and purchase behaviour of households. According to Van Raaij (Citation2016), the heart of financial behaviour is about the way how people manage their money in daily exchange by using mental accounting and budgeting their expenses. Besides, Morgan and Trinh (Citation2019) elaborated that financial behaviour is associated with the financial decisions and actions of economic agents that could have positive or negative consequences on person’s financial condition and welfare. A study by Trunk (Citation2015) indicated that the financial behaviour which is one component of financial literacy is vital to make accurate financial decision and to attainment of financial affluence. It is also argued that, in addition to its effect on financial decision and income, a study by Xiao et al. (Citation2009) shown that financial behaviour has played an important role to college students’ life happiness through financial and academic satisfaction. Moreover, Rahman et al. (Citation2021) studied the role of financial behaviour in explaining financial welfare of households and shown that it as a vital predictors of financial wellbeing of low income people in Malaysia. As indicated in the works of AKPK (Citation2018), financial behavio
ur and financial wellbeing have positive association. In addition, Mihretu (Citation2020) revealed that the financial behaviour of individuals in Addis Ababa city is low which in turn resulted in vulnerability of individuals at the incident of shock.
In the literature, various studies were found concerning the determinants of urban poverty status both at micro and macro level. However, these studies over looked the effect and role of financial behaviour of households as determinant of poverty. The present study however, argued that households’ financial behaviour has important implication on poverty reduction through the following line of justifications. First, acquiring higher income or job that reward higher return alone cannot guarantee for poverty reduction if the financial behaviour of households’ is unhealthy. This indicated that if the financial behaviour of the households is not healthy, the higher income or wage obtained will not be properly spent, saved and planned which probably caused households fall into budget shortage and poverty. On the other hand, it was argued that households with good financial behaviour are more likely to save and manage income and expenditure compared to households with unhealthy and wasteful financial behaviours. Moreover, the existing limited literature was undertaken in developed countries, and not studies were undertaken in the context of developing countries. Therefore, investigating the connection between financial behaviour and poverty status of households is fascinating because the result will provide a new insight for policy makers and practitioners. As per the researchers’ knowledge, previously no studies were carried out in the study case area regarding the association of financial behaviour of urban households and their poverty status. Therefore, the main objective of this study is to investigate the effect of financial behaviour of households on their poverty status in case of Wolkite town which is the seat of Gurage zone administration. The findings of the study could have implication for households, financial institutions and government. For financial institutions, particularly targeted in poverty reduction, it helps to design appropriate methods that enhance the skill, knowledge and attitude of their clients about finance and money. For government, the findings of this study will paved the way to aware financial behaviour of households as essential instrument to poverty reduction and incorporated it as the part and parcel of poverty reduction strategies. For households, it benefits them through the action of financial institutions and government to improve their financial behaviour, which helps them to appropriately manage, plan, and spend their finance and money. The rest of the study is organized as follow. Section 2 presents materials and method of the study, the third section presents about results and discussion, and the last section presents conclusion and recommendations of the study.
2. Materials and methods
2.1. Study location and population
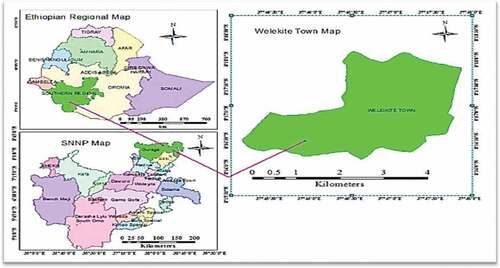
The study is undertaken at Wolkite town, the administrative seat of Gurage zone which is located in South Nations and Nationalities Peoples Regional State of Ethiopia. Wolkite town is 158 km far from Addis Ababa exactly on the main road of Jima. The astronomical location of the town is 07°10’ 08” North Latitude and 37° 37ʹ50” East Longitude. The target respondents of the study were households living in Wolkite town, and the administrative map of the town is displayed as figure .
Figure 1. Administrative map of wolkite town.Sources of Data.
To accomplish the study objective, both primary and secondary data sources were employed. The primary data were collected by using questionnaires and interviews. Secondary data includes various documents related to income, expenditure and financial behaviours used to link the findings of the study. Questionnaires were randomly distributed to households who live in Wolkite town.
2.2. Sampling techniques and sample size determination
Various mixes of probability and nonprobability sampling techniques were used to collect the data. Concerning questionnaires simple random sampling technique was employed, whereas purposive sampling technique was employed for the key informant interview. According to Gurage Zone Population office (GIZ, Citation2015), there are 12,652 households’ heads in study area. Using the national population growth rate (2.4%), the 2021 households heads size for the study area is projected, which become 14,586. Concerning the sample size, Yamane (Citation1967) was employed to determine the sample size which is written as Equationequation 1(1)
(1) .
Where, n is sample size, N is total population (14,586), and e is the margin of error at 5%. As per EquationEquation (1)(1)
(1) at 5% significant level, the sample becomes 359 households’ head. Then, the questionnaires were distributed to 359 those household heads randomly. On the other hand, the key-informants were selected purposively and conducted until information is saturated. The accuracy of the instruments was pre-tested by experts in the area.
2.3. Model specification and variable description
The collected data were descriptively discussed with the help of the mean, standard deviation, percentage, and correlation of variables of interest. Empirically, the data was estimated by using the logit model which is employed when the dependent variable has two responses. Therefore, we can determine households’ poverty status as being poor or not poor which is specified by binary random variable (Yi) that takes the value of 1 if households are identified as poor and zero otherwise as EquationEquation (2)(2)
(2) .
Where, yi is binary dependent variable which revealed the status of households’ poverty. The theoretical base for the development of the logistic model used in this study is based on Verbeek (Citation2004) which is presented as follow as EquationEquation (3)(3)
(3) .
EquationEquation (3)(3)
(3) is non-linear function, so it can be linearized by taking the natural logarithm then the model is written as EquationEquation (4)
(4)
(4) .
Where Pi is the probability that households’ is poor and (1−Pi) is the likelihood that the households’ is not poor. Xi represents the explanatory variables such as households’ financial behaviour and other demographic and socio-economic variables that are supposed to affect the poverty status of households’. Vital pre-estimation tests which include multicollinearity, heteroscedasticity, model adequacy and fitness tests were also undertaken. Finally, the poverty line according to the World Bank (Citation2011) was $1.90 expenditure per day. As of 14 July 2021, the exchange rate of dollar against Birr was 43.99 and multiplied by the poverty cut-off line it become 83.581 Birr per day. Then, the minimum monthly expenditure becomes 2507.43 Birr. Finally, households’ whose monthly expenditure falls short of 2507.43 Birr is considered as poor and households’ whose expenditure exceed
2507.43 Birr is considered as non-poor. To measure the extent, gap and severity of poverty, there are three main measure, head count index, poverty gap level, and poverty severity index. As indicated in Haughton and Khandker (Citation2009), the three measures are shown as EquationEquations (5)(5)
(5) , (Equation6
(6)
(6) ), and (Equation7
(7)
(7) ). The head count index (HC) as shown in Equationequation 5
(5)
(5) , measures the fraction of poor households from the total sample.
Where, Np indicates the number of households below poverty line, while N is the total sample size. The poverty gap also quantifies the extent to which individuals on average fall under the poverty line. The poverty gap (Gi) of poor households is the difference between poverty line (Z) and actual income (Yi), i.e. or individual (Z
. Then, the poverty gap index (P1) is written as EquationEquation (6)
(6)
(6) .
The last measure of poverty is the poverty severity (square poverty gap) index which measure inequality among poor households and it is the square of poverty gap index (P2) as shown in EquationEquation (7)(7)
(7) .
The foundation for measuring financial behaviour is Xiao et al. (Citation2009). Financial behaviour is measured by a number of indicator variables such as revenue and expenditure planning (budgeting), debit, saving and insurance behaviour, and price comparison behaviour. The desecriptions of variables used in the study are presented in Table .
Table 1. Variable descriptions
3. Result and discussion
3.1. Descriptive analysis
The researchers distributed a total of 359 questionnaires to the respondents. Out of which 253 were filled properly, completed and returned, whereas the remaining 106 questionnaires were not properly filled or lost. Thus, the response rate of the study is 70.47%, which is considered as good for survey research design as confirmed by Babbie (Citation2010). The result of EquationEquations (5)(5)
(5) , (Equation6
(6)
(6) ), and (Equation7
(7)
(7) ) is presented in Table . The head count index in the study area is 15.02% while urban national poverty rate is 25.7%. This indicates that the proportion of poor people living below the poverty line in the study area is smaller compared to the national urban poverty. In the same manner, in the study area the poverty gap index is 2.6%, which is also less than urban national poverty gap index of 7.3%. Finally, poverty severity index in the study area is 1.5% which is less than urban national poverty severity index of 2.9%. Effort was also made to compare the poverty status in the study area with the zone poverty level. The figure for the zone poverty status was taken from the findings of Mohamed (Citation2017). As shown in Table , poverty status in the study area measured by using the head count index, poverty gap index and poverty severity index is smaller compared to the zone poverty status by all measures.
Table 2. Output of the poverty measures
The descriptive analyses that indicate socio-economic and financial behaviours of households are presented in , respectively. Table shows that majority (56.92%) of the respondents are male while 43.08% are female respondents. Substantial number (78.26%) of the respondents is married while 21.74% is single (unmarried, widowed or divorced). Concerning education, 88.93% of respondents are literate which include primary education, secondary education, diploma and college, degree and above; however, 11.07% were illiterate. It is also indicated that 39.92% of the respondents are living in rented house while majority (60.08%) is living in own home (not living in rented house). Majority (90.90%) of the respondents are employed or have job but 9.10% are unemployed or have not job. Amongst employed respondents, 45.06%, 30.43%, and 24.51% is employed in public offices, private sectors and own business, respectively.
Table 3. Descriptive results of socio-economic variables
Table 4. Financial behaviour of respondents
Table also indicates that majority (84.98%) of the households in the study area are non-poor while 15.02% are poor. The average monthly income of the households is 5659.64 Ethiopia Birr (ETB) and that of expenditure is 4796.07 ETB. In addition, the average age of the households is 31.71 year, which is considered as the median of active working age or labour force. The average household size of in the study area is 2.75 which approximates to 3. Regarding dependency, on average there is one dependent individual among households with the minimum zero (no dependent) and maximum three dependence per households.
Table shows that most households (57.71%) in the study area cannot plan as well as record their revenue and expenditure appropriately. However, 42.29% of the respondents practiced revenue and expenditure plan preparation and recording. This indicates significant number of people in the study area is living without financial planning and recording of revenue and expenditure. Among households that plan and record their budget, 46.64% are able to live within their planned budget; however, 53.36% are not able to live within their planned budget. Regarding long-term financial plan, 61.26% of the households are planning their long-term financial objectives but 38.74% of households have not planned their long-term financial objectives. Regarding debit behaviour, 62.85% of households borrow from friends/relatives or financial institutions for consumption purpose, whereas 37.15% of households are not borrow for consumption purpose. At the present time, 40.71% of the households have debit while 59.29% have no debit. Majority (72.33%) of the respondents make comparison on debit and its payment, while 27.67% are not making comparison about debit and payment. On the top of that, 64.03% of the respondents pay their personal debit timely, whereas 35.97% of the respondents are no pay their personal debt timely.
Concerning saving, 53.75% of the respondents save money for future purchase of goods and service but 46.25% of the respondents are not saving for future purchase of goods and services. If income increases, the lion share (73.52%) of the respondents saves more on but 26.48% of the respondents could not save even if their income rises. It can be concluded that in the study area majority of households could not save for future investment; however, as income upsurges, the saving of most households rise while others could not save. It could be due to low income or lack or lack of saving culture by households. To reduce risk or emergency, buying insurance or saving money was practiced by households. In the study area, 51.78% of the respondents save money for emergency purpose but 48.22% of the respondent could not save for that motive. On the other hand, other respondents buy insurance (29.25%) to reduce risk but 70.75% of the respondents were not purchase. Regarding price behaviour, 71.93% of respondents consider and compare the prices when they buy goods and services, whereas 28.07% could not consider and compare prices when they buy goods and services. This implied most households are able to compare the prices of several of goods and services before making purchase. Similarly, 58.10% of the respondents take into account inflation when they save money in financial institutions. In contrast, 41.90% of the respondents could not take into account inflation when they set aside money in financial institutions.
3.2. Empirical analysis
The classical linear regression model assumptions such as linearity, homoscedasticity, normality, and autocorrelation are not required to be satisfied in logistic model. However, all independent variables should not be collinear each other which is tested by using correlation or Variance Inflation Factor (VIF). In logit model, test of VIF is undertaken by using Collin test. The VIF of the independent variables is close to 1 which indicates the linear association between variables is low. The overall fit of the logit model is also checked by using various techniques. One method is likelihood ratio (LR) test which measures how well independent variables jointly affect the dependent variable. The likelihood ratio, LR (26) = 42.97 is the likelihood ratio chi-square statistic, and the probability (prob) > LR = 0.003 is the p-value for LR (26) test. The result indicates that independent variables used in the model have high effect in jointly predicting the dependent variable. Another measure of goodness of fit is Hosmer-Lemeshow goodness of fit test. The null hypothesis of the Hosmer–Lemeshow test states the model fit well the data against the alternative hypothesis. The Hosmer–Lemeshow test statistics (17.41) is insignificant at (prob. > 0.2130) suggesting that the model was well fitted to the data.
The socio-economic features of households have vital implication on their poverty status. Table presents the effect of socio-economic variables on urban household poverty status in addition to their financial behaviour. As the age of households’ increase the probability being poor (poverty status) decrease i.e. for every year increase in age, the probability of households’ being poor decrease on average by 3.0%. In the literature there are mixed evidences regarding the effect of age on households’ poverty status. On the one hand, at lower level of age, the level of households’ poverty is low while as age increase poverty level increase. In contrast, at low level of age, the level of households’ poverty is high while at higher age level, the level of poverty is high. However, the result of this study supported the Rahman (Citation2013), which indicated that as the age of households’ increase the probability of being poor decrease. Stating alternatively, households’ at lower level of age are more likely poor. Households’ with old age could accumulate wealth, save money and own assets during the working age, whereas households’ with low age could at transition to employment or low accumulated wealth. The empirical result demonstrated that for every increase in the size of households’ the probability of being poor decrease on average by 5.0%. Although the finding of this result is not consistent with many evidences, it is consistent with the findings of author such as Kamuzora and Mkanta (Citation2000). The probability of being poor could be lower if we assume that all or majority of households’ member are in the working age and have a job. Because in this study and pervious literature, it is shown that wage income and age are directly related with the poverty status of households. On the other hand, marital status (being married) has positive effect on households’ probability of being poor. If the households’ is married, the probability of being poor is on average greater by 13% compared to single head households’. It could be due to the fact that married households have the responsibility to feed children, pay school tuition and other social responsibilities relative to single household heads. In the many empirical studies, it was established that as the number of dependency increase, the probability of households’ being poor could also be increase. Consistently, the result of the present study indicated that as for every increase in the number of dependency, the probability of households’ being poor on average increases by 5.0%. The result is consistent with Rahman (Citation2013) who investigated the effect of households’ characteristics on poverty and found that poverty is high in households’ with high dependency burden. It is also commonly accepted that owing assets such as house has vital role to reduce the poverty status of households. In line with this argument, the result of this study revealed that households that owned house probability of being poor is less compared to households who have no house. Households who owned house probability of being poor is on average less by 10% compared to households that have no house or live in rent. Regarding income, it is widely recognized that there is a negative relationship between income and poverty status. Although the effect is trivial, the result of this study showed that as the income of households’ increase the probability of being poor is decreased marginally.
Table 5. Estimated logit results
In addition to the socio-economic characteristics of households, few evidences suggested that households’ financial behaviour such as budgeting, debit, saving and pricing behaviours is important in reducing their poverty status. For example, Arini et al. (Citation2019) underlined that the financial behaviour of households has important implication in poverty reduction. As presented in Table , poverty is low for households that prepare revenue and expenditure plan and maintain record of the revenue and expenditure. As households’ improve their revenue and expenditure plan, the probability of being poor on average falls by 9.0% compared to households who could not prepare financial plan. A study by Ogori et al. (Citation2013) shown that financial budgeting is important in low income families because it decrease wastage, poverty and has the capacity to ensure organized way of living. This is because financial planning is a way to accomplish financial objectives of households. However, financial planning is not an end by itself rather it is a means to achieve financial objectives. In addition, living within the planned budget is very crucial. The empirical result showed that as households’ live within planned budget, the probability of being poor on average decrease by 18% compared to households’ that could not live within their budget plan. Regarding debit, it is posited that households’ debit behaviour has significant implication in poverty reduction. The result presented in Table indicated that households’ that borrow money for consumption purpose probability of being poor is less by 0.4% compared to households’ that could not borrow for consumption purpose. Borrowing money could solve the immediate financial constraints of households which in turn increase their expenditure and hence reduce the probability of being poor. Similarly, households that make comparison of the benefits and costs of debit and its payment are less likely to fall into poverty. Households’ that make comparison of the benefits and cost of debit and its payment probability of being poor is on average less by 20% relative to households that could not make comparison of the benefits and cost of debit and its associated payment. Concerning saving behaviour, household that save more when their income increase have low probability of being poor. The result indicated in Table show that households that save more when income increase probability of being poor is on average less by 7% compared to households that could not save more when their income increase. Price of goods and services has also important implications in the poverty reduction of households’. The empirical evidence presented in Table indicated that households’ that considered prices while buying goods and services probability of being poverty is on average less by 18% compared to households’ that could not considers prices while making purchase of goods and services. Finally, households’ that considered inflation while they save money in financial institutions probability of being poor is on average smaller by 2% than households that could not consider inflation while saving money in financial institutions. In a nutshell, the result in this study pointed out that the financial behaviour of households has important implication in reducing their poverty status.
4. Conclusion and recommendation
This study shed lighted about the effect of financial behaviour of urban households on their poverty status in the case of Wolkite town. Although poverty is a multidimensional problem of society such as economic, health, education, physiological, sociological, and political; however, this study emphasized on the financial aspects of poverty. Thus, future studies can consider the effect of financial behaviour on multidimensional poverty of households. In many empirical literatures, poverty is linked with income and other assets while ignoring the financial behaviours of households. However, this study argued that no matter how much income is obtained, wage is earned, and government is working to boost the incomes of household’s, if the households have not healthy and good financial behaviour, the issued poverty could not be resolved or it could perpetuate itself. It is posited that good financial behaviour could resulted in a good money management behaviour which in turn has crucial role in poverty reduction. Therefore, the study argued that in addition to the socio-economic characteristics of households, their financial behaviour has crucial implication on their poverty status. To be specific, financial planning and living within financial plan, saving and risk behaviour, debit and price comparison behaviour of households has paramount relevance for poverty reduction effort of government and other stakeholders. Therefore, the study concluded that besides increase in income and wage, the healthiness of household financial behaviour is important for poverty reduction effort of the government and any stakeholders. That means good financial behaviour as measured by households financial planning, staying within budget, comparison of the cost and benefit of debit and its payment, saving habit, and price comparison while making purchase have the considerable influence to reduce urban poverty.
Based on the findings of the study, the following policy implications are forwarded. Poverty is complex social and economic problem that require various response mechanisms and the coordinated effort of various stakeholders. When the government and other stakeholders work to improve the financial status or reduce the poverty status of households, congruently an emphasis should be given to financial behaviour improvement of households through short-term and medium financial literacy training or incorporate financial literacy on the educational curriculum of the nation. Moreover, for long-term objective, financial behaviour improvement should become the mainstreaming issue in poverty reduction strategies along with other mechanisms.
5. Limitations of the study and direction for future studies
While undertaking this study, the researchers faced different challenges. The first and most challenge was the presence of limited literature related to the study topic. As a result of this, the researchers could not link some of their findings with previous literature. The second problem is the measurement issue related with poverty. The study used monetary measure of poverty but poverty is a multidimensional in nature thus future studies would investigate the effect of financial behaviour on multidimensional poverty. The third challenge is non-response and properly unfilled questionnaires. However, the researchers used contingency to increase the response rate more than 70%.
Disclosure statement
No potential conflict of interest was reported by the author(s).
Additional information
Funding
Notes on contributors
Endalkachew Kabtamu Mekonen
Endalkachew Kabtamu Mekonen is a Lecturer at the Department of Economics, Wolkite University, Ethiopia. He attended undergraduate and master program at the department of Economics, Addis Ababa University, Ethiopia. In addition to teaching, he participates in research and community services. His research interest but not limited to include poverty, financial economics, human resource economics, macroeconomic and microeconomic issues.
Dagnachew Terefe Degif
Dagnachew Terefe Degif is a lecturer at the Department of Sociology, Wolkite University, Ethiopia. His research interests include rural sociology, urban sociology, tourism sociology and economics of sociology.
Minda Yirga Beyene
Minda Yirga Beyene is a lecturer at the Department of Management, Wolkite University, Ethiopia. His research interest includes entrepreneurship, leadership, customer relationship management and financial management.
Notes
1. Acronyms
JICA = Japan International Cooperation Agency, WB = World Bank, UNDP = United Nation Development Program, MOFED = Ministry of Finance and Economic Development, NPC = National Plan Commission of Ethiopia.
References
- AKPL or Agensi Kaunseling dan Pengurusan Kredit. (2018). Financial behaviour and state of financial wellbeing of Malaysian working adults: AKPK Financial Behaviour Survey 2018 (AFBeS’ 2018).
- Arini, D., Widaningrum, A., & Hadna, A. (2019). Poverty Reduction and Financial Literacy for Women in Indonesia. In Annual Conference of Indonesian Association for Public Administration; Advances in Economics, Business and Management Research, Vol. (122), Indonesia: Atlantis press.
- Babbie, E. (2010). The Basics of Social Research (4th ed.). Thomson.
- Debeli, C. B., & Endegena, A. B. (2019). Urban poverty and its determinants in Debremarkos City: A household level analysis. Economy, 6(2), 65–13. https://doi.org/10.20448/journal.502.2019.62.65.75
- GIZ. (2015) . Conservation and sustainable use of natural resources: Biodiversity (Ethiopia). German Federal Ministry for Economic Cooperation and Development (BMZ).
- Haughton, J., & Khandker, S. (2009). Handbook on poverty and inequality; the World Bank. IBRD/WB.
- JICA. (2011). thematic guidelines for poverty reduction; the public policy department/poverty reduction task force.
- Kamuzora, L. C., & Mkanta, W. (2000). Poverty and household/family size in Tanzania: Multiple responses to population pressure? Research Report No. 00.4, ISNN 0856-41831, Tanzania Printers Limited.
- Mihretu, K. (2020). Financial capability in Ethiopia: A case study of Addis Ababa City. Business and Economic Research, 10(3), 245–254. from https://doi.org/10.5296/ber.v10i3.17508.
- MOFED. (2002) . Ethiopia’s sustainable development and poverty reduction program. Addis Ababa Ethiopia.
- Mohamed, B. (2017). Measurement and determinants of urban poverty in case of Southern Nations, nationalities, and peoples. Region, Ethiopia; International Journal of Scientific and Research Publications, 7(3), 181–189. www.ijsrp.org
- Morgan, P., & Trinh, L. (2019). Determinants and impacts of financial literacy in Cambodia and Vietnam. Journal of Risk Financial Management, 12(19), 19. https://doi.org/10.3390/jrfm12010019
- NPC. (2015). Growth and Transformation Plan II (GTP II) (2015/16-2019/20), Volume I: Main text, May 2016, Addis Ababa
- Ogori, F., Adebayo, Y., & Apeh Micheal, O. (2013). Effect of budgeting on family living, a case for low income earners of Kontagora people. International Open Journal of Economics, 1 (5), 42–53. from http://acascipub.com/Journals.php
- Rahman, A. M. (2013). Household characteristics and poverty: A logistic regression analysis. The Journal of Developing Areas, 47(1), 303–317. Spring 2013). College of Business, Tennessee State University Stable. https://www.jstor.org/stable/23612271
- Rahman, M., Isa, C., Masud, M., Sarker, M., & Chowdhury, N. (2021). The role of financial behaviour, financial literacy, and financial stress in explaining the financial well‑being of B40 group in Malaysia. Future Business Journal, 7(1), No.(52. https://doi.org/10.1186/s43093-021-00099-
- Trunk, A. (2015): Financial education and financial literacy. conference paper, available at researchgate, from https://www.researchgate.net/publication/273757674
- UN- High Commission for Human Right. (2012). Principles and guidelines for a human rights approach to poverty reduction strategies; HR/PUB/06/12. from https://www.ohchr.org/Documents/Publications/PovertyStrategiesen.pdf
- United Nation Development Program. (2018). Ethiopia National Human Development Report 2018. Industrialization with a Human Face
- Van Raaij, F. (2016). Understanding consumer financial behaviour: Money Management in an Age of Financial Illiteracy. (1st ed.). Palgrave Macmillan. https://doi.org/10.1057/9781137544254
- Verbeek M., (2004). A Guide to Modern Econometrics (2nd Edition); Ohn Wiley & Sons Ltd, the Atrium, Southern Gate, Chichester.
- World Bank (2011): World Bank poverty head count ratio index at purchasing power parity. from https://data.worldbank.org/topic/poverty?locations=ET
- World Bank. (2021a): The World Bank country overview of Ethiopia: from https://www.worldbank.org/en/country/ethiopia/overview#1
- World Bank. (2021b): The World Bank Ethiopia’s overview. from https://www.worldbank.org/en/country/ethiopia/overview
- Xiao, J., Tang, C., & Shim, S. (2009). Acting for happiness: financial behaviour and life satisfaction of college students. Social Indicators Research, 99 (1), 53–68. URL. http://www.jstor.org/stable/27734850
- Yamane, T. (1967). Statistics an introductory analysis. (2nd ed.) Harper and Row, USA