
 ?Mathematical formulae have been encoded as MathML and are displayed in this HTML version using MathJax in order to improve their display. Uncheck the box to turn MathJax off. This feature requires Javascript. Click on a formula to zoom.
Abstract
With climate change complicating South African households’ ability in attaining food security, climate-smart agriculture has been a significant recommendation for small-scale farming households. This paper examined the contribution of CSA adaptation to household food security in King Cetshwayo District Municipality’s small-scale farming system. Also, the paper investigated the relative popularities of specific CSA practices and the factors that determined ‘ ‘household’s choices among them. It involved comparing two local municipalities—Mthojaneni and uMhlathuze; selected based on their agricultural potentials. Data collection was done, using structured questionnaires, from 327 small-scale farmers sampled through a multi-stage technique. The data were analyzed with descriptive statistics, composite score index, the binary logistic and multinomial logistic regression models. Findings reveal that adaptation of CSA practices has a significant and positive influence on household food security. Further analysis shows that gender significantly and positively influenced household food security in Mthonjaneni but had no significant influence in uMhlathuze. Household food security was significantly and positively influenced by farm income, income from non-farm sources, farming experience and household participation in Mthonjaneni and uMhlathuze. By contrast, household size and dependency ratio significantly but negatively influenced household food security in Mthonjaneni and uMhlathuze. This paper argues that small-scale farmers should incorporate CSA practices as much as possible to maximize their benefits and improve their productivity and chances of being food secure.
PUBLIC INTEREST STATEMENT
Climate change and food security are among the pernicious threats to humanity. The agricultural sector is critical in tackling food insecurity and poverty through sustained improvements in income, especially for the smallholder farmers. But the sector’s reliance on natural conditions, especially weather, means that climate change can become a formidable obstacle, leader to severe food insecurity and other developmental stresses. Climate-smart agriculture affords a pathway to sustainable farming that features increased productivity and income, enhanced resilience and reduced greenhouse gas emissions that ultimately guarantees food security. How the adaptation of climate-smart agriculture affects small-scale farming households is therefore a valid enquiry, in addition to examining how farmer characteristics influence adoption of the practices. The present research confirms that climate-smart agriculture remains an important engine for sustainable improvements in rural households. This research is essential for policy formulation to promote climate-smart agriculture adaptation by small-scale farming households to improve productivity and food security.
1. Introduction
Many African countries are faced with the tasks of alleviating poverty and enhancing food security. However, many of these countries, sometimes, have to make sacrifices to allay the impact of climate change and GHG emission (Tibesigwa & Visser, Citation2015; Vermeulen, Citation2014; World Bank, Citation2016). A good example is stopping the production of ruminants that contribute to methane build up in the atmosphere yet is essential for “peoples” livelihoods and meeting growing food demands (FAO, Citation2013). The challenges facing these countries include low returns from the agricultural sector as well as issues in the eco-system such as pests and weed control, nutrient cycling, nitrogen fixation, soil regeneration as well as food security for the population as a whole but in particular for small-scale farmers (Msangi, Citation2014; Nwajiuba et al., Citation2015; Teklewold et al., Citation2013).
There are reports of a significant reduction in fallow periods, especially in many African countries, south of the Sahara (Nwajiuba et al., Citation2015). Unfortunately, coupled with the reduction are low investments in sustainable agricultural intensification and moving away from diversification to embrace sole cropping (Nwajiuba et al., Citation2015). This situation has led to a decline in agricultural output, accompanied by reduced food availability (Wekesa et al., Citation2018). Climate change has been identified to be a significant challenge of the 21st Century and a big threat to food production (FAO, Citation2013).
Pacing up with climate change is becoming more challenging since the ability to hold temperature increase in 2°C threshold is getting curtailed (IPCC, Citation2014). This challenge comes with its repercussions, and the world may have to be prepared to deal with it. One of the consequences of a changing climate is the difficulty the farming system faces to provide sufficient food for the ever-growing global population which is estimated to be about 8 billion and above 9 billion by 2030 and 2050, respectively (World Bank, Citation2015, Citation2016). The agricultural production system is therefore in urgent need of profound transformation.
Climate change significantly threatens the farming system and household welfare, particularly at the local level in many rural areas, exacerbating issues of malnutrition, hunger, and poverty (Lukano, Citation2013; Ncube et al., Citation2016). The majority of the small-scale farmers in Africa rely primarily on farming for their livelihood (Ochieng et al., Citation2017). They need to become more resilient and adaptive to climate change to protect and sustenance their livelihood and ensure their food security. Coping with the effects of climatic shocks and natural disasters depends greatly on resilience (Wineman et al., Citation2017).
The adaptation of climate-smart agriculture (CSA) practices is one way to combat climate change (FAO, Citation2013). However, despite the apparent benefits of CSA and the growing advocacy for farmers to embrace it, there is still a dearth of evidence on how CSA influences food security, particularly concerning small-scale farmers (Arslan et al., Citation2014; Kabubo-Mariara & Kabara, Citation2015). There is a need for better information on and understanding of the potential welfare effects of CSA concerning food security. This will provide insight for policymakers and stakeholders on the best strategies to adopt in mainstreaming CSA and enhancing its usage and effectiveness in small-scale agriculture. This study conceptualizes farming techniques that fit into CSA profile as CSA practices and CSA adoption intensity as the CSA adoption level among the small-scale farmers in the study area. Farmers were asked to identify the farming techniques they adopt for their agricultural production. The farming techniques which fit into the CSA profile based on FAO recommendation and the literature were identified for the study. The small-scale farmers identified for the survey are farmers with farm sizes of less than or equal to 5 hectares.
One of the 21st Century threats to humanity is climate change. Climate change adversely affects food systems and poverty, particularly at the micro-level (farming households). Climate-smart agriculture can increase sustainable agricultural productivity and incomes by building resilience and adapting to climate change, which is likely to reduce or remove greenhouse gas emissions and increase carbon sequestration (Wekesa et al., Citation2018). Despite the benefits of CSA highlighted in the literature, there is a lack of evidence on the effect of CSA on food security by small-scale farmers in South Africa and the factors that promote or hinder CSA adaptation. More research is critical to understand the farmers’ CSA adaptation effect and behaviour concerning food security to inform policy and strategies for championing effective CSA practices in smallholder production systems.
This paper provides a micro-level (farm household) analysis of the effect of CSA on household food security in small-scale production systems in King Cetshwayo District Municipality in South Africa. Specifically, the paper estimates the food security status of farming households using the household dietary diversity score (HDDS) and the household food consumption score (HFCS). Further, the effect of CSA adaptation on household food security is analysed using a binary logistic regression model. The paper hypothesises that farming households’ significant CSA adaptation level (a larger package of CSA) can improve their food security status. The study also hypothesises that the food security status of farm households is influenced by the CSA adaptation level and the farmers’ characteristics.
2. Materials and methods
2.1. Study area description
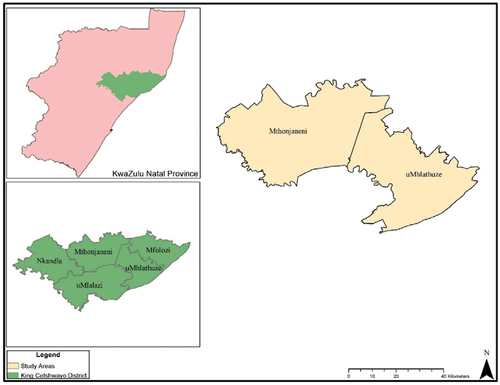
King Cetshwayo District Municipality (KCDM) of the KwaZulu-Natal (KZN) province of South Africa was selected for this study. The area was determined using the multi-stage sampling technique. In this regard, KZN was purposively chosen for this study, given the level of agricultural activities in the province and the presence of a substantial proportion of small-scale farmers compared to other provinces. The KwaZulu-Natal Province accounts for the highest proportion of South ‘ ‘Africa’s farming households (Lehohla, Citation2016). The next stage involved the random selection of KCDM. A random sample was employed to give every district municipality an equal chance of being selected. Subsequently, uMhlathuze and Mthonjaneni Local Municipalities were purposively selected within KCDM, given their agricultural sectors’ economic contribution. The other municipalities are Nkandla, uMfolozi and uMlalazi. The agricultural sector in Mthonjaneni has the highest economic contribution (33.5%) but the lowest in uMhlathuze (3.2%; ”Municipal Directory of South Africa,” Citation2017). The rationale for selecting the lowest and highest performing local municipalities concerning agricultural economic contribution was to allow for a comparative study of the farming households in the municipalities. Villages in the two selected municipalities were sampled using the list of villages recorded with the Department of Agriculture and Rural Development (DARD) in both municipalities. The records on the villages offered information on accessibility and availability of the farming households in the locations. is a map showing King Cetshwayo and the local municipalities in the district.
Figure 1. Map showing King Cetshwayo and the local municipalities in the area.
2.2. Research philosophy and approach
This paper adopts the positivist research philosophy. Positivism rests on the idea that there can be a reality outside personal experience, which has evidential laws and mechanisms that can explain cause and effect relationships (Bernard & Bernard, Citation2013; Neuman & Kreuger, Citation2003). This paper adopts positivism based on its central focus, which determines the effect of CSA adaptation intensity on the food security level of farming households. This paper conducts an objective explanation of the research objectives and rests on the conviction that the research respondents are not an obstacle to the research process.
A research approach describes the philosophical assumptions that direct how data are collected and analyzed (Creswell & Creswell, Citation2017). This paper employs a quantitative research approach. The quantitative research approach is generally associated with positivism and usually involves gathering and converting data into numbers for statistical calculations and analysis (Bergman, Citation2008; Žukauskas et al., Citation2018). This paper adopts a quantitative approach as it is best suited to elucidating associations among measured variables and forecasting outcomes.
2.3. Research design
This paper adopts a cross-sectional research design. A cross-sectional research design comes handy with an assay on how persons, subjects or phenomena differ (Akhtar, Citation2016). It can make use of data from different fields of study (Creswell & Creswell, Citation2017). It is cheaper to adopt and time-efficient (Creswell & Creswell, Citation2017). This paper considers a cross-sectional research design suitable because it accommodates time and cost efficiency without compromising reliable conclusions. Cross-sectional research design allows precise inquiry into the prospect of CSA concerning food security in small-scale agriculture, even with time and money constraint. This paper is empirical in nature and employs both descriptive and inferential analysis.
2.3.1. Theoretical framework
This paper adopts the theory of utility and the food security model.
2.4. Theory of utility
The decision of adapting CSA practices aligns with the theory of utility and profit maximization (Terdoo & Adekola, Citation2014). Farmers are assumed to adapt CSA practices when there is an expectation of a significantly higher utility or net benefit with the use. Utility in “farmers” activities is observed through the choices they make. Considering a rational farmer who wants to maximize benefits from agricultural production over a certain period, with a set of agricultural practices to select from, the farmer a chooses practice b for adaptation if the b is considered to have a higher utility than other practice/ s (assume, c). This relationship is stated as:
Where;
Uab and Uac represent the perceived utility by a farmer a from CSA practices b and c, respectively
Xa denotes a vector of predictors influencing the agricultural practice option selected by the farmer
βb and βc are parameters of the predictors
εb and εc are the error terms, which are assumed to have independent and identical distribution.
Based on the preference assumption, it is expected that the farmer chooses the more beneficial CSA practice over the other.
2.5. The food security model
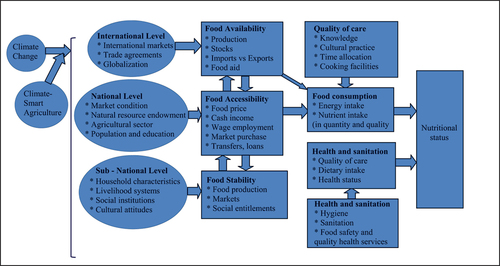
Food security is described as a state where there is entirely physical and economic access to sufficient, healthy and nutritious food needed for a lively life (FAO, Citation1996, Citation2015). There are four critical components in assessing food security in any system; how available, accessible and sustainable food is, and how well food can be utilized in such a system (Zhou et al., Citation2017). Availability means there is food in large quantities; accessibility means acquiring the amount required; sustainability means consistency of access and utilization relates to food quantity and quality at sufficient levels (Zhou et al., Citation2017). Food availability is dependent on the quantities of food from the production point to the distribution stage. Food availability deals with food sufficiency and with the capacity of the farming system to provide enough food. It is determined by the agro-climatic essentials of crops and grazing land plus the array of factors influencing “farmers” response to markets (Zhou et al., Citation2017).
Food accessibility is associated with the resources needed for food procurement, implying that access to food is influenced by income (Mbukwa, Citation2013). It is a function of the capacity to secure the resources—legal, political, economic or social—required to access food (FAO, Citation2015). This definition includes being able to access the resources needed to acquire food necessary for a proper diet. Today, the notion of food security applies to both individual and household levels as against what obtained before the 1970s when it was limited to national food production and world trade (FAO, Citation2015).
Food stability is influenced by the temporal or permanent nature of access to the resources required for sufficient food consumption (FAO, Citation2015). Variability in climatic conditions is a significant determinant of unstable access to food. The predicted escalation in weather fluctuation will likely exacerbate food insecurity to a critical level where food systems at the local or global scale are not guaranteed (FAO, Citation2015). Food utilization is explained by the safety and nutritional value of food and the absorption of food nutrients. It also relates to factors such as the social values of foods, the quality and safety of food supply all of which influence the food consumed on different occasions and at different periods (FAO, Citation2013, Citation2015).
The way food security has been viewed has changed over time. Different approaches have been used to define food security, and they are informed by which theory is adopted for assessment and farm measurement. The food security model chosen for this paper is adapted from rural households’ production and consumption behaviors. The measure of utility is derived from food consumption through satisfaction in taste characteristics and health effect/ s of the food consumed by households (FAO, Citation2015). Rabe-Hesketh and Everitt (Citation2004) adapted a model in analyzing the factors influencing food security (Equationequation 2(2)
(2) ):
represents the household (i) probability of being food secure, χi denotes the factors that determine whether household i will be food secure or not, γi is the observed food security status of the household i, while βj designates the estimates of the parameters. Representing
as Z.
shows the framework for food security, highlighting the link between food security components and the interconnection with some influencing factors.
EquationEquation 2(2)
(2) can be expressed to determine the probability of household i being food secure as (Equationequation 3
(3)
(3) ):
From Equationequation (3)(3)
(3) , the food insecurity probability of a household can be written as (1- ϕt), which gives another equation that can be expressed as (Equationequation 4
(4)
(4) ):
On the background of Equationequation (4)(4)
(4) , the odds ratio, which is ϕt/(1- ϕt), can, therefore, be expressed as (Equationequation 5
(5)
(5) ):
EquationEquation (5)(5)
(5) , when the natural logarithm is found, can be further expressed as (Equationequation 6
(6)
(6) ):
Based on the successful calculation of the conditional probabilities of each sampled household, the “partial” effect of each continuous variable on household food security is therefore expressed as (Equationequation 7(7)
(7) ):
The “partial” effect of each discrete variable is the difference between the probability estimate of the variable at 1 and 0 (χi = 0, χi = 1). This study adopts household dietary diversity and household food consumption as a proxy for food security measure.
2.5.1. Conceptual framework
This paper borrows from past studies in viewing climate change as observable variations in climatic conditions which could be ascribed to human activities (Belaineh et al., Citation2013). The paper conceptualizes CSA as a climate change adaptation approach focused on assisting farmers in managing climate change and enhancing their productivity. Food security is conceptualized as access to sufficient, healthy and nutritious food (Dooley & Chapman, Citation2014; FAO, Citation2013; Lipper et al., Citation2014).
Climate change adversely affects food availability, stability, access and utilization (FAO, Citation2013). It affects agricultural production directly by influencing crop pests and diseases, the soil’s capacity to retain water, soil fertility and crop yields. The indirect influence is by affecting agricultural demand, income distribution and economic growth. The impact of climate change is likely to raise the prices of commodities, bringing about a reduction in food consumption, worsening food insecurity (Kavallari, Citation2015). Although food demand does not respond sharply to price shift, the effect will still be felt, especially in areas with strains on natural resources (Kavallari, Citation2015). Climate change also brings about changes in food systems activities, which affects food availability (Greg et al., Citation2011). The conceptual framework in illustrates the significant role of CSA in enhancing food security.
Figure 3. Conceptual framework—the influence of CSA on food security.
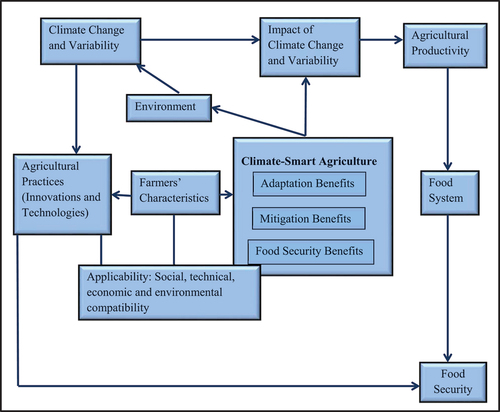
Changes in climatic conditions threaten agricultural productivity and stability. Indices of climate change such as temperature and precipitation changes are likely to modify production seasons, pests and disease trends, and change crop sets. The resultant effect of these is a change in food system activity, reducing food availability. However, the adaptation of CSA practices by farming households promises a “triple-”win’ benefit, including food security benefits, adaptation benefits and mitigation benefits. The benefits accrue to farmers and the environment through improved productivity, reduction in GHG emission, enhanced adaptation to changes in climatic conditions and the impacts (Lipper et al., Citation2014). All these benefits of CSA are anticipated to enable households to be more food secure. The CSA uptake in the small-scale farming system will likely enhance households’ food security by facilitating CSA adaptation and resilience in the system.
Agricultural practices that conform with CSA profile are conceptualized as CSA practices. Such practices were identified from the list of practices used in the study area. The agricultural practices identified include conservation agriculture (minimum tillage, leaving crop residue on the field), agro-forestry, use of organic manure, crop rotation, crop diversification (cereal/legume intercropping), mulching, use of wetland, planting of drought and heat tolerant crops, planting of cover crops, soil conservation techniques, integrated crop-livestock management, improved grazing, efficient manure management and diet improvement for animals.
2.6. Data collection
This paper focuses on small-scale farming households in KCDM. For representativeness in sampling, the records from DARD informed the sampling procedure from the two selected local municipalities. A confidence interval of 5 and a confidence level of 95 per cent gives a sample size of 327 from a total of 2 160 small-scale farming households comprising 720 households from Mthonjaneni and 1 440 from uMhlathuze. Following Hoyle et al. (Citation2002), a proportionate sampling was further carried out for each local municipality as follows:
Mthonjaneni = (720/2160) * 327 = 109
uMhlathuze = (1440/2160) * 327 = 218
Given the breakdown, there is a sample size of 109 for Mthonjaneni and 218 for uMhlathuze municipalities.
A structured interview was conducted for data collection using close-ended questionnaires. Relevant information required for empirical analysis were collected. The interview instruments were pre-tested before the actual survey. Thirty-five farmers were interviewed in the pilot test. The choice of 35 farmers for the pilot study was informed by the assertion that 10 per cent of sample size should suffice for a pilot study (Connelly, Citation2008; Moore et al., Citation2011). The suitability and aptness of the survey instruments to capture the data needed for the study were tested. The farmers who partook in the pilot survey were not involved in the actual survey.
The survey instruments were administered at the household level. The survey’s actual targets were the individuals engaging in the farming activities of each household and those handling food preparation for the household if they are different individuals. This aided quality and robust responses from the farming households. Questionnaires used for the survey were interviewer-administered to avoid misinterpretations or misunderstandings. Three hundred and twenty-seven questionnaires were administered for the survey. Data were collected from August 2018 to January 2019. The data collection exercise was carried out during working hours (08h00–16h00) and periods of social functions and events and days for social grant payment were excluded in the data collection schedule. Ethical clearance was issued for the study by the University of Zululand Research Ethics Committee (UZREC) before the commencement of the survey. The survey instrument was translated into the local language of the area (isiZulu) to ensure effectiveness in communication and to elicit relevant and reliable information from the households. Informed consent forms were presented to the respondents for consideration and signing before they could partake in the survey. Data were collected on CSA practices, “farmers” characteristics, the yield from agricultural production, nature, and food consumption pattern of the sampled farming households, among other attributes.
2.7. Data analysis
The effect of CSA adaptation on household food security was analyzed using a binary logistic regression model. CSA adaptation by the sampled households was captured using the composite score analysis. The sampled households’ food security status was captured using the HDDS. The binary (dummy) variable developed from the food security status was the dependent variable while the composite score on CSA adaptation and other hypothesized variables were the predictor variables.
2.7.1. The composite score analysis
The composite score was used in capturing CSA adaptation among farming households. A binary scale was used to represent the use of CSA practices /s by the farming households. Fourteen CSA practices were identified in the study area. A practice was scored 1 if used by a respondent and 0 if not used by the respondent. A respondent based on the total number of CSA practices identified can only have a maximum score of 14 and a minimum of 0. The score generated is used as a proxy to represent CSA adaptation among the sampled farmers.
2.7.2. Household dietary diversity score
Following Wekesa et al. (Citation2018) and Huluka et al. (Citation2019), this paper used HDDS as a proxy for household food security measure. The HDDS is a qualitative free recall of all foods or drinks that have been consumed by any household throughout 7 days. The HDDS is estimated by summing the number of food groups consumed within the period (FAO, Citation2010; Huluka et al., Citation2019). There is extensive scholarship on HDDS as an essential proxy for food security (Mango et al., Citation2014; Wekesa et al., Citation2018). Goshu et al. (Citation2013) note that HDDS has a high correlation with factors such as adequate ‘ ‘household’s consumption of calories, protein and other nutrients, which is an advantage for adopting it as a proxy for food security measure. Dietary diversity reveals the extent to which there is variety in the food consumption of a household and the household economic capacity for the consumption of a variety of foods (Mango et al., Citation2014).
Uraguchi (Citation2012) criticized the use of HDDS, stating that it does not include the estimation of the quantity of food that is lacking because it cannot be used for direct quantification of the amount of food consumed. Also, it does not explain the causes of consumption patterns. However, despite the mentioned weaknesses, HDDS remains a useful and vital proxy for nutrient adequacy for households, thereby making it still an essential and relevant measure of household food security (Mango et al., Citation2014; Nyikahadzoi et al., Citation2012). Evidence from analyses on several countries shows that households’ dietary diversity has a strong correlation with per-capita consumption and energy availability. This analysis suggests that HDDS is an essential indicator of household food security (Mango et al., Citation2014).
In this paper, the sampled households were requested to recall the food they consumed in the 24 hours before the interview. Data on the dietary diversity of the sampled households were collected using a 24-hour recall dietary intake. A list of food items taken in the last 24-hours was put on record. The foods and drinks stated were then categorized into the 12 standardized food groups presented in Table . Responses based on the food groups were categorized into yes, scored as 1 or no, which was scored as 0 (FAO, Citation2010; Huluka et al., Citation2019). Although the 24-hour recall exercise does not wholly reveal an individual’s habitual diet, it gives insight into the ‘ ‘population’s diet. shows the categorization of food items into food groups for HDDS estimation.
Table 1. Food groups for dietary diversity estimation
The 24-hour recall exercise has been established to be very useful in monitoring progress or target interventions (Muhammad-Lawal et al., Citation2017). This paper used the 24-hour recall period since it minimizes recall error. It has minimal complexity for respondents and can be established to conform to the recall period adopted in different studies on dietary diversity and food security (Muhammad-Lawal et al., Citation2017). Dietary diversity becomes more prominent if a particular household consumes at least one food item from a food group in the past 24-hours. In line with FAO’s recommendations, scores were allocated for each of the consumed food group, with the mean of the HDDS as the benchmark for dividing the sampled households into food secure or non-food secure groups (FAO, Citation2010).
2.7.3. Household food consumption score
This paper adopts HFCS as supplementary to HDDS. The HFCS is an extension of HDDS, including frequency weighting (Mango et al., Citation2018). The HFCS is estimated using the record of the food items under consumption prior to the previous seven days. Food items are categorized into 8 different groups: main staple, milk, pulses, oil, meat and fish, fruit, vegetables and sugar (United States Agency for International Development, Citation2015). The food groups’ consumption frequencies are summed up and then multiplied by their weighting, thus giving weighted food group scores. The aggregate of the weighted food group scores gives the HFCS. The HFCS obtained is a continuous measure, which can then be categorized into different thresholds of consumption groups namely, poor (0–21), borderline (21.5–35) and acceptable (> 35; Mango et al., Citation2018).
2.7.4. The binary logistic regression model
The effect of CSA adaptation on household food security was analysed using a binary logistic regression model. Although several methods such as linear probability, logit and probit models have been highlighted in the literature to analyse binary outcomes, this paper adopts a logit model. The rationale behind the choice of a logit model is the simplicity of its structural form and the interpretability of its outcome. A logit model has a standard logistic distribution of errors (Bogale & Shimelis, Citation2009; Green, Citation2012).
In line with the scholarship of Bogale and Shimelis (Citation2009), the logistic regression model is expressed as:
Where:
Pi = Probability that a farmer is food secure given χi
χi = A vector of predictors
α and β = Regression parameter to be estimated
e = The base of the natural logarithm
A logistic model is better expressed in odds and log of odds to simplify explanations on the parameter coefficients. The odds ratio explains the ratio of the household’s likelihood of being food secure (Pi) to being food insecure (1—Pi).
The expression of Equationequation (9)(9)
(9) in natural logarithm gives:
When the error term, ei factored in t; the equation is expressed as:
Zi is valued as 1 for the food secure households and 0 for those that are not
A Hosmer and Lemeshow goodness-of-fit test was run to test and see if the fitted models adequately explain the observed outcome from the data. A small disparity between the observed and fitted values and no systematic contribution of the difference to a structured model’s error indicates a fit model (Hosmer & Lemeshow, Citation2000). summarizes the predictor variables for the binary logistic regression model and their anticipated outcomes.
Table 2. Predictor variables in the binary logistic regression model for the analysis of the effect of CSA adaptation on household food security and their anticipated outcomes
2.7.5. Multinomial logit model
The Multinomial logit (MNL) model for climate change adaptation choice specifies the relationship between the probability of choosing alternative options, as shown in Equationequation (1)(1)
(1) :
Where βj is a vector parameter that relates the socio-economic, farm and institutional characteristics Xi to the probability that Yi = j. Five (5) broad groups of CSA practices were identified from the 13 CSA practices observed in the project area. Because the probabilities of the 5 adaptation strategies must sum to one, a convenient normalization rule is to set one of the parameter vectors, say β0, equal to zero (β0 = 0). The probabilities for the five alternatives then become (Green, Citation2012):
A multinomial logit system’s estimated parameters are more difficult to interpret than those in a bivariate (or binary) choice model described in the previous section. Insight into the effect that the explanatory variables have on the CSA practices choice can be captured by examining the derivative of the probabilities with respect to the vector of explanatory variables’ kth element. These derivatives are defined as:
Neither the sign nor the magnitude of the marginal effects need to bear any relationship to the coefficients’ sign. The Yi is the probability of choosing CSA practice. The following five groups of CSA practices were identified and calibrated as a nominal dependent variable for purposes of fitting the multinomial logistic regression model:
Use of Organic Manure;
Crop Rotation;
Integrated Crop-Livestock Management;
Planting of Drought and Heat Tolerant Crops;
Other CSA Practices.
3. Results
3.1. Socio-economic characteristics of farming households
summarizes the socio-economic characteristics of the sampled farmers. The indication is that, on the average, four CSA practices were adapted by the sampled households, implying that they employed multiple CSA practices for their agricultural production. The average age of the sampled farmers as presented in suggests that older farmers dominated the small-scale farming system in Mthonjaneni, uMhlathuze and KCDM (the combined analysis). The education status of the sampled farmers reveals that the average level of education among them was elementary. The average number of years invested in formal education among the farmers in Mthonjaneni was 6 years, while it was 7 years in uMhlathuze and KCDM.
Table 3. Socio-economic characteristics of the sampled farmers
The average size of the sampled households was 9. Different individuals living in farming households could be resourceful as labour for engagements on the farm, in which their involvement in farming could enhance agricultural production. The average dependency ratio of the sampled farming households was 4, implying that there were, on average, about 4 times more non-working persons in each household. The sampled farmers in the study areas earned an average monthly farm income of US $84 (Mthonjaneni), US $93 (uMhlathuze) and US $92 (KCDM), placing them above the 2019 South African national poverty line of US $83 (Statistics South Africa, Citation2019). The average income from off-farm activities (US $164) was higher than income from farming activities (US $ 84). The sampled farmers had an average of 13 years of farming experience, which could be ascribed to more older farmers in the study area(s). Results show that the sampled farmers live at about an average of 0.6 km apart from their farms. Results also reveal that an average of 5 members participated in farming activities Mthonjaneni while an average of 6 members participated in uMhlathuze and KCDM. The result on gender reveals that there are more female farmers in Mthonjaneni (56%), uMhlathuze (58%) and KCDM (58%).
3.2. Household food security
3.2.1. Household dietary diversity
This paper is conceptually aligned to Huluka et al. (Citation2019) with respect to the significance of dietary diversity scores in the measurement of food security. The households with the dietary diversity scores of ≤ 3 were categorized as having a low dietary diversity; those with scores between 4–6 were classified in the medium category while those with scores ≥ 7 were classified in the high category. summarizes the categories of the sampled households with respect to their HDDS.
Table 4. Categories of sampled farming households based on dietary diversity
The HDDS was further categorized into two major categories of food secure and food insecure, following the FAO guideline using the mean HDDS as the threshold. The farming households with HDDS above the threshold were categorized as food secure, while those below the threshold were categorized as food insecure. summarizes the household groups based on food security categories.
Table 5. Groups of sampled farming households based on food security categories
Table shows that most farming households in the sample were food secure.
3.2.2. Household food consumption
Table reveals that, based on food consumption score, the majority of the sampled households in Mthonjaneni (80%), uMhlathuze (81%) and KCDM (80%) had acceptable food consumption score. Findings reveal that 18, 16 and 17 per cent of the sampled households in Mthonjaneni, uMhlathuze and KCDM, respectively had borderline food consumption. Only 3 per cent of the sampled households in Mthonjaneni and KCDM had inadequate food consumption, while 4 per cent in uMhlathuze had inadequate food consumption. summarizes the categories of the sampled households based on their food consumption.
Table 6. Categories of sampled households based on food consumption
3.3. Model fitness for the effect of CSA adaptation on food security
shows that the likelihood ratio chi-square test value for the logit models for Mthonjaneni and uMhlathuze and that for the combined analysis are 79.06, 54.36 and 121.53, respectively. The likelihood ratio chi-square test shows whether there is any regressor’s coefficient in the model which is not equal to zero. The prob > chi2 is the probability of obtaining the chi-square statistics’ value if there is, in fact, no effect of the regressors, taken together, on the regressand.
Table 7. Effect of CSA adaptation on food security of sampled farming households
The prob > chi2 value obtained for each of the three models is 0.0000. A small value of less than 0.0001 obtained for these models means that one or more of the regression coefficients in each of the models is not equal to zero, implying that the overall models are statistically significant. The Hosmer-Lemeshow chi2 test result for the fitted model for Mthonjaneni shows a value of 18.04 with a prob>chi2 value of 0.8794. The result for the model fitted for uMhlathuze shows a value of 19.07 with a prob>chi2 value of 0.8258 while that of the combined analysis shows an F value of 33.80 with a prob>chi2 value of 0.5140. The results obtained from these tests indicate a good model fit of the data (Table ).
The multinomial logistic regression was performed to determine the likelihood of sampled farmers choosing a particular CSA practice, or category of practices in this case, and the factors that determine the choices they make in that regard. The results are presented in . The “Use of Organic Manure“ was set as the base outcome (see, Table ) for the model principally because it is the most popular category among the sampled farmers. The widespread concern over declining soil fertility probably explains the popularity of organic manures (Odhiambo & Magandini, Citation2008). In a study in South Africa, they opine that organic manure use could alleviate soil infertility. Examining the results from the level that follows the base outcome, the aim is to determine which of the explanatory variables significantly predict whether a sampled farming household chooses the “Crop Rotation“ practice rather than the base outcome of the other groups. The results show that for sampled farmers who currently adapt ”Crop Rotation”, household size, extension contact, and agricultural production are likely to influence their strong acceptance of ”Crop Rotation” as the best option to any other CSA practice from which farmers can choose in the project area. Again, smallholder farmers in South Africa have long seen crop rotation as one route to economically sustainable farming (Nel, Citation2005).
Table 8. Factors determining choice of alternative CSA practices by sampled farmers
Sampled farmers who adapted “Integrated Crop-Livestock Management“ and had many years of schooling, received numerous extension visits, engaged in agricultural production and owned relatively larger farm sizes, are likely to consider “Integrated Crop-Livestock Management“ as the preferred practice to the other CSA practices. This could suggest that sampled farmers with little or no education, owning smaller farms and with limited agricultural production run the risk of being lured out of ”Integrated Crop-Livestock Management” practice than their better-endowed counterparts. Those whose current practice is ”Planting of Drought and Heat Tolerant” crops, extension contact and larger farms will most likely influence their decision to continue applying their current practices rather than the alternatives.
Sampled farmers in the last group of practices that is “Other CSA practices” which includes the use of wetlands and conservation agriculture among a few other less popular practices, extension contact, agricultural production and farm size determine their decision to remain in this practice rather than select any of the other practices. The indication is that better-endowed farmers who host frequent visits from extension officials could consider conservation and wetland development as an option. In contrast, marginal farmers are less likely to get involved with these practices.
The analysis calculated the Relative Risk Ratio, which compares choices regarding the relative likelihood of their being made by the sampled farmer. For instance, for farmers practicing “Crop Rotation“, an increase in household size may slightly decrease the likelihood that they remain in the ”Crop Rotation” group whereas an increase in extension contact is likely to increase the likelihood of their remaining in the group by as much as a factor of 2. Thus, values of RRR less than one denote decreasing probability while values of RRR above 1 denote an increasing likelihood that a particular option will be chosen.
3.4. Effect of CSA adaptation on household food security
Table shows that CSA adaptation significantly affects the food security status of the sampled farming households. The adaptation of CSA practices was inputted into the model as a continuous variable using the composite score generated from the number of CSA practices adapted. Results show that CSA adaptation has a significant (p < 0.01) and a positive effect on food security in both Mthonjaneni and uMhlathuze. The model predicts that the adaptation of an additional CSA practice would raise the odds of the farming households being food secure by 3 in Mthonjaneni, but by a factor of 1 in uMhlathuze. The results imply that CSA adaptation would brighten the chances of farming households in Mthonjaneni and uMhlathuze to be food secure. However, CSA adaptation has a higher chance of influencing household food security in Mthonjaneni than in uMhlathuze. Furthermore, CSA adaptation also has a significant (p < 0.01) and positive correlation with the sampled households’ food security in KCDM. An additional CSA practice would raise the odds of food security of the sampled households by a factor of 2, implying that CSA adaptation would raise the possibility of food security in KCDM.
The household size variable was entered in the model as a continuous variable using the household members. Household size was significantly (p < 0.05) and negatively correlated with food security in Mthonjaneni and uMhlathuze. The model predicts that an addition to the household would decrease the household’s odds of being food secure by a factor of 1 in both municipalities. Household size also has a significant (p < 0.05) and a negative correlation with food security in KCDM. The model predicts that an additional household member would decrease the odds of the sampled households being food secure by a factor of 1. These results imply that the more populated a household is, the lower the chances of being food secure in both municipalities and the district municipality.
The dependency ratio, which is the measure of the non-working individuals to the households’ working individuals, was captured as a continuous variable. The dependency ratio of the sampled households has a statistically significant and negative correlation with food security among the sampled households in Mthonjaneni (p < 0.10) and uMhlathuze (p < 0.05). The model projects that an increase in the sampled households’ dependency ratio would reduce the odds of food security of the households by a factor of 1, in both Mthonjaneni and uMhlathuze. The implication is that the higher the households’ dependency ratio, the lesser their food security status. The sampled households’ dependency ratio is also statistically significant (p < 0.10) and negatively correlates with food security in KCDM. The model predicts that an increase in the household dependency ratio would decrease the odds of household food security by 1.
Farm income was captured as a continuous variable and had a significant (p < 0.05) and a positive effect on household food security in Mthonjaneni and uMhlathuze. Likewise, income from off-farm sources was captured as a continuous variable and had a significant (p < 0.05) and positive influence on household food security in the two municipalities. The models predict that a rand increase in income from farm and off-farm sources would increase the odds of household food security in both municipalities by a factor of 1. This finding implies that an increase in income from either farm or off-farm sources would raise the likelihood of food security in the two municipalities. Income from either source proved to have statistical significance (p < 0.05) and positive correlation with household food security in KCDM. The model predicts that a rand increase in income from either source would raise the odds of household food security by a factor of 1. This means that increase in income from farm and off-farm sources would brighten household food security status of households in KCDM.
The farming experience was captured as a continuous variable. It has a significant and positive correlation with household food security in Mthonjaneni (p < 0.10) and uMhlathuze (p < 0.01). The models predict that an additional year to the years of experience of the sampled farmers would raise the odds of household food security in both municipalities by a factor of 1. This finding implies that the more the farming experience, the higher the likelihood of a household being food secure in both municipalities. The years of farming experience of the sampled farmers also have a significant (p < 0.10) and positively affect household food security status in KCDM. The model predicts that farming experience would increase the odds of household food security status by a factor of 1. This result implies that additional farming experience would increase the chances of food security of the sampled households in KCDM.
Household members participating in farming was captured as a continuous variable. The participation of household members in farming activities is statistically significant (p < 0.05) and positively correlates with household food security status in Mthonjaneni and uMhlathuze. The models predict that the involvement of an additional household member in farming would increase the odds of household food security by a factor of 2 in Mthonjaneni and a factor of 1 in uMhlathuze. This implies that the more household members’ involvement in farming engagement, the higher the chances of the household being food secure. However, household members’ involvement in farming activities has a higher chance of influencing household food security in Mthonjaneni than in uMhlathuze. Likewise, household members’ involvement in farming activities has a significant (p < 0.05) and positive correlation with household food security in KCDM. The model predicts that household members’ involvement in farming activities would increase the odds of household food security by a factor of 1. This result implies that increased involvement of household members in farming activities would raise the chances of food security of the sampled households in the district municipality.
Gender was entered into the model as a dummy categorical variable. Results show that gender is significant (p < 0.10) and positively correlates with food security in Mthonjaneni Municipality. The model predicts that the odds of households, with a male taking responsibility of the household farming activities, would be food secure 3 times than that of households with a female taking care of the farming activities. This finding implies that households with a male responsible for farming activities stand a better chance of being food secure than households with farming responsibilities overseen by females. In contrast, the gender of the person responsible for household farming activities has no significant effect on household food security in uMhlathuze. Results also show that the gender of the person taking responsibility for household farming activities has no significant impact on household food security in KCDM.
4. Discussion
Findings from this paper reveal that CSA adaptation would increase the chances of the sampled farming households’ food security in both municipalities under investigation. This observation agrees with Wekesa et al. (Citation2018) study of CSA practices and food security in smallholder production systems in Kenya, which reveal that farmers who adopted CSA practices were at a better level of food security than non-adopters. Dooley and Chapman (Citation2014) note that a farm household would be better off with CSA adoption primarily because CSA integrates adaptation benefits, food security and mitigation benefits. Results from both municipalities suggest that mainstreaming CSA would impact the livelihood and food security status of small-scale farming households in KCDM. The findings of this study support the aim of CSA as presented by FAO (Citation2013) and Lipper et al. (Citation2014), which is the alleviation of food insecurity by enhancing resilient and sustainable systems to increase food production. Findings further reveal that CSA adaptation promises a higher chance of food security for the sampled households in Mthonjaneni than in uMhlathuze. Although on the average, 4 CSA practices were adapted for use in both Mthonjaneni and uMhlathuze, the higher chance of food security in Mthonjaneni from CSA adaptation agrees with the descriptive evidence showing more food secure households in Mthonjaneni based on HDDS, as well as the HFCS (acceptable and borderline food consumption).
Crop rotation, integrated crop-livestock management and planting of drought and heat tolerant crops were among the highly accepted CSA practices by the sampled farmers. However, findings reveal that the larger the household and the more the exposure to extension and advisory services, the higher the preference for crop rotation as a CSA practice to be adopted. Extension and advisory services expose farmers to adequate information needed for successful adoption of relevant agricultural practices. The findings on the influence of the nature of agricultural production on the preference for crop rotation suggests that crop farmers would embrace crop rotation more than their counterparts who were into mixed farming.
Results further suggest that the more the sampled farmers were educated and exposed to extension and advisory services, the more their preference for integrated crop-livestock management. This is expected as an agricultural practice that is as technical as integrated crop-livestock management would require a level of technical know how that requires a reasonable level of training or exposure to information. These findings agree with the findings of Onyeneke et al. (Citation2018) that education positively affects climate change adaptation. Education is expected to increase the capacity of farmers to obtain, process and utilize information relevant to the adoption and management of agricultural practices (Onyeneke et al., Citation2018). Wekesa et al. (Citation2018) argue that educated farmers would opt out of a CSA package if it does not offer risk reduction measures which could protect their investment against the risks of climate change. Agricultural extension services serve as a crucial source of information on climate change, climate change adaptation and resilience, as well as agricultural management practices (Onyeneke et al., Citation2018).
Results also show that farmers with large expanse of land would embrace integrated crop-livestock management more than their counterparts with smaller portions of land. Results further show that farmers with higher exposure to extension and advisory services and larger expanse of land will likely embrace the planting of drought and heat tolerant crops when compared with their counterparts with lower exposure to extension and advisory services and smaller expanse of land. It is expected that frequent contact with extension agents would brighten the chances of awareness of climate change and CSA practices that can be adopted to adapt to climate variability and shocks. Besides, farmers, through extension services, can learn climate change mitigation measures and strategies that can enhance resilience.
The household size of the sampled households in both municipalities significantly and negatively influenced food security in the area. The more populated the household is, the higher the chances of being food insecure. This result concurs with Huluka et al. (Citation2019) findings that household dietary diversity decreases with household size. A similar pattern obtains for the dependency ratio of the households. This is expected as a high dependency ratio in a household means more household members are not working than those working. Although we cannot attribute the number of non-working individuals in a household to unemployment, there is a high correlation between unemployment and high dependency ratio. A study by Ngema et al. (Citation2018) shows a positive correlation between employment and food security. Huluka et al. (Citation2019) also asserted that an increase in daily working hours would boost the chances of a household falling under a high dietary diversity category. Invariably,the more there are non-working individuals in a household, either due to unemployment or other reasons, the lower the chances of such households being food secure.
The flow of income from farming engagements or non-farming sources significantly affected both municipalities’ food security status. The result suggests that an increase in farm income and income from off-farm sources would increase the sampled farming households’ chances of being food secure. This result corroborates the findings of Jones et al. (Citation2014) and Harris-Fry et al. (Citation2015), who reported that households who supplement their income with non-farm income are more likely to diversify their diets, thereby boosting their HDDS. It also agrees with the assertion of Mark et al. (Citation2014) that an increase in the income of a household would boost the chances of such household to be food secure. It is expected that increased flow of income will increase the means or ability to purchase food, thereby strengthening households in battling food insecurity. However, the result is in contrast with the finding of Ngema et al. (Citation2018) who reported a lesser likelihood of households being food secure with increased household income.
Results from both municipalities show that household members’ involvement in farming activities has a significantly positive influence on the food security status of the households. This suggests that households with sufficient labour resources are more likely to be food secure. The probable explanation is that sufficient labour would help in the timely conduct of farming activities, resulting in high yields. This finding concurs with the submissions of Bogale and Shimelis (Citation2009) and Mango et al. (Citation2014). The household head’s farming experience also has a significant positive effect on its food security status in both municipalities. The explanation for this could be that productivity is expected to improve with an increase in years of experience, thereby enhancing the food security status of the household.
Gender emerged as a significant and positive influence on the sampled small-scale farming households’ food security status in Mthonjaneni. By contrast, it had no significant influence on the sampled farming households’ food security status in uMhlathuze. Results from Mthonjaneni municipality suggest that households with males in charge of the household farming activities could be more food secure than the ones where females are in charge. The finding is in line with Abdullah, Zhou et al. (Citation2019) report that female-headed households are more vulnerable to food insecurity than male-headed ones. This suggests that female-headed households need more attention and help to improve livelihoods and cope with food insecurity. Overall, it was found that extension contact, farm size, household size, and agricultural production were significant determinants of the choices made by sampled farmers among alternative CSA practices.
5. Conclusion and policy implications
There is a considerable gap in the literature and evidence-based adaptation and mitigation potentials of different CSA practices and technologies in terms of their impact on vulnerable groups’ food security. This paper contributes to filling the literature gap. It contributes to the evidence base by examining the effect of CSA adaptation on the household food security status in small-scale production systems. The paper deviates from the conventional approach of focusing on a single practice, but grouped practices that fit into CSA profiles based on usage and then examined the effects of the level of adaptation of practices on household food security. The study finds that household food security status in Mthonjaneni and uMhlathuze municipalities are influenced by the adaptation of CSA practices and other factors such as household size, dependency ratio in the household, farm income, income from off-farm sources, farming experience and participation of household members in farming activities, with gender as an additional determinant in Mthonjaneni.
Based on these findings, it is argued that the more small-scale farming households adopt CSA practices, the brighter their chances of being food secure. Increased uptake of CSA practices will place pressure on land and other resources such as equipment and labour. However, uptake of more CSA practices in the small-scale farming system is generally more profitable, particularly regarding food security. Given the empirical evidence obtained, this paper argues that for small-scale farmers to maximize CSA adaptation benefits and enhance food security, they need to incorporate CSA practices as much as possible. CSA has the potential to improve the alleviation of food insecurity among small-scale farming households. Small-scale farmers should be encouraged to adopt climate-smart practices and integrate as many practices as their capacity, know-how and operation can accommodate. Besides, it is expedient that more attention is given to households with females in charge of agricultural activities, female-headed households, and households with high dependency ratios.
This paper recommends that policy design and implementation be driven towards encouraging and helping small-scale farmers in engaging multiple CSA practices to improve their agricultural production. By this, farmers can fortify themselves against climate -change-related risks and enhance their households’ food security level. Secondly, given the positive influence of the involvement of the members of the sampled households on the food security status of the households, governments and organizations interested in agricultural development and other stakeholders should embark on projects that will make agriculture more attractive, particularly at the small-scale level. There is the need to do more in rebranding agriculture as a lucrative venture and not as a vocation for those without options. This intervention is essential for enhancing food security and poverty alleviation as well as agricultural and rural development in South Africa and many other African countries.
Based on the positive influence of farming experience on food security, this paper also suggests that national and local institutions should be strengthened to support ‘farmers by providing them with access to information and resources. Policymakers should use extension services for information dissemination in more attractive and productive ways, particularly concerning using evidence to adapt practices to local conditions. Also, there is the need for policies and regulations for increased coordination of agricultural, environmental and food systems. An enabling policy environment facilitated by collaborations across relevant units is needed to enhance the synergy that could usher in the desired outcome.
This paper recommends extending the research to other areas in South Africa. This will support effective decision making and make evidence widely accessible to decision-makers at the national and local levels. An extended scope into similar research will also help address technical challenges associated with the upscaling of recommendations and models that will be needed for a more appropriate decision making. Researchers can also exploit synergies from global, national and local studies for more robust and integrated findings.
Author contribution statement
Victor oluwadamilare abegunde
Conceptualization, Methodology, Data Collection and Analysis, Writing- Original draft preparation.
Melusi sibanda
Supervision, Scrutiny and Verification, Writing-Reviewing and Editing.
Ajuruchukwu obi
Supervision, Scrutiny and Verification, Writing-Reviewing and Editing.
Acknowledgements
The authors are grateful to the NRF, TWAS and the University of Zululand Research and Innovation Office. The authors also appreciate the authorities of Mthonjaneni and uMhlathuze local municipalities and King Cetshwayo district municipality. Special appreciation goes to the DARD and the farmers in Mthonjaneni and uMhlathuze local municipalities for their facilitation of and participation in the study.
Disclosure statement
No potential conflict of interest was reported by the author(s).
Additional information
Funding
Notes on contributors

Victor O. Abegunde
Victor Abegunde is a Doctoral Scholar of the World Academy of Science and National Research Foundation (NRF-TWAS) at the University of Zululand. He is an expert in Agricultural and Development Economics. His research interests are not limited to but include climate change, climate-smart agriculture, land and resource economics, food security and agricultural Sustainability. He is positively focused on efficiency, cost-effectiveness, and committed to the highest standards.
Melusi Sibanda has been a Senior Lecturer in Agribusiness and was recently promoted to the Associate Professor position at the University of Zululand, Department of Agriculture. His research interests include rural development, climate change, food and nutrition security, Information and communications technology (ICT) integration in agriculture and numerous issues impacting smallholder farming. He has also developed an interest in the economics of higher education and research in the scholarship of teaching and learning.
Ajuruchukwu Obi is Professor of Agricultural Economics at the University of Fort Hare, South Africa and Managing Editor (Africa Region) for International Food and Agribusiness Management Review. His current research includes land and resource economics, climate change, innovation systems and institutional economics. He previously worked in international technical cooperation and has consulted widely for several international development agencies.
References
- Abdullah, Zhou, D., Din, I. U., Din, I. U., Din, I. U., Din, I. U., Ilyas, A., & Ilyas, A. (2019). Factors affecting household food security in rural northern hinterland of Pakistan. Journal of the Saudi Society of Agricultural Sciences, 18(2), 201–27. https://doi.org/10.1016/j.jssas.2017.05.003
- Akhtar, D. M. I., 2016. Research design. SSRN 2862445. Elsevier. https://ssrn.com/abstract=2862445. (Accessed 23 July 2016)
- Arslan, A., McCarthy, N., Lipper, L., Asfaw, S., & Cattaneo, A. (2014). Adoption and intensity of adoption of conservation farming practices in Zambia. Agriculture, Eco-systems and Environment, 187(1), 72–86. https://doi.org/10.1016/j.agee.2013.08.017
- Belaineh, L., Yared, A., & Woldeamlak, B. (2013). Smallholder ‘farmers’ perceptions and adaptation to climate variability and climate change in Doba district, west Hararghe, Ethiopia. Asian Journal of Empirical Research, 3(3), 251–265 https://archive.aessweb.com/index.php/5004/article/view/3088
- Bergman, M. M. (2008). Advances in mixed methods research: Theories and applications. Sage Publications.
- Bernard, H. R., & Bernard, H. R. (2013). Social research methods: Qualitative and quantitative approaches. Sage Publications.
- Bogale, A., & Shimelis, A. (2009). Household level determinants of food insecurity in rural areas of Dire Dawa, Eastern Ethiopia. African Journal of Food Agriculture Nutrition and Development, 9(9), 1917–1919. https://doi.org/10.18697/ajfand.30.3740
- Connelly, L. M. (2008). Pilot studies. Medsurg Nursing, 17(6), 411–412. PMID: 19248407.
- Creswell, J. W., & Creswell, J. D. (2017). Research design: Qualitative, quantitative, and mixed methods approaches. Sage publications.
- Dooley, E., & Chapman, S. (2014). Climate-smart agriculture and REDD+ implementation in Kenya. Cambridge Centre for Climate Change Mitigation Research. University of Cambridge. Baker and McKenzie.
- FAO. (1996). Food security. Food and agriculture organization of the United Nations. 1–330. ISBN 92-5-103858-9
- FAO. (2010). Guidelines for measuring household and individual dietary diversity. Food and Agriculture Organization of the United Nations. 1–53. ISBN 978-92-5-106749-9
- FAO. (2013). Climate-smart agriculture sourcebook. Food and Agriculture Organization of the United Nations. 1–557. ISBN 978-92-5-107720-7
- FAO. (2015). Regional overview of food insecurity: African food security prospects brighter than ever. Food and Agriculture Organization of the United Nations. 1–23. ISBN 978-92-5-108781-7
- Goshu, D., Kassa, B., & Ketema, M. (2013). Measuring diet quantity and quality dimensions of food security in rural Ethiopia. Journal of Development and Agricultural Economics, 5(5), 174–185. https://doi.org/10.5897/JDAE12.141
- Green, W. (2012). Econometric Analysis. Pearson Education, Prentice Hall.
- Greg, E., Anam, B., William, M., & Duru, E. (2011). Climate change, food security and agricultural productivity in Africa: Issues and policy directions. International Journal of Humanities and Social Science, 1(21), 205–223.
- Harris-Fry, H., Azad, K., Kuddus, A., Shaha, S., Nahar, B., Hossen, M., Younes, L., Costello, A., & Fottrell, E. (2015). Socio-economic determinants of household food security and ‘ ‘women’s dietary diversity in rural Bangladesh: A cross-sectional study. Journal of Health, Population, and Nutrition, 33(2), 1–12. https://doi.org/10.1186/s41043-015-0022-0
- Hosmer, D. W., & Lemeshow, S. (2000). Applied logistic regression. John Wiley & Sons.
- Hoyle, R., Harris, J., & Judd, C. (2002). Research methods in social relations. Thomsom Learning.
- Huluka, A. T., Wondimagegnhu, B. A., & Yildiz, F. (2019). Determinants of household dietary diversity in the Yayo biosphere reserve of Ethiopia: An empirical analysis using sustainable livelihood framework. Cogent Food & Agriculture, 5(1), 1–29. https://doi.org/10.1080/23311932.2019.1690829
- IPCC, 2014. Climate change 2014: Impacts, adaptation, and vulnerability, part B regional aspects. Working group II contribution to the fifth assessment report of the intergovernmental panel on climate change. Cambridge University Press
- Jones, A. D., Shrinivas, A., & Bezner-Kerr, R. (2014). Farm production diversity is associated with greater household dietary diversity in Malawi: Findings from nationally representative data. Food Policy, 46(1), 1–12. https://doi.org/10.1016/j.foodpol.2014.02.001
- Kabubo-Mariara, J., & Kabara, M. (2015). Climate change and food security in Kenya. Environment for Development Kenya. Taylor & Francis. https://doi.org/10.4324/9781315149776-4
- Kavallari, A., 2015. How climate change may affect global food demand and supply in the long-term. Food and Agricultural Organization of the United Nations. Available: http://www.fao.org/climatechange/42904-061f6861c5c2331aa1eafe445e822d498.pdf (Accessed 5 February 2019)
- Lehohla, P. (2016). Community survey 2016. Statistics South Africa. Pretoria, South Africa: Stats SA Library.
- Lipper, L., Thornton, P., Campbell, B. M., Baedeker, T., Braimoh, A., Bwalya, M., Caron, P., Cattaneo, A., Garrity, D., Henry, K., Hottle, R., Jackson, L., Jarvis, A., Kossam, F., Mann, W., McCarthy, N., Meybeck, A., Neufeldt, H., Remington, T., … Torquebiau, E. F. (2014). Climate-smart agriculture for food security. Nature Climate Change, 4(12), 1068–1072. https://doi.org/10.1038/nclimate2437
- Lukano, L. (2013). Busia county integrated development plan, 2013–2017. Ministry of planning and county development. County Government of Busia.
- Mango, N., Zamasiya, B., Makate, C., Nyikahadzoi, K., & Siziba, S. (2014). Factors influencing household food security among smallholder farmers in the Mudzi district of Zimbabwe. Development Southern Africa, 31(4), 625–640. https://doi.org/10.1080/0376835X.2014.911694
- Mango, N., Makate, C., Mapemba, L., & Sopo, M. (2018). The role of crop diversification in improving household food security in central Malawi. Agriculture & Food Security, 7(1), 1–10. https://doi.org/10.1186/s40066-018-0160-x
- Mark, N., Coleman-Jensen, A., & Gregory, C. (2014). Prevalence of U.S. Food insecurity is related to changes in unemployment, inflation, and the price of food; ERR-167. United States Department of Agriculture (USDA).
- Mbukwa, J. (2013). A model for predicting food security status among households in developing countries. International Journal of Development and Sustainability, 2(2), 1–12. https://isdsnet.com/ijds-v2n2-8.pdf
- Moore, C. G., Carter, R. E., Nietert, P. J., & Stewart, P. W. (2011). Recommendations for planning pilot studies in clinical and translational research. Clinical and Translational Science, 4(5), 332–337. https://doi.org/10.1111/j.1752-8062.2011.00347.x
- Msangi, J. P. (2014). Food security among small-scale agricultural producers in Southern Africa. Springer International Publishing.
- Muhammad-Lawal, A., Ibrahim, H., Oloyede, W., Belewu, K., & Adesina, T. (2017). Assessment of dietary diversity and food calorie consumption among rural households in Kwara State, Nigeria. Assessment, 22(1), 134–141. https://www.futa.edu.ng/journal/papers/paper_3_1545126606.pdf
- Municipal Directory of South Africa, 2017. Kwazulu-Natal. (Accessed 18 August 2017). https://municipalities.co.za/provinces/view/4/kwazulu-natal
- Ncube, M., Madubula, N., Ngwenya, H., Zinyengere, N., Zhou, L., Francis, J., Mthunzi, T., Olivier, C., & Madzivhandila, T. (2016). Climate change, household vulnerability and smart agriculture: The case of two South African provinces. Jamba-Journal of Disaster Risk Studies, 8(2), 1–14. https://doi.org/10.4102/jamba.v8i2.182
- Nel, A. A. (2005). Crop rotation in the summer rainfall area of South Africa. South African Journal of Plant and Soil, 22(4), 274–278. https://doi.org/10.1080/02571862.2005.10634721
- Neuman, W. L., & Kreuger, L. (2003). Social work research methods: Qualitative and quantitative approaches. Allyn and Bacon, The University of California.
- Ngema, P., Sibanda, M., & Musemwa, L. (2018). Household food security status and its determinants in Maphumulo local municipality, South Africa. Sustainability, 10(9), 1–23. https://doi.org/10.3390/su10093307
- Nwajiuba, C., Emmanuel, T. N., & Bangali Solomon, F. (2015). State of knowledge on CSA in Africa: Case studies from Nigeria, Cameroun and the Democratic republic of Congo. In Forum for Agricultural Research in Africa. The Forum for Agricultural Research in Africa. ISBN 978-9988-2-3782-9
- Nyikahadzoi, K., Siziba, S., Mango, N., Mapfumo, P., Adekunhle, A., & Fatunbi, O. (2012). Creating food self reliance among the smallholder farmers of eastern Zimbabwe: Exploring the role of integrated agricultural research for development. Food Security, 4(4), 647–656. https://doi.org/10.1007/s12571-012-0218-8
- Ochieng, J., Kirimi, L., & Makau, J. (2017). Adapting to climate variability and change in rural Kenya: Farmer perceptions, strategies and climate trends. Natural Resources Forum, 41(4), 195–208. https://doi.org/10.1111/1477-8947.12111
- Odhiambo, J. J. O., & Magandini, V. N. (2008). An assessment of the use of mineral and organic fertilizers by smallholder farmers in Vhembe District, Limpopo Province, South Africa. African Journal of Agricultural Research, 3(5), 357–362. https://doi.org/10.5897/AJAR
- Onyeneke, R. U., Igberi, C. O., Uwadoka, C. O., & Aligbe, J. O. (2018). Status of climate-smart agriculture in southeast Nigeria. GeoJournal, 83(2), 333–346. https://doi.org/10.1007/s10708-017-9773-z
- Rabe-Hesketh, S., & Everitt, B. (2004). A handbook of statistical analyses using stata. Chapman and Hall/CRC.
- Statistics South Africa. (2019). National poverty lines. Statistics South Africa. Pretoria, South Africa: Stats SA Library.
- Teklewold, H., Kassie, M., Shiferaw, B., & Köhlin, G. (2013). Cropping system diversification, conservation tillage and modern seed adoption in Ethiopia: Impacts on household income, agrochemical use and demand for labor. Ecological Economics, 93(1), 85–93. https://doi.org/10.1016/j.ecolecon.2013.05.002
- Terdoo, F., & Adekola, O. (2014). Assessing the role of climate-smart agriculture in combating climate change, desertification and improving rural livelihood in Northern Nigeria. African Journal of Agricultural Research, 9(15), 1180–1191. https://doi.org/10.5897/AJAR2013.7665
- Tibesigwa, B., & Visser, M. (2015). Small-scale subsistence farming, food security, climate change and adaptation in South Africa: Male-female headed households and urban-rural nexus. National Treasury of South Africa.
- United States Agency for International Development. (2015). FFP indicators handbook part 1: Indicators for baseline and final evaluation survey. In Food and nutrition technical assistance III project (FANTA III) (pp. 1–167). Connecticut Avenue.
- Uraguchi, Z. B. (2012). Rural income transfer programs and rural household food security in Ethiopia. Journal of Asian and African Studies, 47(1), 33–51. https://doi.org/10.1177/0021909611407151
- Vermeulen, S. J. (2014). Climate change, food security and small-scale producers. Analysis of findings of the fifth assessment report (AR5) of the Intergovernmental Panel on Climate Change (IPCC). CGIAR research program on Climate Change Agriculture and Food Security (CCAFS) CGIAR Research Program on Climate Change, Agriculture and Food Security (CCAFS). https://hdl.handle.net/10568/35215
- Wekesa, B. M., Ayuya, O. I., & Lagat, J. K. (2018). Effect of climate-smart agricultural practices on household food security in smallholder production systems: Micro-level evidence from Kenya. Agriculture & Food Security, 7(1), 1–14. https://doi.org/10.1186/s40066-018-0230-0
- Wineman, A., Mason, N. M., Ochieng, J., & Kirimi, L. (2017). Weather extremes and household welfare in rural Kenya. Food Security, 9(2), 281–300. https://doi.org/10.1007/s12571-016-0645-z
- World Bank. (2015). World development indicators world bank. World Bank Group.
- World Bank. (2016). Climate smart agriculture, successes in Africa. World bank group. 1818 H street NW. World Bank Group. http://documents.worldbank.org/curated/en/622181504179504144/Climate-smart-agriculture-successes-in-Africa
- Zhou, D., Shah, T., Ali, S., Ahmad, W., Din, I. U., & Ilyas, A. (2017). Factors affecting household food security in rural northern hinterland of Pakistan. Journal of the Saudi Society of Agricultural Sciences, 18(2), 201–210. https://doi.org/10.1016/j.jssas.2017.05.003
- Žukauskas, P., Vveinhardt, J., & Andriukaitienė, R. (2018). Philosophy and Paradigm of Scientific Research . Management Culture and Corporate Social Responsibility. InTech, 121–140.