
Abstract
Traditional craft villages are becoming more popular as cultural tourism destinations since they preserve and represent indigenous people’s culture and lifestyles while also contributing significantly to the economy. Along with the current surge in visitors, traditional villages must improve service quality components to strengthen their attractiveness and competitiveness. To analyze the quality of tourism services given by the places, the study was done in Da Nang, a city in Vietnam’s central region with various unique traditional craft villages. In this study, the research paradigm “Importance—Performance Analysis” (IPA) was used and converted with “SERVQUAL.” A total of 120 tourists who had previously visited Da Nang’s traditional craft villages were surveyed. The findings suggest that tourists place a high value on indices showing the importance of tourism service quality, but they undervalue performance. Overall, the article advises and proposes four group solutions based on priority levels in order to improve and further expand the quality of services in traditional craft villages in Da Nang city.
1. Introduction
Traditional craft villages are considered as cultural tourism attractions, which involve tourists being led through cultural experiences such as learning about local cultural elements, local wisdom in tourist destinations, studying historical sites, museums, studying the representation of values and living systems adopted by local communities, performing arts, and local culinary specialties (Nugraha & Lema, Citation2021). Traditional craft villages are increasingly reaffirming their relevance in conserving cultural values (Bahaa Eldin & Hammad, Citation2020), contributing to the establishment of regional cultural identity, and reflecting prominently diversity of rural and traditional life, as cultural tourism grows in popularity (Xue et al., Citation2021). Traditional crafts have been promoted in several nations in recent years to overcome obstacles in making and selling traditional handicraft products, particularly in export markets. A tourism village provides a natural setting with its own social, cultural, and customs, as well as lodging, food, and other tourist necessities. The establishment of a tourism village alters the lives of its residents. Expanding the tourism business without fostering traditional handicraft will be detrimental to the national economy (Hieu & Rasovska, Citation2017). Many traditional craft villages have become popular tourist destinations, and craft village tourism is viewed as an essential direction for improving the diversity and competitiveness of tourism products (Pham Hong et al., Citation2021), as well as promoting the image of countries and territories in the global tourism market (Phuc & Linh, Citation2019).
Service quality (SQ) plays an important role in tourism development, and SQ improvement is one strategy that many tourist destinations are currently using in order to increase their competitiveness in international tourist markets (López-Toro et al., Citation2010). Many researchers have examined at SQ as a precondition for corporate excellence and strategies (Arambewela & Hall, Citation2006; Ruiqi & Adrian, Citation2009). Prior studies have also shown that the quality of service impacts on the quality of business performance (Caruana & Pitt, Citation1997). SQ, according to Berry et al. (Citation1988), is an important market differentiator and a formidable competitive weapon that all service firms should aspire to (Berry et al., Citation1988). SQ as a metric for measuring business excellence is becoming increasingly popular, not just in corporate practice, but also in academia (Jankalová, Citation2016). In tourism industry sector, SQ is a necessary and winning strategy for the new millennium (Augustyn & Ho, Citation1998). In addition, SQ strongly influenced the tourist’ satisfaction. Better SQ leads to greater customer satisfaction (Kasiri et al., Citation2017; Sivadas & Baker-Prewitt, Citation2000), and SQ, with customer satisfaction, influences customer loyalty (Cristobal et al., Citation2007; T.-H. Lee, Citation2009; Y.-K. Lee et al., Citation2005; Özkan et al., Citation2019; Puri et al., Citation2018; Santouridis & Trivellas, Citation2010). Loyal and committed long-term clients, as opposed to short-term customers, have a much greater inclination to buy more services, generate positive word-of-mouth communication, pay higher rates, and, smooth the entire service process due to the experience curve (Sugandini et al., Citation2017). With such a significant impact on customer happiness and loyalty, it is critical to improve the quality of tourism services to boost visitor satisfaction and increasing the probability of recruiting tourists.
According to the further literature, the evaluation of tourism service quality (TSQ) will provide management with a foundation on which to improve the destination’s quality. However, assessment of TSQ is complicated since it is predicated on how the traveler feels. Many studies and various evaluation models have focused on the quality assessment of tourism services. In which, the SERVQUAL scale, established by Parasuraman et al., is the most widely used measure of SQ (Asubonteng et al., Citation1996). On the other hands, many studies measure the quality of tourism services using a combination of other models, such as the Systematic Literature Review and Keyword Network Analysis (Park & Jeong, Citation2019); the seconded confirmatory factor analysis (Narayan et al., Citation2008); fuzzy gap analysis (Ho et al., Citation2015), and a Grey Correlation Analysis (Ho et al., Citation2015) etc. These studies also confirm the wide range of elements that influence the quality of tourism services and the importance of developing an appropriate assessment model for individual destinations. Despite these significant advancements in a destination’s TSQ assessment, there have been very few studies analyzing visitor satisfaction based on an assessment of the importance and performance of TSQ in traditional villages. The evaluation of SQ in craft villages will add to the theory of evaluation for cultural destinations while also fostering the growth of craft village tourism. Therefore, this paper focuses on examining a system of evaluation criteria by comparing the importance—the performance of TSQ indicators in particularly in Da Nang city, where a growing number of traditional craft villages are being utilized for tourism development. The goal of the article was to: (1) identify the TSQ indicators that visitors care about; (2) examine the perceived gaps in the roles that TSQ plays; and (3) identify the attribute role that requires management intervention to improve visitor satisfaction in traditional villages in Da Nang city.
To achieve these goals, the article is organized in the following way. The first section provides literature review, background information about the research model in which the current study was conducted, as well as a statement of the specific research topic. In section 2, we’ll go through how to use SERVQUAL and the IPA model for data collection on questionnaire surveys, as well as how to discuss them. Finally, there are conclusions for the TSQ.
2. Literature review
2.1. Cultural tourism and traditional craft villages
Cultural tourism is a paradox from several perspectives, and is now the most popular form of special interest tourism (Brooker, Citation2016; Buhalis et al., Citation2006). Some researchers defined cultural tourism as a tourism market for those who choose to travel according to their lifestyle or intelligent tourism-tourism linked to the increasing desire of tourists to learn something new while traveling: this makes it a form of educational-cultural tourism (Richards & Richards, Citation1996). Cultural tourism is a significant topic in leisure history and sociology, and it is related to cultural geography and studies of cultural motilities, cultural identities, and the link between societies at various stages of development. Cultural tourism, according to some authors, encompasses both urban and rural tourism (Brooker, Citation2016; Raţă, Citation2013). Cultural tourism is a sub-category of tourism that relates to forms of culture in the urban and rural areas of a region or country, and it is defined as a movement of people to cultural sites far from their usual place of residence in order to absorb knowledge and cultural experiences (González Santa-Cruz & López-Guzmán, Citation2017). Tourist interested in culture may seek exposure to local behaviors and attractions, to different ways of life or vestiges of vanishing lifestyle. With heritages, the term “heritage and cultural tourism’ refers to that segment of the tourism industry that places special emphasis on heritage and cultural attractions. In less developed areas, heritage and cultural attractions may include traditional religious practices, handicrafts and cultural performance (Leslie & Sigala, Citation2005). ACTARC defines the resources involved in cultural tourism as: a) archaeological sites and museums; b) architecture (ruins, famous buildings, whole towns); c) art, sculpture, crafts, galleries, festivals, events; d) music and dance (classical, folk, contemporary); e) drama (theatre, films, dramatists); f) language and literature study, tours, events; g) religious festivals, pilgrimages; i) complete (folk or primitive) cultures and sub-cultures (Cristobal-Fransi et al., Citation2020). From this perspective, traditional craft villages are crucial resources and a significant part of cultural tourism.
Traditional craft villages, which offer a wide range of cultural potential, are relatively additional tourist attractions that have opened up opportunities for cultural and historical tourism growth. Traditional craft villages, according to B. V. Vuong, are centers of craft production with master artisans and many traditional craft households, as well as the same craft progenitor and production management rules to keep and inherit professional secrecy to cooperate in producing and selling their products in small and medium scale (in (Hieu & Rasovska, Citation2017)). Many studies on cultural tourism and community-based tourism in craft villages highlight the unique role of traditional craft villages in raising tourists’ awareness and understanding of local community cultural values, contributing to the preservation of historical and cultural values, and achieving sustainable tourism development goals (Bahaa Eldin & Hammad, Citation2020; Hieu & Rasovska, Citation2017; Mokoena, Citation2020; Moswete et al., Citation2015; Pham Hong et al., Citation2021; Zeppel, Citation2002). Based on the above, recommendations are that local people should be encouraged to take part actively in development and to establish a community-based cultural village for tourists, from which they can get actual benefits (Moswete et al., Citation2015).
2.2. Tourism service quality and tourist satisfaction
In tourism, SQ plays a significant role in enhancing tourist satisfaction (Al-Ababneh, Citation2013). TSQ is defined as the suitable service offered by travel service providers to meet the needs of tourists, or the discrepancy between visitors’ perceptions and expectations of the specific travel services provided by the travel provider (Bhat, Citation2012). The TSQ includes tour guide services, infrastructure or transportation accessibility, and tourist attractions such as products and accommodation (Rahmiati et al., Citation2020). Quality is created in tourism by providing exceptional services in terms of hospitality, courtesy, efficient lodging, food, and recreation facilities (Gallarza et al., Citation2016). SQ directly affected tourist satisfaction throughout destination facilities, destination accessibility and destination attraction (Al-Ababneh, Citation2013). Particularly, there is a significant relationship between accommodation SQ, hospitality, entertainment, transportation, taxi SQ and overall satisfaction (Latiff & Imm, Citation2015). Therefore, continuously improving the quality of tourism services is one of the most essential ways to boost visitor happiness (Madar, Citation2019).
2.3. Measure tourism service quality
Customer expectations before consumption and consumer experience after consumption are the foundations of SQ performance (Hill, Citation1986). Customers’ SQ expectations were investigated by Parasuraman, who concluded that the variations between customers’ expectations and actual experiences are due to service providers’ capacity to meet consumer expectations. SQ, according to Zeithaml (Citation1988), is a cognitive quality of a product or service. The quality of a service is derived from the quality of a physical product (Parasuraman et al., Citation1994; Zeithaml, Citation1988). Service features are undetectable when compared to physical objects, and production and sale occur at the same time (Gabbott & Hogg, Citation1994). Customers take part in co-production as service is provided, (Parasuraman et al., Citation1985) established customer views of SQ systems and proposed the notion of the SQ model. These perceptions are based on the disparity between customer service expectations and experienced service. There were ten SQ dimensions identified. These factors account for the difference between what clients expect and what they get. In addition, SQ dimensions assess the link between different SQ models. In 1985, (latitude and longitude on the continentin (Dawson et al., Citation2020) simplified SQ measurement. The 10 dimensions were whittled down to just five. They also created the SERVQUAL model, which comprises 22 SQ components and their dimensions: tangible, dependability, responsiveness, assurance, and empathy. SERVQUAL, which was first introduced in 1988 by Parasuraman et al. as a technique of measuring SQ, today has a wide range of applications in service science.
Following the proposal by Parasuraman et al. (Citation1985) to examine the performance of a service mode, subject SQ measurement has become a developing trend, gaining both academic and practical interest. Customer expectations before consumption and consumer experience after consumption are the foundations of SQ performance (Johnson & Mathews, Citation1997). The SERVQUAL scale, established by Parasuraman et al., is the most widely used measure of SQ (Wong Ooi Mei et al., Citation1999).
With the SERVQUAL scale, Importance-Performance Analysis (IPA) expanded TSQ in particular. Martilla and James (Citation1977) proposed IPA beside the SERVQUAL SQ model (Martilla & James, Citation1977). This analysis tool is frequently used to assess SQ. The IPA method is a performance evaluation technique that measures the level of service variables between importance and satisfaction in the service innovation process, according to (Esmailpour et al., Citation2020). According to (Lo et al., Citation2012), the IPA method assesses consumer importance and enjoyment, and generates unique product relationships based on technological priorities.
IPA is a paradigm that assesses the quality of tourism services based on differences in visitor perceptions of the importance and service provider performance (I—P gaps). The IPA is calculated by comparing two criteria for the quality of tourism services. Specifically, the relative relevance of quality attributes and quality attribute performance. According to a study by (Barsky, Citation1995), the achievement of the results of implementing of TSQ should be compared to their importance, and low-importance quality features have a minimal impact on visitors’ overall perception. If the quality trait is extremely important to them, it will have a significant impact on their perception. IPA also allows the researcher to calculate the properties of the sample based on the average values (Mean). Each of the derived attribute values will be represented on the 04 zone graph on this basis. The IPA is represented graphically on a grid divided into four quadrants, as shown in .
Figure 1. IPA model.(Source: Martilla & James, Citation1977).
Its findings will show the priority order of quality qualities so that actions may be taken to improve them. shows the four quadrants of IPA and their implications.
Table 1. Quadrant and implication of IPA
3. Research area and methods
3.1. Research area
The study was carried out in Da Nang city in Vietnam (). The city has a total natural land area of 1,283.42 km2, with urban districts covering 241.51 km2 and rural districts covering 1,041.91 km2. On the East Sea, Da Nang city comprises of a land area and an archipelago. Its latitude and longitude on the continent are 15 55’ to 1614’ N and 10718’ to 10820’ E, respectively (Da Nang E-Portal, Citation2022).
Figure 2. Location of Da Nang city, Vietnam.
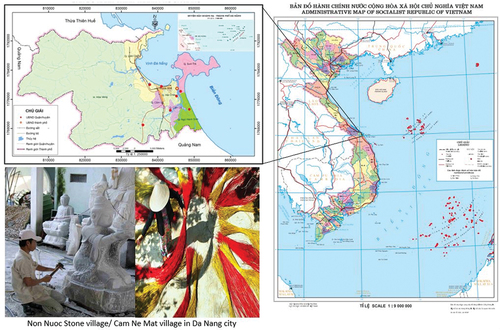
Da Nang city is located in Vietnam’s central region that connects three UNESCO World Heritage sites such as Hue Citadel, Hoi An Ancient Town, and My Son Sanctuary. The city offers many advantages for developing a wide range of types and goods. The system of charming traditional villages, such as Non Nuoc Stone Village, Nam O Chili Village, Cam Ne Village, and others, is one of the locality’s advantages. These traditional villages are not only popular tourist destinations, but they also hold a wealth of cultural and historical significance, representing local people’s social lives over millennia. Tourists and travel companies have paid close attention to craft village tourism in recent years, adding to the diversification of tourism products in the city. Thousands of visitors, especially international tourists, are welcomed each year (Da Nang Office of Tourism, Citation2020), thanks to the efforts of local governments to invest in infrastructure and services ().
Figure 3. The numbers of international tourists visiting to Da Nang annually.
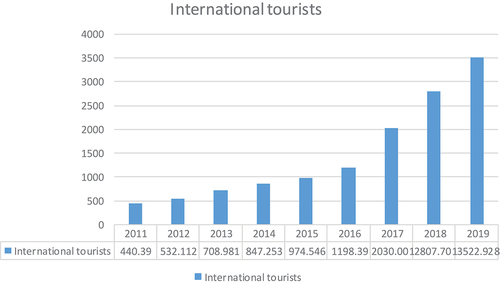
The indicates that the number of international visitors coming to Da Nang city has accelerated. In 2019, international tourists to Da Nang totaled 3.5 million, increasing 22.5 percent from the same period last year and accounting for 40.7 percent of all arrivals. The city has developed a variety of initiatives showcasing local craft villages and their products via the internet and at tourism events, realizing the value of craft village tourism.
However, the truth of tourism development in Da Nang in recent years also reveals that the level of tourism services in these traditional artisan communities remains uniform, and that investment remains dispersed and inefficient. Although the products of traditional villages are of high quality, their competitiveness is moderate, and only a few have achieved national and worldwide recognition. Many municipalities have failed to establish adequate methods and rules for the development of craft villages, and have placed little emphasis on tourism-related infrastructure and services. In addition, craft products will face fierce competition in the next years as a result of globalization and worldwide integration (Da Nang Office of Tourism, Citation2020); thus, villages must constantly improve the quality of tourism service, build their own unique products in order to become well-known brands.
3.2. Research methods
The goal of this study was to look into the quality of service in a village, a major tourist attraction in Da Nang city, Vietnam. This will point the way toward bettering the catering industry and, as a result, improving TSQ. As a questionnaire survey, this uses IPA and the SERVQUAL scale created by Parasuraman et al. (1988) with five SERVQUAL dimensions. SERVQUAL’s five dimensions were used and transformed to change the questionnaire. Tangibles, responsiveness, reliability, assurance, and empathy are the dimensions. In contrast to past research, on the third level, there are 23 variables encoded as Q1-Q23 into Tangibles, responsiveness, reliability, assurance, and empathy (Table ). A discussion with five professionals with at least three years of experience working in the tourism business in Da Nang is used to review and adapt the indicators and questionnaire to verify the questionnaire’s reliability and validity. Based on this, a preliminary questionnaire was created and evaluated with twenty tourists. After revising and re-designing, the official questionnaire research is certified. Its findings will show the priority order of quality qualities so that actions may be taken to improve them. depicts the research method.
Figure 4. Research process.
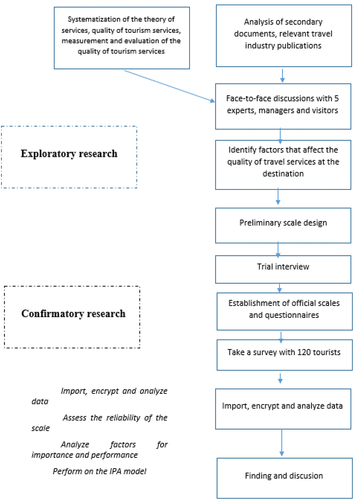
Table 2. Demographic characteristics of respondents in Da Nang’s traditional craft villages
Table 3. Cronbach Alpha and corrected item-total correlation
A survey was done to determine the elements that influence the quality of tourism service provided by popular traditional craft village in Da Nang city. To measure TSQ, the researchers employed a questionnaire survey approach. The rating system is based on the Likert five-point scale, which has five scales: agree strongly, agree, neutral, disagree, disagree strongly, and disagree strongly, with 5 points, 4 points, 3 points, 2 points, and 1 point. The study divided into 5 scales with each interval having a value of 0.8 to evaluate the mean value at both the importance and the performance of the criterion on this basis. Higher scores indicate a higher level of capability or involvement in the particular dimension, whereas lower points show a lesser level of capability or involvement. By being asked to measure the elements affecting the TSQ in Da Nang city, a random sampling approach was adopted. 150 visitors to the village were included in the sample. Finally, we received 120 questionnaires with complete answers, meeting the research object criterion with an 80 percent yield rate. shows the demographic characteristics of the respondents.
4. Finding and discussion
4.1. Testing the reliability of the scale of criteria for TSQ in traditional craft villages
Cronbach’s alpha coefficient aids in ensuring uniformity of essential elements in each dimension. According to Byrne (Citation1994), a Cronbach’s alpha coefficient of over 0.7, and Corrected Item-Total Correlation over 0.3 implies reliable reliability. Cronbach’s alpha coefficient is above 0.7 in the reliability analysis of the studied model, and important elements of each dimension conform to the content, indicating that the results are reliable. shows the testing of Cronbach alpha and Corrected Item-Total Correlation for SQ measurement criteria.
The reliability assessment of the importance scale in the reveals that the general scales and the component scale both have Cronbach’s Alpha coefficients greater than 0.7, and the coefficient of correlation turns the total greater than 0.3, indicating that these scales meet the standard for carrying out KMO inspection steps.
The Exploratory Factor Analysis (EFA) is evaluated using a KMO (Kaiser-Meyer-Olkin) coefficient. KMO is used to assess the suitability of factor analysis. A KMO value greater than 1.0 is appropriate for factor analysis, while if it is less than 0.5, the factor analysis is likely to be inconsistent with the data. Variables having transmission factors less than 0.5 will be excluded, with the process halting when Eigenvalue exceeds 1.0 and the total disparity exceeds 50%. (Gerbing & Anderson, Citation1988). The result of KMO is shown in .
Table 4. KMO and bartlett’s test
demonstrates that KMO = 0.854 < 1 and > 0.5, factor analysis is acceptable with the research dataset. Eigenvalue = 1.029 > 1 and extracts 5 groups of components that provide the best information summary. Total margin of error = 73,565 percent shows that the EFA model is adequate. Thus, the five factors accounted for 73,565 percent of the variation observed.
The rotation matrix (Table ) reveals that the groups of factors have not altered since the initial model, including group (1): Q1-Q6, group (2): Q15-Q19, group (3): Q11-Q14, group (4): Q20-Q23, and group (5): Q7—Q10. Table also reveals the impact values of these factors on the individual group. In particularly, the factors coded as Q5 and Q3 have the highest effect value in the group of tangible factors (with .746 and.744 respectively); Q18 and Q19 are among the assurance elements (respectively .791 and .786). Q20 and Q22 are the variables in the empathy factor group with the highest impact value (.842 and .822). Q12 and Q13 have the highest effect values (.852 and.844) in the group of attitudes and responsibilities. Finally, in the group of reliability variables, variables like Q9 and Q10 have the biggest impact in the group, with.792 and.699 respectively. When compared to the original model, the EFA test revealed that majority of the components converged. According to the model, these variables will be examined thoroughly. These factors will be analyzed according to the IPA model to find out the importance and implementation level of TSQ in craft villages in Da Nang city.
Table 5. Rotated component matrix
4.2. The importance and performing TSQ
In this study, the IPA model was used to clarify tourists’ views on the importance and performance of criteria for measuring the quality of tourism services in Da Nang’s traditional craft villages. The results of this are shown in .
above shows the ranking of the importance (I)-performance (P) level and the gap value (P-I) based on the mean scores.
Table 6. Importance—performance analysis for TSQ in Da Nang’ traditional craft villages
For importance level, the table reveals that the means of the components in the TSQ are largely in the “Important” and “Very important” categories, with 14 and 9 criteria respectively. This indicates that tourists in Da Nang’s traditional villages place a high value on quality standards for tourism services. This also can be explained as visitors who visit always expect to receive high-quality tourism services when they arrive at their locations. As a result, they regard the value of these aspects as high (Otto & Ritchie, Citation1996).
The most valued importance criterion according to the responses is Q16 (Food safety) with a mean of 4.53, followed by “Property safety” criteria (Q15 with 4.45). It is clear that the safety component is given the highest priority in visitor evaluations (Tasci & Boylu, Citation2010). When taking part in events, visitors are continually emphasizing the necessity of protecting the safety of both property and food. In reality, prior studies on the quality of tourism services have confirmed safety characteristics that are always highly recommended by tourists. Pizam et al. (Citation1997) claimed that most tourist select their destinations not only on the basis of price and destination image, but most importantly, on personal safety and security. According to the findings of Dwyer et al. (Citation2009), safety and security are among the fundamental requirements for the success of tourism development at the destination level. Related to food safety issues, Maclaurin (Citation2004) indicates that food safety was of secondary importance to respondents with frequent travelers more willing to discount the use of food safety in their travel decisions. Impraim et al. (Citation2018) highlights that customers of the chosen restaurants were extremely happy with how strictly the restaurants adhered to food safety standards. Therefore, the study also makes the suggestion that restaurants in tourism cities should encourage their staff members to engage in professional training programs in order to gain more knowledge for the goal of implementing food safety in the restaurant industry. The safety of a location is generally a major consideration when choosing a travel destination and is a significant aspect to consider when evaluating the caliber of tourist services.
Characteristics related to employee such as Q17 (Service style), Q18 (Knowledgeable staff), and Q13 (Assistant response) are also important, according to the above table, with scores ranging from 4.28 to 4.43. This finding continues to support the crucial part that human resources play in determining the caliber of tourist services, and it is in line with many ideas put up in earlier research. The attitude and capacity of personnel in business services are vital in providing services and generating a direct impression on visitors (Dhar, Citation2015). Tourists will receive excellent service from service providers who are well-trained and have a positive attitude. In contrast, tourists will receive poor treatment, harming the reputation of craft communities. Acording to Kusluvan (Citation2003), employee attitudes and behavior are crucial for organizational success in service organizations in general and the tourism and hospitality industries in particular. The service attitude of the staff has a large impact on visitor satisfaction, while timely assistance from the staff to solve problems that arise during the trip brings a lot of sympathy from visitors (Alhelalat et al., Citation2017). As a result, when visiting tourist destinations, tourists frequently have high expectations for staff-related characteristics.
In important assessment, there are three criteria in the group with the lowest value in the importance of assessment, two of which are in the group of “empathy” factors, including Q20 with a mean of 3.98 and Q21 with a mean of 3.98. According to Tucker (Citation2016), empathy in tourism has both positive and risks effects (Tucker, Citation2016). In their research, Yim King Wan and Man Cheng (Citation2011) also show that empathy is an element that needs to be improved in service quality at world heritage sites which including traditional villages (Yim King Wan & Man Cheng, Citation2011). In the study of traditional villages in Da Nang city, because most tourists prefer privacy when self-organizing, the factor of “empathy” is less valued than other factors. For tourists traveling on tour or on business trip, the tour guide has provided the information related to the destination. Because the foregoing information has been researched in preparation or provided by the travel agency in the guided tour, the information about the destination (Q7) is of little interest.
For performance level, the table findings reveal that the average value ranged from 3.51 to 4.83 for execution, with most of the criteria that tourists evaluate at the “High” level. This shows that the elements associated with the quality of tourism services in Da Nang city’s traditional craft villages have not yet matched tourist expectations, and that numerous constraints must be overcome and improved. There are three “high” criteria: Q11 (Attentiveness), Q9 (Village resources), and Q10 (Deep understanding). Employees are also related to factors with a high value, such as Q12 (Enthusiasm attitude), Q14 (Gentle attitude), and Q19 (Presentation skills), which have an average value of 4.54 to 4.79. The implementation’s lowest value factors are Q2 (Public toilets), Q20 (Attention), and Q21 (Awareness). This is because public restrooms in craft villages have yet to be invested in and are therefore unresponsive to customers (Da Nang Office of Tourism, Citation2020).
Only five components, Q9, Q10, Q14, Q11, Q12, and Q19, have a positive P-I coefficient (+) at the performance level. The common thread running through these five criteria is that the importance is high, yet the level of implementation is high to very high, owing to the attitude and professionalism of the workers at the artisan village tourism sites. Resources and indigenous communities are also present. It is undeniable that a positive first impression created by the staff’s attitude and professionalism is a critical aspect in improving the image and happiness of visitors.
For the gap P-I in assessment of TSQ, the table above also shows the difference between importance and performance through the P-I coefficient. Most indicators with P-I coefficients have negative values (-), ranging from −0.1 to −0.73. This means that the performance level of most of the TSQ factors is less compared to the importance level. Based on the results in the table and figure above, it can be seen that, while visitors place a high value on the TSQ qualities (ranging from 3.98 to 4.21), most of the criteria perform similarly is lower, ranging from 3.51 to 3.95.
In which, the P-I coefficient with the highest negative value is Q16 (food safety; −0.73), followed by the factor Q2 (Public toilets; −0.67). As analyzed, visitors rank these two criteria highly, yet the quality of implementation is low, resulting in a high negative value for the P-I coefficient. The P-I difference < 0 indicates that several indices of TSQ in traditional artisan villages in Da Nang have not yet satisfied the expectations and expectations of tourists, according to Barsky (Citation1995). Customers’ food safety is not guaranteed due to a variety of factors. In fact, many of the restaurants and food and beverage establishments that have opened in the artisan village’s core areas are still small and lack the equipment to ensure food safety and hygiene (with a hygienic area). Separate, there is a clean eating space, the crew does not use gloves when preparing, and so on). Food traders, mostly, do not know where their products come from and buy them from traditional markets. When clients eat at these establishments, they feel psychologically insecure. Besides, as mentioned, the toilet system has not yet ensured the hygiene factors.
4.3. Priority level of tourism service quality
This study, based on the IPA model, demonstrates the priority of TSQ based on examining the importance and implementation of TSQ criteria ().
Figure 5. IPA graph.
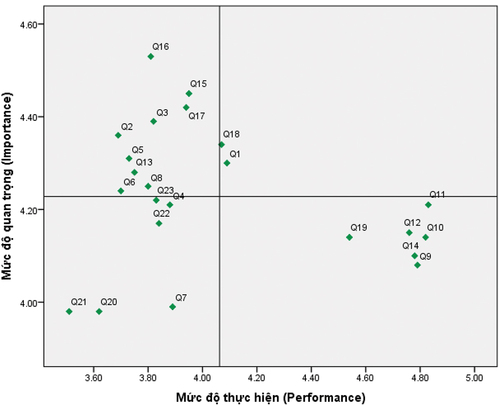
The illustrate IPA graph with four zones with differing degrees of development emphasis. Detailed list is shown below.
- Quadrant I (Concentrate Here): includes with Q2 (Public toilets), Q3 (Exhibitions), Q5 (Exhibition room), Q6 (Documents), Q8 (Display model), Q13 (Problem solving ability), Q15 (Property safety), Q16 (Food safety), and Q17 (Style serving). Tourists consider the factors allocated in this quadrant to be very important, but their application in craft villages is still lacking. These are tangible features, particularly the channels of items presented in artisan villages, which are still limited and boring. The aspects of visitor safety and fast resolution of questions, as examined, are also factors that need to be improved. As a result, the villages must devise ways to encourage investment, with an emphasis on increasing the SQ of these aspects.
- Quadrant II (Keep up good work): comprises of 2 attributes: Q1 (Village landscape) and Q18 (Service process). Tourists consider these qualities to be vital, and the artisan village has done a good job of implementing them. The graph, however, also reveals that these elements are close to quadrant I. As a result, the villages must maintain and promote these assets while also investing in their improvement.
- Quadrant III: (Lower priority): consists of 6 elements: Q4 (Costume), Q7 (Destination information), Q20 (Attention), Q21 (Awareness), Q22 (Sympathy), Q23 (Favorable pick-up time). Tourists do not place a great value on these features, and the level of implementation in craft villages is still modest. As a result, artisan communities do not need to pay too much attention to these factors and should limit their resource utilization. However, the components Q4, Q22, and Q23, based on the graph and reality, are asymptotically near to the value of quadrant (I) and play a key role in determining the quality of pre-tax profit.
- Quadrant IV: (Possible overkill): comprises of 6 factors: Q9 (Resources), Q10 (Deep understanding), Q11 (Attentiveness behavior), Q12 (Enthusiastic attitude), Q14 (Gentle attitude) and Q19 (Presentation skills). Tourists consider these characteristics to be of minor importance, but the craft village’s implementation is excellent. The village management board should put this resource to better use by concentrating on other qualities.
5. Conclusion and recommendations
The study depicts the situation and factors influencing the quality of services in Da Nang’s traditional craft villages. The findings revealed disparities in opinions of the importance and degrees of performance of tourism quality assessment criteria among 120 tourists who visited the craft villages. Tourists value most of the important requirements because they have always expected high-quality services when visiting traditional craft villages. However, despite their relevance, the above criteria’s performance is mostly lower than the importance levels. The study also shows the significance of human-related elements in evaluating tourism services in traditional craft villages. Employee-related factors such as friendly attitudes, prompt assistance, and the ability to serve politely are highly regarded and practical. On the other side, aspects related to safety, such as factors insuring the property’s safety and food safety, are highly valued. The number of these factors is highest in four areas, indicating that the quality of tourism services in artisan villages should be enhanced in many areas.
In terms of theoretical contributions, the study proposes a set of 23 criteria for evaluating the quality of tourism services in traditional artisan communities. These criteria are based on the unique characteristics of traditional craft villages in comparison to other cultural attractions, and they ensure the continuation of the evaluation criteria developed by Parasuraman et al. (Citation1985) for the evaluation of service quality in general. The evaluation criteria system, as well as the evaluation process in traditional villages in Da Nang city based on the operation of quantitative models such as IPA and SERVERQUAL, can be considered a suggestion to apply in other traditional craft villages, given that research on service quality assessment in handicraft villages has received little attention.
Based on the research results, the article proposes some following recommendations to further improve the quality of tourism services in craft villages.
- It is necessary to focus on investing in the public infrastructure system, such as toilets, galleries, information display, etc. Furthermore, the safety of both the food and the property for guests requires extra consideration. Craft village managements must take steps to maintain security and order in tourism operations, including improving inspection and monitoring of food safety and hygiene activities, and responding quickly to situations of tourists being injured;
- The issues about employee should to be contemplated. To strengthen the professional abilities of the staff, vocational training classes should be provided to artisans in the village. And to guide and train local communities to participate in activities, it is required to design a strategy and organize training; The village management board should collaborate with the local community to protect and preserve the craft village’s historic values and landscapes, which visitors respect for their execution;
- In order to introduce craft communities, the managements should use a variety of materials. This can be accomplished by collaborating with local organizations, departments, and university libraries to provide more scientific and trustworthy papers. Concurrently, create more eBook’s, banners, or a system of welcoming and easily visible reading cabinets in the region to access the craft village’s products and services to make it easier for people to access these information channels;
- Annual surveys and evaluations of tourists’ satisfaction with the quality of tourism services in traditional craft villages should be conducted by the local administration; The village management should use a variety of modern evaluation methodologies to alter and build solutions in response to guest comments to fix problems linked to SQ./.
Disclosure statement
No potential conflict of interest was reported by the author(s).
Additional information
Funding
References
- Al-Ababneh, M. M. (2013). Service quality and its impact on tourist satisfaction (SSRN Scholarly Paper No. 3633075). Social Science Research Network. https://papers.ssrn.com/abstract=3633075
- Alhelalat, J. A., Habiballah, M. A., & Twaissi, N. M. (2017). The impact of personal and functional aspects of restaurant employee service behaviour on customer satisfaction. International Journal of Hospitality Management, 66(2017), 46–19. https://doi.org/10.1016/j.ijhm.2017.07.001
- Arambewela, R., & Hall, J. (2006). A comparative analysis of international education satisfaction using servqual. Journal of Services Research, 6(Special), 141–163. https://www.researchgate.net/profile/Rodney-Arambewela/publication/225083722_A_comparative_analysis_of_international_education_satisfaction_using_SERVQUAL/links/00b7d53c39782a90ac000000/A-comparative-analysis-of-international-education-satisfaction-using-SERVQUAL.pdf
- Asubonteng, P., McCleary, K. J., & Swan, J. E. (1996). SERVQUAL revisited: A critical review of service quality. Journal of Services Marketing, 10(6), 62–81. https://doi.org/10.1108/08876049610148602
- Augustyn, M., & Ho, S. K. (1998). Service quality and tourism. Journal of Travel Research, 37(1), 71–75. https://doi.org/10.1177/004728759803700110
- Bahaa Eldin, R. M., & Hammad, A. A. (2020). Marketing Egyptian crafts villages for preserving the cultural heritage. International Journal of Heritage, Tourism and Hospitality, 14(3), 251–269. https://ijhth.journals.ekb.eg/article_153623_4a140655778447a1d1e9c4b53e1e11c9.pdf
- Barsky, J. D. (1995). World-class customer satisfaction. Irwin Professional Pub.
- Berry, L. L., Parasuraman, A., & Zeithaml, V. A. (1988). The service-quality puzzle. Business Horizons, 31(5), 35–43. https://doi.org/10.1016/0007-6813(88)90053-5
- Bhat, M. A. (2012). Tourism service quality: a dimension-specific assessment of SERVQUAL*. Global Business Review, 13(2), 327–337. https://journals.sagepub.com/doi/10.1177/097215091201300210
- Brooker, P. (2016). A glossary of literary and cultural theory (3rd ed.). Routledge. https://doi.org/10.4324/9781315666327
- Buhalis, D., Costa, C., & Ford, F. (2006). Tourism business frontiers. Routledge.
- Byrne, B. M. (1994). Burnout: testing for the validity, replication, and invariance of causal structure across elementary, intermediate, and secondary teachers. American Educational Research Journal, 31(3), 645–673. https://doi.org/10.3102/00028312031003645
- Caruana, A., & Pitt, L. (1997). INTQUAL ‐ an internal measure of service quality and the link between service quality and business performance. European Journal of Marketing, 31(8), 604–616. https://doi.org/10.1108/03090569710176600
- Cristobal, E., Flavián, C., & Guinalíu, M. (2007). Perceived e‐service quality (PeSQ): measurement validation and effects on consumer satisfaction and web site loyalty. Managing Service Quality: An International Journal, 17(3), 317–340. https://doi.org/10.1108/09604520710744326
- Cristobal-Fransi, E., Daries, N., Ferrer-Rosell, B., Marine-Roig, E., & Martin-Fuentes, E. (2020). Sustainable tourism marketing. MDPI.
- Da Nang Office of Tourism. (2020). Annual tourism activity report, 2011-2020.
- Dawson, J., Findlay, A., & Sparks, L. (2020). The Retailing Reader. Routledge.
- Dhar, R. L. (2015). Service quality and the training of employees: The mediating role of organizational commitment. Tourism Management, 46, 419–430. https://doi.org/10.1016/j.tourman.2014.08.001
- Dwyer, L., Edwards, D., Mistilis, N., Roman, C., & Scott, N. (2009). Destination and enterprise management for a tourism future. Tourism Management, 30(1), 63–74. https://doi.org/10.1016/j.tourman.2008.04.002
- Esmailpour, J., Aghabayk, K., Abrari Vajari, M., & Gruyter, C. (2020). Importance – Performance Analysis (IPA) of bus service attributes: A case study in a developing country. Transportation Research Part A: Policy and Practice, 142, 129–150. https://doi.org/10.1016/j.tra.2020.10.020
- Gabbott, M., & Hogg, G. (1994). Consumer behaviour and services: A review. Journal of Marketing Management, 10(4), 311–324. https://doi.org/10.1080/0267257X.1994.9964277
- Gallarza, M. G., Ruiz-Molina, M. E., & Gil-Saura, I. (2016). Stretching the value-satisfaction-loyalty chain by adding value dimensions and cognitive and affective satisfactions: A causal model for retailing. Management Decision, 54(4), 981–1003. https://doi.org/10.1108/MD-07-2015-0323
- Gerbing, D. W., & Anderson, J. C. (1988). An update paradigm for scale development incorporating unidimensionality and its assessments. Journal of Marketing Research, 25(2), 186–192. https://doi.org/10.1177/002224378802500207
- González Santa-Cruz, F., & López-Guzmán, T. (2017). Culture, tourism and world heritage sites. Tourism Management Perspectives, 24(2017), 111–116. https://doi.org/10.1016/j.tmp.2017.08.004
- Hieu, V. M., & Rasovska, I. (2017). Craft villages and tourism development, a case study in Phu Quoc island of Vietnam. Management, 21(1), 223–236. https://doi.org/10.1515/manment-2015-0090
- Hill, D. J. (1986). Satisfaction and consumer services. ACR North American Advances, NA–13. https://www.acrwebsite.org/volumes/6510/volumes/v13/NA-13/full
- Ho, L.-H., Feng, S.-Y., & Yen, T.-M. (2015). Using fuzzy gap analysis to measure service quality of medical tourism in Taiwan. International Journal of Health Care Quality Assurance, 28(7), 648–659. https://doi.org/10.1108/IJHCQA-06-2014-0072
- Impraim, E. C., Akonnor, P. O., & Nyantakyi, E. (2018). Evaluation of food safety and hygienic practices in the tourism industry: a case study of some selected restaurants in the kumasi metropolis. Restaurant Business. https://doi.org/10.26643/RB.V117I11.3882
- Jankalová, M. (2016). Service quality—object of business excellence measuring. Review of European Studies, 8(2), 71. https://doi.org/10.5539/res.v8n2p71
- Johnson, C., & Mathews, B. P. (1997). The influence of experience on service expectations. International Journal of Service Industry Management, 8(4), 290–305. https://doi.org/10.1108/09564239710174381
- Kasiri, L. A., Guan Cheng, K. T., Sambasivan, M., & Sidin, S. M. (2017). Integration of standardization and customization: Impact on service quality, customer satisfaction, and loyalty. Journal of Retailing and Consumer Services, 35(C), 91–97. https://doi.org/10.1016/j.jretconser.2016.11.007
- Kusluvan, S. (2003). Managing employee attitudes and behaviors in the tourism and hospitality industry. Nova Publishers.
- Latiff, K., & Imm, N. S. (2015). The impact of tourism service quality on satisfaction. Journal of Economics and Management, 9(S), 67–94, 28. https://www.ijem.upm.edu.my/vol9noS-DEC/4.%20The%20Impact%20of%20Tourism%20Service%20Quality%20on%20Satisfaction.pdf
- Lee, T.-H. (2009). A structural model for examining how destination image and interpretation services affect future visitation behavior: A case study of Taiwan’s Taomi eco-village. Journal of Sustainable Tourism, 17(6), 727–745. https://doi.org/10.1080/09669580902999204
- Lee, Y.-K., Park, K.-H., Park, D.-H., Lee, K. A., & Kwon, Y.-J. (2005). The relative impact of service quality on service value, customer satisfaction, and customer loyalty in Korean family restaurant context. International Journal of Hospitality & Tourism Administration, 6(1), 27–51. https://doi.org/10.1300/J149v06n01_03
- Leslie, D., & Sigala, M. (2005). International cultural tourism: management, implications and cases. Routledge.
- López-Toro, A. A., Díaz-Muñoz, R., & Pérez-Moreno, S. (2010). An assessment of the quality of a tourist destination: The case of Nerja, Spain. Total Quality Management & Business Excellence, 21(3), 269–289. https://doi.org/10.1080/14783360903553164
- Lo, C., Wang, C.-H., Chien, P.-Y., & Hung, C.-W. (2012). An empirical study of commercialization performance on nanoproducts. Technovation, 32(3–4). https://doi.org/10.1016/j.technovation.2011.08.005
- Maclaurin, T. L. (2004). The importance of food safety in travel planning and destination selection. Journal of Travel & Tourism Marketing, 15(4), 233–257. https://doi.org/10.1300/J073v15n04_02
- Madar, A. (2019). Continuously improving the quality of tourism services, a method of increasing customer satisfaction. Bulletin of the Transilvania University of Braşov. Series V - Economic Sciences. 12(61), 87–94. https://doi.org/10.31926/but.es.2019.12.61.1.12
- Martilla, J. A., & James, J. C. (1977). Importance-performance analysis. Journal of Marketing, 41(1), 77–79. https://doi.org/10.1177/002224297704100112
- Mokoena, L. G. (2020). Cultural tourism: cultural presentation at the Basotho cultural village, Free State, South Africa. Journal of Tourism and Cultural Change, 18(4), 470–490. https://doi.org/10.1080/14766825.2019.1609488
- Moswete, N., Saarinen, J., & Monare, M. J. (2015). Perspectives on cultural tourism: a case study of bahurutshe cultural village for tourism in Botswana. Nordic Journal of African Studies, 24(3 & 4), 22. https://doi.org/10.53228/njas.v24i3&4.124
- Nang E-Portal, D. (2022). Location and natural conditions of Da Nang city. https://danang.gov.vn/web/en/detail?id=26029&_c=16407111
- Narayan, B., Rajendran, C., & Sai, L. P. (2008). Scales to measure and benchmark service quality in tourism industry: A second‐order factor approach. Benchmarking: An International Journal, 15(4), 469–493. https://doi.org/10.1108/14635770810887258
- Nugraha, Y. E., & Lema, E. C. (2021). Development strategy of matalafang traditional village as a cultural tourism destination. Journal of Indonesian Tourism, Hospitality and Recreation, 4(1), 61–74. https://doi.org/10.17509/jithor.v4i1.31075
- Otto, J. E., & Ritchie, J. R. B. (1996). The service experience in tourism. Tourism Management, 17(3), 165–174. https://doi.org/10.1016/0261-5177(96)00003-9
- Özkan, P., Süer, S., Keser, İ. K., & Kocakoç, İ. D. (2019). The effect of service quality and customer satisfaction on customer loyalty: The mediation of perceived value of services, corporate image, and corporate reputation. International Journal of Bank Marketing, 38(2), 384–405. https://doi.org/10.1108/IJBM-03-2019-0096
- Parasuraman, A., Zeithaml, V. A., & Berry, L. L. (1985). A conceptual model of service quality and its implications for future research. Journal of Marketing, 49(4), 41–50. https://doi.org/10.1177/002224298504900403
- Parasuraman, A., Zeithaml, V. A., & Berry, L. L. (1994). Reassessment of expectations as a comparison standard in measuring service quality: implications for further research. Journal of Marketing, 58(1), 111–124. https://doi.org/10.1177/002224299405800109
- Park, J., & Jeong, E. (2019). Service quality in tourism: a systematic literature review and keyword network analysis. Sustainability, 11(13), 3665. https://doi.org/10.3390/su11133665
- Pham Hong, L., Ngo, H. T., Pham, L. T., & Coetzee, W. (2021). Community-based tourism: opportunities and challenges a case study in Thanh Ha pottery village, Hoi An city, Vietnam. Cogent Social Sciences, 7(1), 1926100. https://doi.org/10.1080/23311886.2021.1926100
- Phuc, L. V., & Linh, N. H. N. (2019). Assessing the status of building collective marks for craft village products in Thua Thien Hue province. Hue University Journal of Science: Economics and Development, 128(5C), 169–183. https://doi.org/10.26459/hueuni-jed.v128i5C.5134
- Pizam, A., Pine, R., Mok, C., & Young Shin, J. (1997). Nationality vs industry cultures: which has a greater effect on managerial behavior? International Journal of Hospitality Management, 16(2), 127–145. https://doi.org/10.1016/S0278-4319(97)00001-7
- Puri, G., Singh, K., & Gantait, A. (2018). Investigating the relationship between service quality and destination loyalty: a study on Shaam-E-Sarhad village resort, Hodka, Gujarat, India (SSRN Scholarly Paper No. 3835619). Social Science Research Network. https://papers.ssrn.com/abstract=3835619
- Rahmiati, F., Othman, N. A., Bakri, M. H., Ismail, Y., & Amin, G. (2020). Tourism service quality and tourism product availability on the loyalty of international tourists. The Journal of Asian Finance, Economics and Business, 7(12), 959–968. https://doi.org/10.13106/jafeb.2020.vol7.no12.959
- Raţă, G. (2013). The English of tourism. Cambridge Scholars Publishing.
- Richards, G., & Richards, G. B. (1996). Cultural tourism in Europe. CAB International.
- Ruiqi, Z., & Adrian, P. (2009). Using servqual to measure the service quality of travel agents in Guangzhou, South China. Journal of Services Research, 9(1), 87–107. https://www.proquest.com/docview/195549561?pq-origsite=gscholar&fromopenview=true
- Santouridis, I., & Trivellas, P. (2010). Investigating the impact of service quality and customer satisfaction on customer loyalty in mobile telephony in Greece. The TQM Journal, 22(3), 330–343. https://doi.org/10.1108/17542731011035550
- Sivadas, E., & Baker-Prewitt, J. (2000). An examination of the relationship between service quality, customer satisfaction, and store loyalty. International Journal of Retail & Distribution Management, 28(2), 73–82. https://doi.org/10.1108/09590550010315223
- Sugandini, D., Wendry, B., & Muafi (2017). Influence of quality relationship and satisfaction on loyalty: study on supplier in Indonesia (SSRN Scholarly Paper ID 3065260). Social Science Research Network. https://papers.ssrn.com/abstract=3065260
- Tasci, A. D. A., & Boylu, Y. (2010). Cultural comparison of tourists’ safety perception in relation to trip satisfaction. International Journal of Tourism Research, 12(2), 179–192. https://doi.org/10.1002/jtr.745
- Tucker, H. (2016). Empathy and tourism: Limits and possibilities. Annals of Tourism Research, 57(C), 31–43. https://doi.org/10.1016/j.annals.2015.12.001
- Wong Ooi Mei, A., Dean, A. M., & White, C. J. (1999). Analysing service quality in the hospitality industry. Managing Service Quality: An International Journal, 9(2), 136–143. https://doi.org/10.1108/09604529910257920
- Xue, L., Pan, X., Wang, X., & Zhou, H. (2021). Introduction: diversity of cultures, villages and architecture. In L. Xue, X. Pan, X. Wang, & H. Zhou (Eds.), Traditional Chinese villages: beautiful Nostalgia (pp. 1–13). Springer. https://doi.org/10.1007/978-981-33-6154-6_1
- Yim King Wan, P., & Man Cheng, E. I. (2011). Service quality of Macao’s world heritage site. International Journal of Culture, Tourism and Hospitality Research, 5(1), 57–68. https://doi.org/10.1108/17506181111111762
- Zeithaml, V. A. (1988). Consumer perceptions of price, quality, and value: a means-end model and synthesis of evidence. Journal of Marketing, 52(3), 2–22. https://doi.org/10.1177/002224298805200302
- Zeppel, H. (2002). Cultural tourism at the Cowichan native village, British Columbia. Journal of Travel Research, 41(1), 92–100. https://doi.org/10.1177/0047287502041001011