
Abstract
Social Network Analysis and Geographic Information Systems can be combined and applied to communication research to better understand how communication networks are associated with spatial or city characteristics. We use a case study of communication networks of immigrant church members (N = 178) in New Jersey to test theories of spatial versus strategic assimilation, visualize social networks, and city racial composition. The findings demonstrate that church members seeking information from coethnic immigrant networks were more likely to live in cities with a concentration of white residents, whereas members who provided more informational support to other members were less likely to live in whiter areas. Thus, coethnic residential choice may not always be linked to immigrant network use and the case applies more to the pattern of strategic assimilation. Future communication research involving questions related to physical locations and space can benefit from combining Social Network Analysis and Geographic Information System techniques in innovative ways.
Public Interest Statement
Two distinct research methods (i.e., Social Network Analysis and Geographic Information Systems) were combined and applied to explore how communication networks are associated with spatial or city characteristics. A case of communication networks of Korean immigrant church members (N = 178) in New Jersey was examined in this study to test theoretical ideas, visualize social networks, and city racial composition. The results showed that church members seeking information mainly from fellow immigrant church members were more likely to live in cities with more white residents, whereas members who provided more information to other members were less likely to live in whiter areas. Thus, Korean immigrants’ residential choice may not always be linked to their network use and the case applies more to the pattern of strategic assimilation where immigrants move out of an ethnic enclave but stay in touch with their ethnic communities for socializing and cultural resources.
1. Introduction
Social network analysis (SNA) has been adopted by communication scholars first in organizational communication research (Monge & Contractor, Citation2003) and later in the area of communication and technology, political communication, and health communication. Distinct from the traditional statistical analysis that assumes independence of each observed case, SNA assumes “interdependence” of cases and structural dynamics that are above and beyond the influences of individual units. Developed by graph theorists and mathematicians, and applied first to anthropology and sociology, SNA has become its own field of science (i.e., network science) involving multiple disciplines from social science disciplines to computer science and neuroscience. The fundamental difference of SNA’s relational paradigm (Emirbayer, Citation1997) brought unique paths of methodological development and, with the advancement of computing and simulation technology, SNA methods are still being innovated by leading statisticians and network scholars.
One of SNA’s many strengths is considering and visualizing structural effects (Scott, Citation2000; Wasserman & Faust, Citation1994). SNA studies do not always include a whole-network approach. However, when they do include the entire network, researchers can use SNA to represent a bird’s eye view of patterns of connections. The connections can represent communication and various types of relationships between nodes (i.e., individual units) and the nodes in the network can be individuals, groups, organizations, or even countries (Monge & Contractor, Citation2003). It is almost impossible for an individual unit to have an accurate understanding of the whole network, and how the whole network reconfigures when relationships between and among subunits change (Kadushin, Citation2012). As systems theory would argue, the sum of individual units is more than a simple aggregation of them, and SNA can show the unique impact of a structure built by diverse patterns of relationships among individual units (Scott, Citation2000; Wasserman & Faust, Citation1994).
While SNA has been actively adopted by many communication scholars, geographic information system (GIS) technology is still unfamiliar and relatively unknown in the field. GIS is geographically focused computer technology and software that manages information from multiple data sources and analyzes and displays spatial and non-spatial information (Petzold, Citation1994; Wong & Hillier, Citation2001). This approach is commonly used in geography, urban planning, public health, social work, sociology, environmental studies, and other disciplines (Cromley & McLafferty, Citation2011; DeBats & Gregory, Citation2011; Grimmond & Souch, Citation1994; Nedović-Budić, Citation1998; Rushton, Citation2003; Sui, Citation1995; Wong & Hillier, Citation2001).
GIS can be used to understand a breadth of phenomena related to space through its cartographic and data management tools. For example, GIS can identify statistically significant high and low clustering of groups to understand geographic characteristics (Anselin, Citation1995; Walton, Citation2015). GIS has also been used as a tool to assess accessibility of services by identifying the number of providers in an area or calculating the distance and travel time to providers (Yang et al., Citation2006). Given its visual component, GIS can display meteorological conditions based on wind (Che et al., Citation2013), changes in residential segregation demographics through historic address records (Logan, Citation2017), or modeling glacier and ice masses through remote sensing data (Gao & Liu, Citation2001). Other researchers use GIS to assemble or calculate variables that are used in regression models, such as matching an individual to their neighborhood characteristics (Lee, Citation2018), or to determine the distance to a key point of interest (Baker & Lee, Citation2019). Finally, GIS can conduct spatial statistics and assess if there are statistically significant relationships or patterns through spatial components (e.g., length, area, proximity; see, Scott & Getis, Citation2008).
1.1. Why combine SNA and GIS
Since the early 2000s, communication scholars have started paying more attention to issues of space and how people perceive and communicate about various types of space (Aiello, Citation2011; Modesti, Citation2008; Topinka, Citation2016; Triece, 2017; Vall, Citation2012; Wilhoit, Citation2018). GIS may be useful to help address these emerging streams of research, especially with communication and urban design. For example, scholars have researched how urban design—such as smart city planning—shapes residents’ social interactions and daily activities (Halogua, Citation2011, Citation2020). With the advent of location awareness technology, more studies have examined issues related to physical and online space. For example, Schwartz and Halegoua (Citation2015) proposed a theoretical framework of “spatial self,” capturing the process of online self-presentation based on display of offline physical activities. Renowned communication scholar, Ball‐Rokeach et al. (Citation2001), Y.‐C. Kim and Ball‐Rokeach (Citation2006)) also presented a communication infrastructure theory based on their metamorphosis project on neighborhood storytelling networks and communicative action contexts. Their theory and research showcase how residents’ perception of their community space (e.g., safety, cultural diversity, work conditions) can impact their communication about their space (i.e., storytelling), which has implications for various actions such as civic engagement (Nah & Yamamoto, Citation2017), healthcare access (Wilkin, Citation2013), and inter-group relationships and conflicts (Broad et al., Citation2014).
We explore the application of SNA and GIS because they both are research approaches that have visually strong aspects that can be used to complement each other. Traditionally, SNA is not based on any geographic location other than the network data that can be sampled from residents in certain communities with physical boundaries. When constructing social relationships among individuals, based on observed or reported data, individuals’ locations within the network (central or peripheral) do not have any specific connection to their physical locations.Footnote1 However, location can shape these social relationships, particularly when geographic location can prescribe specific meanings. Residential location has been shown to affect social networks, particularly in research about ethnic segregation or immigrant enclaves (further described below).
In this exploratory study, we use SNA and GIS to better understand the communication networks and residential choice for members of a Korean immigrant church community. Specifically, we test the association between immigrants’ position in their ethnic communication network, city racial residential composition, and distance to the church using SNA, GIS, and logistic regressions. We investigate how individuals’ positions within the information exchange network of the immigrant community (calculated by SNA) relates to whether they live in a predominantly white or Asian city. Using GIS, we also test the relationship between these variables and city socioeconomic characteristics (income and educational attainment) from the American Community Survey (ACS).
We further use this combined approach to test the sociological theoretical application of assimilation on this immigrant population. Traditional assimilation theories posit that immigrants become less dependent on coethnic resources as their socioeconomic status increases and as they become more familiar with mainstream institutions (Gordon, Citation1964). Spatial assimilation asserts that racial minorities and immigrants reside in integrated, whiter areas to access higher quality amenities once they can afford to (Massey & Denton, Citation1985). This theory is in contention with strategic assimilation, in which residents may move to a white area, but remain part of ethnic communities or institutions to stay connected to their racialized identities and culture (Lacy, Citation2004). We test the application of strategic or spatial assimilation to understand Lee’s (Citation2014) data of Korean immigrant church members. Here, we specifically assess whether members exchanging informational resources with their ethnic community members is associated with likelihood of living in cities with a concentration of white or Asian residents.
The findings contribute to theories on residential segregation and immigrant communities because we identify how members maintain ethnic connections while living in white areas. While we cannot assess the direction of causality, the study illuminates how immigrants’ residential choice in a white area does not always associate with limiting coethnic ties. The study has theoretical implications for assimilation research in relation to communication networks. At times, ethnic enclaves and communication networks are seen as barriers for social mobility and cross-cultural adaptation (Kim, Citation2001). Our findings challenge these assumptions and suggest different paths of how immigrants use residential location or coethnic resources (i.e., information gained from coethnic ties). The study also has implications on how coethnic social networks may associate with immigrants’ residential decisions and communicative resources for resettlement (Choldin, Citation1973; Haug, Citation2008; Kalita, Citation2005; Massey & Denton, Citation1985).
1.2. Role of immigrant social networks
Social networks are critical in immigrant settlement because they provide information on how to apply for immigrant visas and/or an invitation to live in the host society as a permanent resident. Many immigrants begin their new lives near or within coethnic areas to access a wider coethnic network since geographic proximity provides easy access to in-language and culturally sensitive resources (Haug, Citation2008; Kalita, Citation2005; Li, Citation1998). However, there is a mixed literature on ethnic enclaves and social mobility (J.M. Sanders & Nee, Citation1996; J. M. Sanders & Nee, Citation1987; Nee et al., Citation1994; Sanders et al., Citation2002). Zhou (Citation1992) found that Chinatown in New York provided low-income immigrants with opportunities to save money and increase their status. In contrast, some low-wage workers are exploited by coethnic employers by wage theft, poor working conditions, and discrimination in these neighborhoods (Bohon, Citation2013; Y. Park, Citation2005). These working conditions limit immigrants’ social networks to coethnics and/or become a structural barrier for mobility in the host society (Sanders et al., Citation2002).
Immigrants also use institutions and organizations to cultivate social networks. As more immigrants settle in an ethnic community, they develop coethnic institutions (Espiritu, Citation1992; Lee & Zhou, Citation2015). These organizations create or reinforce immigrant networks. For example, studies on Korean immigrants describe the importance of immigrant churches (Hurh & Kim, Citation1984; J. K. Yoo, Citation2000; Kwon et al., Citation2001; Min, Citation1992; K. Park, Citation1997). These churches allow members to gather information and obtain emotional support, which contributes to unique forms of social capital embedded in immigrant communities (Lee et al., Citation2018; Portes & Sensenbrenner, Citation1993).
As Portes and Sensenbrenner (Citation1993) describe, coethnic immigrant social interactions foster “enforceable trust” and “bounded solidarity.” Members may feel obligated to other immigrants because they have been helped previously by fellow coethnic members. Thus, resource exchange may not be quid-pro-quo, but rather a generalized exchange among members in which early settlers help late comers, and late comers help those who arrive after them. This solidarity is not universal but bounded by ethnicity. For instance, members can also feel united against a common adversary or the host society’s discrimination (Zhou, Citation1992). Some immigrant communities develop their institutional completeness based on these sources of social capital to the extent they have various kinds of ethnic organizations, business, and language and culture schools available for their second and third generations (Kim, Citation2001; Lee, Citation2017). Immigrant communities can organize and mobilize their social networks into a collective power to voice their opinions in neighborhood policy making and vote for someone who would represent their interests (Goldenberg & Haines, Citation1992).
Immigrant social networks not only influence their social mobility and economic opportunities, but also intercultural development (Lee, Citation2014) and cross-cultural adaptation (Kim, Citation2001). Kim (Citation2001) theorized both host and ethnic social communication as critical components of immigrants’ or sojourners’ cross-cultural adaptation, and strength and size of host and ethnic ties (network composition) would impact various indicators of adaptation including intercultural personhood. According to her theory and research, those who developed stronger and large host ties over time would better adapt to the new environment while becoming more intercultural. Similarly, Lee’s (Citation2014) study of a Korean immigrant community showed members with more monocultural orientation frequently exchanged various forms of support within the ethnic community but had developed fewer intercultural relationships. Since individuals have limited time and resources to invest in social relationships, how their social networks are composed in terms of cultural diversity and where they are located within the networks (e.g., central or peripheral) structurally impact various outcomes related to culture (e.g., cultural identity; Emirbayer, Citation1997).
1.3. Links between residential choice and immigrant social networks
Social networks affect spatial patterns of immigrant settlement because they shape socioeconomic adaptation as described by researchers in geography, sociology, urban studies, and economics. Below we summarize some key aspects of this literature on residential choice and immigrant social networks, with a focus on sociological studies to align with our theoretical framework. First, immigrants rely on friends and family in their housing and employment search, particularly in new areas (Basolo & Nguyen, Citation2009; Buendía et al., Citation2017; Krysan & Crowder, Citation2017; Zhou, Citation1992). This information is particularly useful given the role that residential mobility can have on improving labor market outcomes (Ludwig & Raphael, Citation2010).
Second, social networks inform and shape individuals’ perception of neighborhood or city amenities, including quality schools, new housing stock, and quiet areas close to employment (Kalita, Citation2005; Lee, Citation2021; Lung-Amam, Citation2017). Again, Ball‐Rokeach et al.’s (Citation2001) communication infrastructure theory is a particular application of this idea (i.e., social networks’ influence on neighborhood perception) to the field of communication. The more a resident is integrated into a neighborhood’s storytelling network (interpersonally and through local community organizations and media), the more likely the person is civically engaged and that their network is strong (Nah & Yamamoto, Citation2017).
Third, residential choice is theorized to reflect immigrants’ dependence on coethnic networks (Massey & Denton, Citation1985). For instance, immigrants who live in coethnic areas are less likely to be fluent in English (Nguyen, Citation2004). As immigrants become embedded in the host society networks, they develop relationships with non-coethnic members (Gordon, Citation1964; Kim, Citation2001). These relationships help subsequent generations to move out of the enclave into white or integrated areas (Massey & Denton, Citation1985), in which residents translate their socioeconomic advancement into access to higher-quality schools and neighborhoods with lower crime rates (Alba et al., Citation1999; Charles, Citation2003; Intrator et al., Citation2016; Massey & Denton, Citation1985; South et al., Citation2008; Wright et al., Citation2005). As they move out of these enclaves, immigrants depend less on their coethnic networks, which aligns with traditional assimilation theories (Brown, Citation2006; Janjuha-Jivraj, Citation2003; see also, Gordon, Citation1964). For example, immigrants in Israel with higher socioeconomic status and fluency in Hebrew were more likely to live in non-immigrant neighborhoods (Mesch, Citation2002). In contrast, those who remain in non-white racially concentrated areas are impacted by limited upward economic mobility across multiple generations (Andrews et al., Citation2017).
These studies portray a linear pathway for immigrant socioeconomic advancement. Yet, residential choice may not always reflect coethnic social ties. For instance, Lacy’s (Citation2004) study compares middle-class Blacks residing in Black and white areas in the US. Those who lived in Black areas used resources from their neighbors to develop their children’s racial identities. Individuals who lived in white areas accessed higher quality amenities, but still participated in a Black social organization such as a church to stay connected to their culture and identity. Lacy (Citation2004) consequently theorized strategic assimilation, in which households moved between Black and white spaces to obtain neighborhood amenities and connect to a Black community group. Marten et al.’s (Citation2019) study also identified how refugee residence in coethnic neighborhoods are associated with higher economic integration because this colocation facilitates information sharing about employment opportunities.
While building on the aforementioned studies, we examine the relationship between immigrants’ ethnic social networks (of information exchange) and strategic or spatial assimilation. According to spatial assimilation, the likelihood of residence in a white area would be higher for less central members of the Korean immigrant community, while strategic assimilation would show continued high network centrality for immigrant residents in a white area. In view of the above, the following research question is proposed:
RQ. How does the extent of information exchange among Korean immigrant church members relate to the likelihood of living in (a) a white area or (b) an Asian area?
2. Methods
2.1. Data collection and participants
To examine the relationship between immigrant social networks (i.e., composed of local coethnic community members with whom they exchange various types of social support) and geographic location, we used available data from a survey of Korean immigrant church members in suburban New Jersey. The data collection was approved by the Institutional Review Board of Rutgers University in 2011. New Jersey’s Korean population increased by more than 43% between 2000 and 2010 with nearly 95,000 in 2010 (Wu, Citation2012). To put this into a broader context, Asian migration to the US has increased considerably since the 1965 Immigration Act, and as of 2019, 14.1 million Asian immigrants live in the US, which account for 31% of all US immigrants (Migration Policy Institute, Citation2021). South Korea is the sixth largest country of origin among these Asian immigrants. The study area is defined as where church member respondents live, which was predominantly in Middlesex County, New Jersey. According to the 2011 5-year American Community Survey, the county overall had more than 800,00 residents. About 21% of the county were Asian with a little more than 6,000 Koreans. About 89% of the county had at least a high-school degree and the median household income was about $279,000. About 40% of the county spoke a language other than English and about 30% of the county were foreign-born.
Many Korean immigrant households moved from New York into New Jersey suburbs because of higher quality schools, lower cost of living, relocation of Korean multinational corporations in New Jersey, the establishment of suburban Korean enclaves, and proximity to New York City (Min & Kim, Citation2010). According to the 2017 American Community Survey 5-year estimates, there were nearly 105,000 Koreans in New Jersey. The church was founded in 1974 and had about 450 first-generation adults (born in Korea and immigrated to the US) Korean-speaking congregants in 2011. In our analysis, we focused on the Korean-speaking congregants. (The church had a separate service for its English-speaking ministry, which had less than 100 attendees. Though the English-ministry pastor was white, most congregants were Korean Americans, second- or third-generation immigrants; and various levels of Sunday school from kindergarten to high-school ages was part of the church ministry). Surveys were translated in Korean by a Korean-English bilingual person and then verified by another bilingual church member. Finalized surveys were mailed to all registered adult members from November 2011 to January 2012. The study was promoted during Sunday services and other church gatherings. A total of 178 (about 40% response) surveys were returned by September 2012 after multiple reminders provided to the church members.
The survey consisted of mostly closed-ended questions asking about respondents’ demographics, media usage, social networking, and acculturation, which were various aspects of Korean immigrants’ daily lives. This study used the following participant individual characteristics: age, sex, monthly income, education, and length of church membership. There was only one open-ended question in the survey, which asked participants’ city or borough of residence. summarizes the demographic information of research participants. The survey participants’ ages ranged from 21 to 78 years (M = 50.95, SD = 13.52), and a slight majority identified as female (54%). The distribution of monthly income among participants was relatively even. Most participants had at least a college degree (76%) and were married (88%). Survey respondents moved to the U.S. ranging from 2 to 50 years ago (M = 21.98, SD = 10.3), and church membership ranged from 6 months to 36 years (M = 11.27, SD = 8.05). Additional data were collected from the 2010 Decennial Census (city racial composition) and the 2011 5-year American Community Survey (city-level socioeconomic characteristics) as described in the following section.
Table 1. Summary of sample demographics
2.2. Variable measurement and analyses
2.2.1. Assessment of social networks
The independent variables consisted of individual and city-level characteristics in addition to social network position variables. To assess social networks, participants provided names of up to six people (i.e., alters) whom they contacted to seek information from in their daily lives and alters’ demographic information. Based on a name generator method (Marin & Hampton, Citation2007), survey respondents were also asked if alters attended the same church. This process generated a total of 289 members in the information exchange network, and each member’s structural position (i.e., centrality) was then calculated. UCINET 6.0 (Borgatti et al., Citation2002), a commonly used network analysis software, was used to obtain In- and Out-Bonacich centrality scores. Bonacich (Citation1987) theorized the importance of the number of connections a person has in their network and the level of influence of these connections. For example, a person with five isolated friends has less influence than another person with five well-connected friends. The latter person would have a higher In-Bonacich centrality score. Centrality and influence then may be a function of the connections of actors in one’s area (Bonacich, Citation1987). The more connections the actors in one’s neighborhood have, the more central one is.
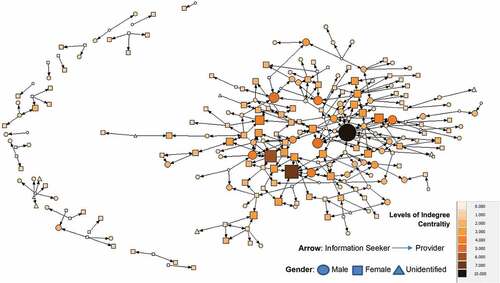
Out-Bonacich centrality indicates how expansive a participant’s information sources are. A higher score indicates the person has more information providers, or they are more active in seeking information and are connected to other active information seekers in the network compared to those with lower Out-Bonacich centrality scores. The fewer the connections the actors in one’s neighborhood have, the more powerful one can be. In-Bonacich centrality indicates how important one is in terms of providing resources to others. Thus, higher In-Bonacich scores indicate more provision of information and importance in the social network. It is common to have negative values as a result of calculating bonacich (power) centrality and we need to consider both negative and positive values for inferential statistics. Negative value of out-Bonacich centrality indicates actors have less power over other actors (alters) as those alters are already well connected. visualizes the church’s information exchange network based on gender and degree centrality score of each member. Circle nodes are males, square nodes are females, and up-triangle nodes are unidentified gender. Node color and size indicate nine different levels of indegree centrality (the darker and the larger, the higher the number of direct connections of information exchange; refer to the legend for which level each color indicates). Higher number of indegree centrality means being actively engaged in information exchange with other church members by frequently becoming their information sources. The arrow represents the direction of information seeking.
Figure 1. Information Exchange Network of the Korean Immigrant Church Members.
2.2.2. Association with geographic residence
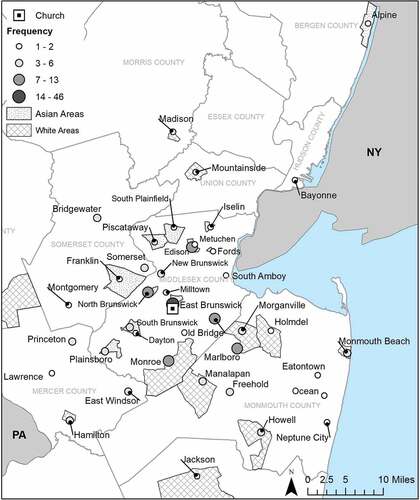
Given that our data focus on Korean immigrant church members, the geographic focus of the study is on their city or borough of residence. To test if social networks were associated with geographic residence, the survey respondents indicated their city or borough of residence (hereinafter referred to as city) and this geographic indicator was used as an independent variable. After, individual respondents’ cities were mapped and joined to place-level socioeconomic variables from the American Community Survey 2011 5-year data using ArcGIS: median household income (in 2011 dollars) and percentage of population with at least a high-school degree.Footnote2 These variables were then matched to the independent variable of city racial concentration. Two participants did not fill out the question on city of residence. The remaining 176 lived in 39 cities. The frequency of participants by city are displayed in , where about a fourth lived in East Brunswick where the church is located, and less than 10% lived in the surrounding cities such as Old Bridge, Monroe, and North Brunswick. GIS also allows for different display settings to indicate frequency of points. As shows, the number of participants by city or borough is indicated by size of the point. The boroughs or cities closest to the city where the church is located had the greatest number of participants (with larger circles) while cities or boroughs further away had fewer participants, such as Alpine, Madison, Mountainside, or Jackson (with smaller circles). Participants lived in cities or boroughs with an average household income of approximately $92,700 and with at least 75% with a high-school degree.
Figure 2. Map of respondents’ residential location and church, New Jersey.
To assess if respondents reside in a white- or Asian-concentrated city, racial concentration was analyzed using Walton’s (Citation2015) method. Given the theoretical focus of the analysis on spatial or strategic assimilation, we focus on white and coethnic (Asian) areas, respectively.Footnote3 Respondent areas were first identified as having significant racial concentration in ArcGIS using a local Moran’s I test of contiguous edges, which identifies statistically significant spatial clustering relative to nearby cities.Footnote4 The analysis accounts for unusually high racial concentration in a city and considers high populations in adjacent cities. We designated cities with a significantly high spatial autocorrelation (α < 0.05) of whites or Asians using the 2010 Decennial Census. A city can be categorized as statistically significant concentration if the proportion of the group is high relative to other cities in the county. Residence in a white or Asian area was then categorized as dummy variables for the logistic regression-dependent variables. One dependent variable indicated if a participant lived in an Asian city (1) or did not live in an Asian concentrated city (0). We also constructed a second dependent variable to indicate whether a participant lived in a city with white residential concentration (1) or did not live in a white concentrated city (0). Of the 39 cities where participants lived, there were 12 cities with a concentration of Asian residents and 9 cities with a concentration of white residents. The remaining cities did not have statistically significant racial concentration and were categorized as 0 for both dependent variables. Overall, the church is surrounded by Asian resident clusters on the northern side (see, ). In contrast, more integrated, whiter areas are on the southern side of the church and/or further away.
We ran some cross-tabulation between participants’ residential city and their sex, age, income, and length of church membership. By doing this, we realized slightly over a quarter (25.8%) of participants lived in the city where the church was located, and another quarter or less (24.2%) lived within 30 mins of driving distance (i.e., North Brunswick, Marlboro, Old Bridge, Edison). In terms of their demographics distribution, no residential city or area particularly stood out; overall, there were slightly more females than males, most participants (78.4%) were members of the church less than 15 years, members whose age belonged to 40–50 were dominant groups (56.2%).
3. Results
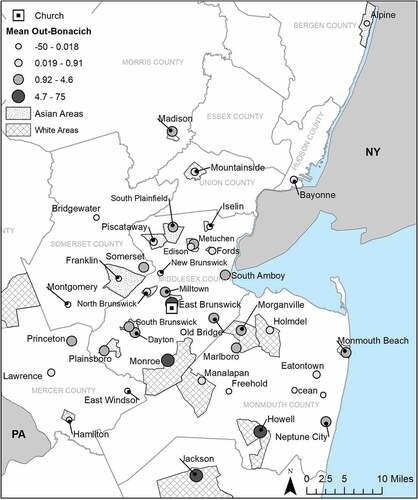
We first combined SNA and GIS to visualize whether respondents’ location had a relationship with individual network centrality scores. displays a map with the mean Out-Bonacich centrality score per borough or city. The centrality score is categorized by natural quartiles. The smaller size point indicates a lower centrality score for residents in the borough or city, while a larger size circle indicates a higher mean centrality score. Overall, respondents in the cities or boroughs surrounding the church had centrality scores between the 25th and 75th quartiles (or between 0.02 and 4.6). The exception is the city where the church is located (East Brunswick), in which participants in this area had a high mean Out-Bonacich score and are consequently more active to seek information and more connected to others in the network. Areas with the lowest centrality scores tend to be located further away from the church, or the smallest circles. White cities also tend to have larger circles, or residents in these areas tend to have a higher mean Out-Bonacich score.
Figure 3. Respondent mean out-bonacich centrality score by borough or city, New Jersey.
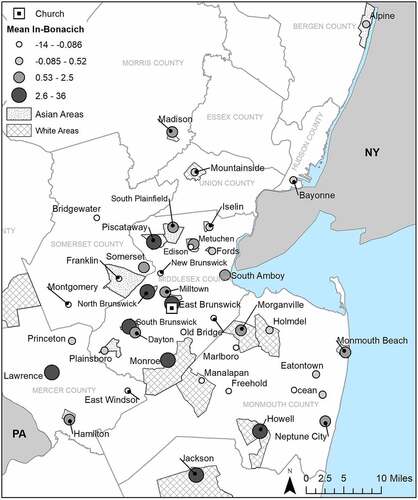
displays a map of the mean In-Bonacich centrality score by borough or city. The In-Bonacich centrality score is also categorized by natural quartiles, and the size of circles indicates the degree of centrality. Overall, respondents in the cities or boroughs surrounding the church had centrality scores between the 75th and 100th quartiles (or between 0.6 and 40), as indicated by the largest circles. In other words, respondents with higher In-Bonacich centrality (major sources of information) tend to live closer to the church with a few exceptions in cities such as Jackson, Howell, and Lawrence. While these figures help to identify some patterns in the data, they do not display statistical significance. Building on this descriptive analysis, the current study utilized logistic regressions to test statistical significance.
Figure 4. Respondent mean in-bonacich centrality score by borough or city, New Jersey.
Consequently, logistic regressions examined members’ likelihood of living in predominantly white (RQa) or Asian (RQb) cities in relation with their social network positions after controlling for individual demographics (i.e., sex, age, income, length of church membership and education level) and city-level socioeconomic characteristics (i.e., median household income and % of high-school graduates). Two binary logistic regressions were conducted via utilizing generalized linear models in SPSS: one predicting likelihood of living in white cities and another for likelihood of living in Asian cities. As a result, the probability of living in a city with a significant white concentration was significantly associated with participants’ In-Bonacich (B = −.58, Wald χ2 = 4.72, p = .03) and Out-Bonacich (B = 1.70, Wald χ2 = 5.45, p = .02) centrality (see, ) but with an opposite direction for each centrality. Inverting the odds ratio for In-Bonacich centrality due to the negative beta score reveals that for each one-point increase in the centrality, participants are 1.75 times less likely to live in a white area. The effect size, indicated by Wald χ2 of Out-Bonacich centrality was similar to that of In-Bonacich, but each one-point increase of Out-Bonacich was associated with the odds of living in a white area increasing by 5.48 times.
Table 2. Summary of logistic regressions related to residence in cities with a concentration of white residents
The results suggest that participants who reported an expansive coethnic network of information sources (higher Out-Bonacich centrality) were more likely to live in a city with a concentration of white residents. On the other hand, if participants provided more information to other immigrant church members (higher In-Bonacich centrality), they were less likely to live in white areas. The result was significant after controlling for city-level characteristics. As expected with spatial assimilation, higher household income and percentages of high-school graduates in the city were associated with a greater likelihood of living in white areas. Out of 178 cases, 82% (n = 146) were included in the main analysis, and 14 out of 146 participants (10%) lived in a white area. The omnibus test of the fitted model versus a model with intercept only was statistically significant, χ2 (df = 11) = 38.14, p < .001. The model was able to correctly classify 39% of those who lived in the white city, and 95.9% of those who did not, for an overall success rate of 87%.
As a comparison, we conducted another logistic regression for the likelihood of living in cities with a statistically significant concentration of Asian residents (see, ). After controlling for the effect of percentage of high-school graduates living in the city (B = −22.49, Wald χ2 = 15.09, p < .001), both In- and Out-Bonacich centrality scores were not significantly associated with living in Asian areas. A higher percentage of high-school graduates living in the city was associated with a lower likelihood of living in Asian cities (the relationship was opposite for residence in white areas). Out of 178 cases, 82% (n = 146) were included in the main analysis, and 68 out of 146 participants (47%) lived in cities with a concentration of Asian residents. The omnibus test of the fitted model versus a model with intercept only was statistically significant, χ2 (df = 11) = 36.78, p < .001. The model was able to correctly classify 60% of those who lived in the Asian area, and 70.5% of those who did not, for an overall success rate of 66%.
Table 3. Summary of logistic regressions related to residence in cities with a concentration of Asian residents
4. Discussion
The current study examined immigrant members’ position in their ethnic social network and residential choice to explore the application of SNA and GIS combined. We utilized a survey of Korean immigrant church members in their information exchange network and visualized the distribution of network centralities with residential location. provided some visualization that Out-Bonacich scores might be related to residential location, as cities and boroughs with higher mean centrality scores were located in areas with a concentration of white residents.
Logistic regressions were also conducted to assess the relationship among church members’ In- and Out-Bonacich centrality in the information exchange network and the likelihood of living in non-Hispanic white or Asian areas to test the theory of spatial and strategic assimilation. In- and Out-Bonacich centrality scores were both significantly related to the probability of living in white areas, but in the opposite way. Members who were nominated as providing information to many other church members and connected to many other active information providers (higher In-Bonacich centrality) were less likely to live in cities with a concentration of white residents, whereas those actively seeking information from many other church members (higher Out-Bonacich) were more likely to live in white areas.
Our logistic regression results are in line with the cross-tabulation analyses introduced at the end of the method section as the regressions showed that no individual demographic variables were significantly associated with their residential choice of living in White or Asian concentrated cities. Only the length of church membership had a significant association with the likelihood of living in Asian area (the longer membership was associated with higher likelihood). The results about highest values of Out- and In-Bonacich centrality can be understood that members’ demographics might not have much to do with their residential choice, but their network positions might have some implications for their residential choice. In another word, network positions might not be significantly associated with demographics, either.
Members’ high In-Bonacich centrality was associated with lower likelihood of living in white concentrated areas (see, , beta value is negative). Those who had high Out-Bonacich centrality were more likely to live in white concentrated cities which were usually somewhat further away from the church location. Thus, we interpreted this result as an indicator showing those who moved out of coethnic (Asian) areas were still involved in the church network by seeking information from their fellow ethnic church members. Consequently, members who live in cities with a concentration of white residents stayed in touch with ethnic church members even from afar (considering the church was located in the Asian-concentrated city) and sought or received resources from them. This finding aligns with the idea of strategic assimilation (Lacy, Citation2004), in which participants who lived in a white area still maintained active connections to their coethnic institutions. Also, those who were prominent sources of other church members’ information seeking tended to not reside in white areas potentially because their social networks are based around their ethnic church members, who predominantly live in cities with a concentration of Asian residents.
5. Theoretical implications
The findings demonstrate the strength of combining the two research approaches (SNA and GIS) in testing the idea of spatial and strategic assimilation, and as a result, nuances in how Korean immigrants use resources available in ethnic social networks and their cities. First, immigrants actively engage their ethnic church connections to obtain informational resources (Out-Bonacich) even when they do not live physically close to their church members. However, other immigrants may also use their ethnic networks to remain connected to fellow immigrants by passing on informational resources to them (In-Bonacich), which increases their own centrality, thus influence and prestige in their social network.
Second, their ethnic network connections may have influenced residential choice. For instance, members who sought information from the church network were more likely to live in white areas. While we cannot assess direction of causality, these members may reside in cities with a concentration of white residents because they had strong desire to obtain resources beyond their immediate coethnic neighbors (spatial assimilation) and/or if they first settled in white areas and then used the ethnic immigrant church to seek cultural resources (e.g., information related to immigrant lives such as where to find Korean groceries, restaurants, or medical facilities with coethnic healthcare providers). Alternatively, church members providing informational resources to many others were less likely to live in white areas, which may suggest these individuals might gain information from their (non-white) neighbors and cities and then pass it onto their church network connections. It is possible that these central information providers may have settled in non-white areas first and then gathered information there from pre-established ethnic networks and passed information to other church members.
Korean immigrants’ church network connections were not significantly associated with their likelihood of living in cities with Asian residents. This finding may demonstrate that those who live in Asian areas can seek out and receive resources, particularly related to their daily lives, in their immediate city (not necessarily the same church members); thus, information from the church network may not be as rare to them compared to members who live in white-concentrated cities. In addition, both central and peripheral members of the church network can live in Asian areas, which makes the association between network centrality and residential choice less meaningful for the case of cities with Asian residents.
Our findings illuminate how spatial assimilation theory may have limited applicability to Korean-American immigrants in New Jersey. Specifically, residence in white areas was not associated with less coethnic network use—while these residents may benefit from a higher-income white area, it was also associated with using the ethnic networks to seek informational resources. The study resonates more with Lacy’s (Citation2004) study on strategic assimilation for middle-class Black families who chose to live in a white area but still stay connected to Black social organizations.
Finally, the findings of this study add to the literature about the nuances in information exchange in social networks and city-level racial composition. Whereas psychological studies focus on individual-level variables such as personality and attitudes, they may not connect directly to spatial factors. On the other hand, segregation literature may not examine micro-level social network interactions (i.e., interpersonal communication of information exchange) and how they are associated with residential location. Yet, these individual and spatial components inform how individual experiences interact with their place of residence as proposed by the communication infrastructure theory (CIT; Ball‐Rokeach et al., Citation2001; Y.‐C. Kim & Ball‐Rokeach, Citation2006), which accumulate to comprise our cities. While CIT research mostly examines individual residents’ perceptions of their connections to the neighborhood, this study incorporated actual characteristics such as income and education level of the city composition at the time of network data collection based on GIS technique.
6. Limitations and suggestions for future research
Future studies can assess if strategic and spatial assimilation differ for groups based on ethnic and religious identification. These processes may be disparate because of the unique historical and continuing importance of Protestant churches in Korean-American communities (Hong, Citation2003; Y. Kim & Grant, Citation1997; Kwon, Citation1997; Min, Citation1992; D. Yoo, Citation2010). For many Korean immigrants and their descendants, their ethnic identities are strongly connected to their religious identities. However, it is unknown if other groups have similar residential patterns based on their religious sites, such as Muslims and their mosques, since mosques will include individuals from a more diverse racial/ethnic background (Lee et al., Citation2018). While the data for this study are from 2011, it includes detailed communication data that are otherwise not collected and available for a complete Korean immigrant community. Other studies can also test if these patterns continue for Korean immigrant churches and if there are changes over time.
While there are some similarities and observable patterns across various Korean immigrant church communities in the US, the sample of this study is certainly not representative of all US-Korean immigrant churchgoer populations. There is a possibility that those participants who are more committed to their ethnic and religious identities would stay as church members even after their relocation (e.g., moving away from the church location). On the contrary, those who become assimilated to the host culture more quickly may leave the church after a while. Thus, the sample might be already biased in such a way by having more people who think of maintaining their ethnic/religious identities more importantly.
Furthermore, the findings may not be applicable for other forms of network connections than communication of information. Here, we focused on informational resource exchange that could be communicated through the internet or phone. Other tangible and in-person forms of support, such as childcare or being driven to an appointment may require individuals to live physically closer to the church and their ethnic networks. In other words, those who have spatially assimilated (living in cities with a concentration of white residents) may not receive certain forms of resources that require physical proximity from their coethnic community members. Future studies should examine other aspects of social support networks (e.g., emotional support, tangible help) and how they may affect spatial and strategic assimilation.
An important consideration for GIS and SNA is ethical implication about information that may reveal participant identities, either for individuals or organizations. Because GIS may include local-level addresses and SNA provides information about what type of community organization from which the network data was collected, the identity of the participating organization may become easily searchable. Consequently, researchers using these methods need to first determine what information may need to be protected if participants want to remain anonymous. For example, if individual addresses are available to researchers, GIS can be used to only display participant locations on a higher geographic level (e.g., city or town).
As social networks and race/ethnicity composition shape our communities, future studies can add to our understanding of the intersection of individual and spatial factors by tying SNA and GIS to other place-based amenities, such as school quality, housing prices, access to transportation, and entertainment options (Kalita, Citation2005; Lee, Citation2021; Lung-Amam, Citation2017). Given the limitation of geographic data that were included in the survey, future studies can also assess more granular geographic information and associations with social network analysis using our exploratory study as a framework. Finally, it was beyond the scope of our study to examine connections between individual respondents and their connections across cities. Rather, we focus on understanding group-level results and average centrality scores by city. Other studies can further build on our results to understand individual geographic connections and their centrality measures. With the advancement of communication and information technologies that enable people to connect with others from afar and telework, people’s residential choices may become more tied to where they want to live based on the aforementioned criteria, not necessarily where they have to live due to employment. How they maintain their social networks both online and offline in relation to their residential choice would be worthwhile to continue studying.
7. Conclusion
As an innovative trial, this study combined research approaches of social network analysis (SNA) and geographic information system (GIS) to examine the relationships between immigrant coethnic networks and their residential choice. The research tested the idea of spatial vs. strategic assimilation with a case of Korean immigrants in New Jersey and found members of the sampled church community applied more to the pattern of strategic assimilation. Members who lived in white areas with higher levels of media household income actively sought informational resources from their church members even from afar, whereas those who were prominent sources/providers of information lived in Asian areas closer to the church. More communication research including those implementing SNA can benefit from GIS technique especially when research questions involve gaining information about individuals’ and groups’ physical location.
Disclosure statement
The authors do not have any potential competing interests in conducting and publishing this research.
Additional information
Funding
Notes on contributors

C. Aujean Lee
C. Aujean Lee is an Assistant Professor in Regional and City Planning at the University ofOklahoma. Her research examines the production of racialized spaces and disparities inhousing, community institutions, and wealth. In particular, her research clarifies when andwhere socioeconomic outcomes related to the built environment reinforce or disrupt racialinequities, including during times of change and upheaval.
Sun Kyong Lee (Ph.D., Rutgers University) is an Associate Professor in the School of Media & Communication at Korea University, Seoul (Korea). Her research examines sociocultural antecedents, processes, and consequences of human-machine communication. She also studies various ethnic/religious immigrant social networks and their associations with interculural development and civic engagement. Her published research can be found in journals such as Communication Research, Journal of Computer-Mediated Communication, Scientific Reports, Computers in Human Behavior, and International Journal of Intercultural Relations.
Sun Kyong Lee
C. Aujean Lee is an Assistant Professor in Regional and City Planning at the University ofOklahoma. Her research examines the production of racialized spaces and disparities inhousing, community institutions, and wealth. In particular, her research clarifies when andwhere socioeconomic outcomes related to the built environment reinforce or disrupt racialinequities, including during times of change and upheaval.
Sun Kyong Lee (Ph.D., Rutgers University) is an Associate Professor in the School of Media & Communication at Korea University, Seoul (Korea). Her research examines sociocultural antecedents, processes, and consequences of human-machine communication. She also studies various ethnic/religious immigrant social networks and their associations with interculural development and civic engagement. Her published research can be found in journals such as Communication Research, Journal of Computer-Mediated Communication, Scientific Reports, Computers in Human Behavior, and International Journal of Intercultural Relations.
Notes
1. If SNA is applied to relationships among countries such as trade, then locations would have specific meanings.
2. Additional variables were tested, including other levels of education (e.g., bachelor’s, professional degree), racial composition, religious participation, and nativity status. These other variables were not statistically significant and/or had issues of multicollinearity in the regression models—they were eliminated for a parsimonious model.
3. The cities included other racial groups, with an average of 8% Blacks and 11% Latinx. In comparison, participant cities were on average 16% Asian and 63% white.
4. Moran’s I describes patterns of spatial autocorrelation based on the group concentration in the target city relative to nearby cities (Anselin, Citation1995).
References
- Aiello, G. (2011). From wound to enclave: The visual-material performance of urban renewal in Bologna’s manifattura della arti. Western Journal of Communication, 75(4), 341–21. https://doi.org/10.1080/10570314.2011.586971
- Alba, R. D., Logan, J. R., Stults, B. J., Marzan, G., & Zhang, W. (1999). Immigrant groups in the suburbs: A reexamination of suburbanization and spatial assimilation. American Sociological Review, 64(3), 446–460. https://doi.org/10.2307/2657495
- Andrews, R., Casey, M., Hardy, B. L., & Logan, T. D. (2017). Location matters: Historical racial segregation and intergenerational mobility. Economics Letters, 158, 67–72. https://doi.org/10.1016/j.econlet.2017.06.018
- Anselin, L. (1995). Local indicators of spatial association—LISA. Geographical Analysis, 27(2), 93–115. https://doi.org/10.1111/j.1538-4632.1995.tb00338.x
- Baker, D. M., & Lee, B. (2019). How does Light Rail Transit (LRT) impact gentrification? Evidence from fourteen US urbanized areas. Journal of Planning Education and Research, 39(1), 35–49. https://doi.org/10.1177/0739456X17713619
- Ball‐Rokeach, S. J., Kim, Y. ‐. C., & Matei, S. (2001). Storytelling neighborhood: Paths to belonging in diverse urban environments. Communication Research, 28(4), 392‐ 428. https://doi.org/10.1177/009365001028004003
- Basolo, V., & Nguyen, M. T. (2009). Immigrants’ housing search and neighborhood conditions: A comparative analysis of housing choice voucher holders. Cityscape, 11(3), 99–126. https://www.jstor.org/stable/20868716
- Bohon, S. (2013). Latinos in ethnic enclaves: Immigrant workers and the competition for jobs. Routledge.
- Bonacich, P. (1987). Power and centrality: A family of measures. American Journal of Sociology, 92(5), 1170–1182. https://doi.org/10.1086/228631
- Borgatti, S. P., Everett, M. G., & Freeman, L. C. (2002). Ucinet 6 for windows: Software for social network analysis. Harvard, MA: Analytic Technologies. https://sites.google.com/site/ucinetsoftware/downloads.
- Broad, G. M., Gonzalez, C., & Ball-Rokeach, S. J. (2014). Intergroup relations in South Los Angeles – Combining communication infrastructure and contact hypothesis approaches. International Journal of Intercultural Relations, 38, 47–59. https://doi.org/10.1016/j.ijintrel.2013.06.001
- Brown, S. K. (2006). Structural assimilation revisited: Mexican-origin nativity and cross-ethnic primary ties. Social Forces, 85(1), 75–92. https://doi.org/10.1353/sof.2006.0118
- Buendía, E., Ruiz, A., Martinez, A. G., Sykes, E., & Fisk, P. (2017). Latino neighborhood choice. In N. Ares, E. Buendía, & R. Helfenbein (Eds.), Deterritorializing/reterritorializing: Critical geography of educational reform (pp. 233–250). Brill Sense. https://doi.org/10.1007/978-94-6300-977-5
- Charles, C. Z. (2003). The dynamics of racial residential segregation. Annual Review of Sociology, 29(1), 167–207. https://doi.org/10.1146/annurev.soc.29.010202.100002
- Che, Y., Yang, K., Jin, Y., Zhang, W., Shang, Z., & Tai, J. (2013). Residents’ concerns and attitudes toward a municipal solid waste landfill: Integrating a questionnaire survey and GIS techniques. Environmental Monitoring and Assessment, 185(12), 10001–10013. https://doi.org/10.1007/s10661-013-3308-y
- Choldin, H. M. (1973). Kinship networks in the migration process. International Migration Review, 7(2), 163–176. https://doi.org/10.1177/019791837300700203
- Cromley, E. K., & McLafferty, S. L. (2011). GIS and public health. Guilford Press.
- DeBats, D. A., & Gregory, I. N. (2011). Introduction to historical GIS and the study of urban history. Social Science History, 35(4), 455–463. https://doi.org/10.1017/S0145553200011639
- Emirbayer, M. (1997). Manifesto for a relational sociology. American Journal of Sociology, 103(2), 281–317. https://doi.org/10.1086/231209
- Espiritu, Y. L. (1992). Asian American panethnicity: Bridging institutions and identities. Temple University Press.
- Gao, J., & Liu, Y. (2001). Applications of remote sensing, GIS and GPS in glaciology: A review. Progress in Physical Geography: Earth and Environment, 25(4), 520–540. https://doi.org/10.1177/030913330102500404
- Goldenberg, S., & Haines, V. (1992). Social networks and institutional completeness: From territory to ties. Canadian Journal of Sociology, 17(3), 301–302. https://doi.org/10.2307/3341325
- Gordon, M. M. (1964). Assimilation in American life: The role of race, religion, and national origins. Oxford University Press.
- Grimmond, C. S. B., & Souch, C. (1994). Surface description for urban climate studies: A GIS-based methodology. Geocarto International, 9(1), 47–59. https://doi.org/10.1080/10106049409354439
- Halogua, G. (2011). The policy and export of ubiquitous place: Investigating South Korean U-cities. In M. Foth, L. Forlano, C. Satchell, & M. Gibbs (Eds.), From social butterfly to engaged citizen: Urban informatics, social media, ubiquitous computing, and mobile technology to support citizen engagement (pp. 315–333). MIT Press.
- Halogua, G. (2020). Smart cities. MIT press.
- Hanna, M., & Batalova, J. (2021). Immigrants from Asia in the United States. Spotlight from Migration Information Source of Migration Policy Institute, Retreived from https://www.migrationpolicy.org/article/immigrants-asia-united-states-2020
- Haug, S. (2008). Migration networks and migration decision-making. Journal of Ethnic and Migration Studies, 34(4), 585–605. https://doi.org/10.1080/13691830801961605
- Hong, Y. G. (2003). Encounter with modernity: The “McDonaldization” and “charismatization” of Korean mega-churches. International Review of Mission, 92(365), 239–255. https://doi.org/10.1111/j.1758-6631.2003.tb00401.x
- Hurh, W. M., & Kim, K. C. (1984). Adhesive sociocultural adaptation of Korean immigrants in the US: An alternative strategy of minority adaptation. International Migration Review, 18(2), 188–216. https://doi.org/10.1177/019791838401800201
- Intrator, J., Tannen, J., & Massey, D. S. (2016). Segregation by race and income in the United States 1970–2010. Social Science Research, 60, 45–60. https://doi.org/10.1016/j.ssresearch.2016.08.003
- Janjuha-Jivraj, S. (2003). The sustainability of social capital within ethnic networks. Journal of Business Ethics, 47(1), 31–43. https://doi.org/10.1023/A:1026288811107
- Kadushin, C. (2012). Understanding social networks: Theories, concepts and findings. Oxford University Press.
- Kalita, S. M. (2005). Suburban sahibs: Three immigrant families and their passage from India to America. Rutgers University Press.
- Kim, Y. (2001). Becoming intercultural: An integrative theory of communication and cross-cultural adaptation. Sage Publications.
- Kim, Y. ‐. C., & Ball‐Rokeach, S. J. (2006). Community storytelling network, neighborhood context, and civic engagement: A multilevel approach. Human Communication Research, 32(4), 411–439. https://doi.org/10.1111/j.1468‐2958.2006.00282.x
- Kim, Y., & Grant, D. (1997). Immigration patterns, social support, and adaptation among Korean immigrant women and Korean American women. Cultural Diversity and Mental Health, 3(4), 235. https://doi.org/10.1037/1099-9809.3.4.235
- Krysan, M., & Crowder, K. (2017). Cycle of segregation: Social processes and residential stratification. Russell Sage Foundation.
- Kwon, V. H. (1997). Entrepreneurship and religion: Korean immigrants in Houston, Texas. Routledge.
- Kwon, H. Y., Kim, K. C., & Warner, R. S. (Eds.). (2001). Korean Americans and their religions: Pilgrims and missionaries from a different shore. Pennsylvania State University Press.
- Lacy, K. R. (2004). Black spaces, black places: Strategic assimilation and identity construction in middle-class suburbia. Ethnic and Racial Studies, 27(6), 908–930. https://doi.org/10.1080/0141987042000268521
- Lee, S. K. (2014). The impact of social capital in ethnic religious communication networks on Korean immigrant’s intercultural development. International Journal of Intercultural Relations, 43(B), 289–303. https://doi.org/10.1016/j.ijintrel.2014.10.001
- Lee, S. K. (2017). Refining a theory of cross-cultural adaptation: An exploration of a new methodological approach to institutional completeness. Asian Journal of Communication, 28(3), 315–334. https://doi.org/10.1080/01292986.2017.1396619
- Lee, C. A. (2018). Heterogeneity in income: Effects of racial concentration on foreclosures in Los Angeles, California. Housing Policy Debate, 28(6), 940–962. https://doi.org/10.1080/10511482.2018.1494026
- Lee, C. A. (2021). “Working towards a better future for ourselves”: Neighborhood choice of middle-class Latino and Asian homeowners in Los Angeles. Journal of Urban Affairs 43(7), 941–959. https://doi.org/10.1080/07352166.2019.1657022
- Lee, S. K., Piercy, C. W., Massey, Z., Franklyn, A., & Gilmore, B. (2018). Immigrant social capital and intercultural development: A case of U.S. muslim immigrants. Paper Presented at the Annual Conference of the National Communication Association, Salt Lake City, UT.
- Lee, J., & Zhou, M. (2015). The Asian American achievement paradox. Russell Sage Foundation.
- Li, W. (1998). Anatomy of a new ethnic settlement: The Chinese ethnoburb in Los Angeles. Urban Studies, 35(3), 479–501. https://doi.org/10.1080/0042098984871
- Logan, J. R. (2017). Racial segregation in postbellum Southern cities: The case of Washington, D.C. Demographic Research, 36, 1759–1784. https://doi.org/10.4054/DemRes.2017.36.57
- Ludwig, J., & Raphael, S. (2010). The mobility bank: Increasing residential mobility to boost economic mobility. Brookings Institute. https://gspp.berkeley.edu/assets/uploads/research/pdf/p61.pdf
- Lung-Amam, W. (2017). Trespassers?: Asian Americans and the battle for suburbia. University of California Press.
- Marin, A., & Hampton, K. N. (2007). Simplifying the personal network name generator: Alternatives to traditional multiple and single name generators. Field Methods, 19(2), 163–193. https://doi.org/10.1177/1525822X06298588
- Marten, L., Hainmueller, J., & Hangartner, D. (2019). Ethnic networks can foster the conomic integration of refugees. Proceedings of the National Academy of Sciences, 116(33), 16280–16285. https://doi.org/10.1073/pnas.1820345116
- Massey, D. S., & Denton, N. A. (1985). Spatial assimilation as a socioeconomic outcome. American Sociological Review, 50(1), 94–106. https://doi.org/10.2307/2095343
- Mesch, G. S. (2002). Between spatial and social segregation among immigrants: The case of immigrants from the FSU in Israel. International Migration Review, 36(3), 912–934. https://doi.org/10.1111/j.1747-7379.2002.tb00109.x
- Min, P. G. (1992). The structure and social functions of Korean immigrant churches in the United States. International Migration Review, 26(4), 1370–1394. https://doi.org/10.1177/019791839202600413
- Min, P. G., & Kim, C. (2010). Growth of the Korean population and changes in their settlement patterns over time, 1990-2008. Research Center for Korean Community, Queens College of CUNY. Settlement Patterns.
- Modesti, S. (2008). Home sweet home: Tattoo parlors as postmodern spaces of agency. Western Journal of Communication, 72(3), 197–212. https://doi.org/10.1080/10570310802210106
- Monge, P. R., & Contractor, N. S. (2003). Theories of communication networks. Oxford University Press.
- Nah, S., & Yamamoto, M. (2017). Civic technology and community building: Interaction effects between integrated connectedness to a storytelling network (ICSN) and Internet and mobile uses on civic participation. Journal of Computer-Mediated Communication, 22(4), 179–195. https://doi.org/10.1111/jcc4.12189
- Nedović-Budić, Z. (1998). The impact of GIS technology. Environment and Planning B: Planning and Design, 25(5), 681–692. https://doi.org/10.1068/b250681
- Nee, V., Sanders, J. M., & Sernau, S. (1994). Job transitions in an immigrant metropolis: Ethnic boundaries and the mixed economy. American Sociological Review, 59(6), 849–872. https://doi.org/10.2307/2096372
- Nguyen, M. T. (2004). The self-segregation of Asians and Hispanics: The role of assimilation and racial prejudice. Race and Society, 7(2), 131–151. https://doi.org/10.1016/j.racsoc.2005.05.006
- Park, K. (1997). The Korean American dream: Immigrants and small business in New York City. Cornell University Press.
- Park, Y. (2005). The immigrant workers union: Challenges facing low-wage immigrant workers in Los Angeles. Asian Law Journal, 12, 67–101.
- Petzold, R. (1994). Yielding the benefits of GIS. American City and County, 109(3), 56–63.
- Portes, A., & Sensenbrenner, J. (1993). Embeddedness and immigration: Notes on the social determinants of economic action. American Journal of Sociology, 98(6), 1320–1350. https://doi.org/10.1086/230191
- Rushton, G. (2003). Public health, GIS, and spatial analytic tools. Annual Review of Public Health, 24(1), 43–56. https://doi.org/10.1146/annurev.publhealth.24.012902.140843
- Sanders, J. M., & Nee, V. (1987). Limits of ethnic solidarity in the enclave economy. American Sociological Review, 52(6), 745–773. https://doi.org/10.2307/2095833
- Sanders, J. M., & Nee, V. (1996). Immigrant self-employment: The family as social capital and the value of human capital. American Sociological Review, 61(2), 231–249. https://doi.org/10.2307/2096333
- Sanders, J., Nee, V., & Sernau, S. (2002). Asian immigrants’ reliance on social ties in a multiethnic labor market. Social Forces, 81(1), 281–314. https://doi.org/10.1353/sof.2002.0058
- Schwartz, R., & Halegoua, G. R. (2015). The spatial self: Location-based identity performance on social media. New Media & Society, 17(10), 1643–1660. https://doi.org/10.1177/1461444814531364
- Scott, J. (2000). Social network analysis (2nd ed.). Sage.
- Scott, L. M., & Getis, A. (2008). Spatial statistics. In K. Kemp (Ed.), Encyclopedia of geographic information science (pp. 437–440). SAGE Publications, Inc.
- South, S. J., Crowder, K., & Pais, J. (2008). Inter-neighborhood migration and spatial assimilation in a multi-ethnic world: Comparing Latinos, Blacks and Anglos. Social Forces, 87(1), 415–443. https://doi.org/10.1353/sof.0.0116
- Sui, D. Z. (1995). A pedagogic framework to link GIS to the intellectual core of geography. Journal of Geography, 94(6), 578–591. https://doi.org/10.1080/00221349508979371
- Topinka, R. J. (2016). Race, circulation, and the city: The case of the Chicago city sticker controversy. Western Journal of Communication, 80(2), 163–184. https://doi.org/10.1080/10570314.2016.1139173
- Vall, M. T. (2012). Reconstructing the lost cause in the Memphis City Parks renaming controversy. Western Journal of Communication, 76(4), 417–437. https://doi.org/10.1080/10570314.2011.651257
- Walton, E. (2015). Making sense of Asian American ethnic neighborhoods: A typology and application to health. Sociological Perspectives, 58(3), 490–515. https://doi.org/10.1177/0731121414568568
- Wasserman, S., & Faust, K. (1994). Social network analysis: Methods and applications. Cambridge University Press.
- Wilhoit, E. D. (2018). Affordances as material communication: How the spatial environment communicates to organize cyclists in Copenhagen, Denmark. Western Journal of Communication, 82(2), 217–237. https://doi.org/10.1080/10570314.2017.1306098
- Wilkin, H. A. (2013). Exploring the potential of communication infrastructure theory for informing efforts to reduce health disparities. Journal of Communication, 63(1), 181–200. https://doi.org/10.1111/jcom.12006
- Wong, Y.-L. I., & Hillier, A. E. (2001). Evaluating a community-based homelessness prevention program. Administration in Social Work, 25(4), 21–45. https://repository.upenn.edu/spp_papers/39
- Wright, R., Ellis, M., & Parks, V. (2005). Re‐placing whiteness in spatial assimilation research. City & Community, 4(2), 111–135. https://doi.org/10.1111/j.1540-6040.2005.00107.x
- Wu, S.-Y. (2012). New Jersey’s Asian population by Asian group: 2010. New Jersey Department of Labor and Workforce Development. https://nj.gov/labor/lpa/pub/lmv/lmv_18.pdf
- Yang, D. H., Goerge, R., & Mullner, R. (2006). Comparing GIS-based methods of measuring spatial accessibility to health services. Journal of Medical Systems, 30(1), 23–32. https://doi.org/10.1007/s10916-006-7400-5
- Yoo, J. K. (2000). Utilization of social networks for immigrant entrepreneurship: A case study of Korean immigrants in the Atlanta area. International Review of Sociology, 10(3), 347–363. https://doi.org/10.1080/03906700020014422
- Yoo, D. (2010). Contentious spirits: Religion in Korean American history, 1903-1945. Stanford University Press.
- Zhou, M. (1992). Chinatown: The socioeconomic potential of an urban enclave. Temple University Press.