
 ?Mathematical formulae have been encoded as MathML and are displayed in this HTML version using MathJax in order to improve their display. Uncheck the box to turn MathJax off. This feature requires Javascript. Click on a formula to zoom.
Abstract
The study identified the variables that affect rural-urban migration and how it impacts the stability of household livelihood. Descriptive statistics, ivprobit regression, and the dose response function were all used to examine the data. Livestock holding, family size, access to information, number of cultivated fields, soil infertility, distance in kilometers to the nearest town, and distance in kilometers to the farmer training centers were the factors driving rural-urban migration. The impact of remittances on household livelihood security is positive and improved over time with relatively broad confidence ranges. It increased the livelihood security of migrant-sending households by 13.6% and the overall population by 10.99%. Higher levels of remittance had a greater impact on household livelihood security with a 40% local minimum dose. Stakeholders were given a list of policy issues and strategies for dealing with the underlying causes of rural-urban migration and maximize remittance gains.
PUBLIC INTEREST STATEMENT
Several households in developing countries support migration as a tactic to fight poverty (FAO, Citation2019; WB, Citation2016). Migration, particularly the rural-to-urban one, is influenced by several factors and has ex-post impacts in sending communities positively or negatively (Sylvie, Citation2015). Ex-post effects of migration can be divided into two categories: the lost-labor effect and remittance effects (Lewis, Citation1954). To develop effective policies for alleviating poverty and successfully managing migration, policymakers need analytical data on the causes of migration and its effects on household livelihoods. The research topic is quite popular among social scientists all around the world. Due to the complexity of the subject, many researchers employ a variety of methods and generate a wide range of conclusions. However, there is a dearth of analytical information on the topic in the research area. Given that, our study quantifies the issues and offers specific recommendations.
1. Introduction
While considering development, one of the many multifaceted issues that grab the attention of experts and decision-makers is migration. The UN’s 2030 Sustainable Development Goals prominently highlight both the benefits and drawbacks of migration. Currently, a massive number of people are migrating either inside or abroad (Hua & Zhuang, Citation2019; Michele & Domenica, Citation2020). Internal migrants outweigh those migrating beyond their national boundaries by a large margin (Alem et al., Citation2016; IOM, Citation2017; UNDESA, Citation2019). Internal migration streams are classified as rural-to-rural, rural-to-urban, urban-to-urban, and urban-to-rural. Among the aforementioned internal migrations, migration from rural to urban areas has recently become more common in emerging countries (FAO, Citation2018a; IOM, Citation2017). Three key factors are usually credited to the world’s rising human migration, whether domestic or international (IOM, Citation2017; WB, Citation2016). The first attribute is a rise in the adolescent population, particularly in rural areas. The second is the issue of labor shortages in advanced economies, and the third is linked to the pay disparity between different places (Lewis, Citation1954; Michele & Domenica, Citation2020; Timmer, Citation2014). For so many decades, several developing countries have faced demographic and food insecurity challenges, which are also more severe in the rural areas (Citation2016; WB, Citation2015). This enforced a number of rural households have decreased poverty by sending migrants to cities within the country or abroad (WB, Citation2008).
Population pressure and insufficient food access (FAO, Citation2016), household poverty (Weldegebrial & Beyene, Citation2012), insufficient income and fragmented landholding (Bezu & Holden, Citation2014), ecological degradation and drought (Berhanu & Michael, Citation2000; Clark & Valerie, Citation2012), resettlement policies of the government (H. Laura, Citation2008; Kassa, Citation2004), and other job openings (Tesfahun et al., Citation2008) are the primary motivators for rural-urban migration in Ethiopia. Furthermore, access to social media and social networks has contributed to the increased rural-urban migration in Ethiopia (de Brauw et al., Citation2014; Tafere et al., Citation2017), as they play a key role in disseminating migrants’ success stories.
The two most common post-hoc effects of migration are the lost-labor effect and the remittance effect. Optimists who think about migration often believe that migration is the most effective way to reduce household poverty and reclaim labor lost through remittance. Households with remittances, according to them, are always in better condition and have higher income levels than non-migrant households (Bezon, Citation2019; Redehegn et al., Citation2019; Wurku & Joyce, Citation2019). In terms of purchasing habits, a number of studies have found that migrant-sending households with remittances are more willing to spend on long-lasting goods and productive assets than non-migrant households (Gedefaw, Citation2018; Wurku & Joyce, Citation2019; Yousra & Julie, Citation2016). Richard (Citation1998), Entwisle and Tong (Citation2005), Ford et al. (Citation2007), and Garip (Citation2007) explored a positive mean difference in household livelihood asset accumulation among migrant-sending versus non-migrant households. Pessimists, on the other hand, claim that rural-urban migration reduces family labor force and thus has an adverse effect on migrant-sending households’ farming ability. According to them, no amount of remittance flow from migrants to the households can compensate for the value of lost labor. Bhandari and and Reddy (Citation2015), Mazambani (Citation1990), Taylor et al. (Citation1999), and Birgit and Claudia (Citation2008) all found evidence to support pessimistic viewpoints.
There is a well-known proverb about Gurage migrants that says, “There is no place in Ethiopia where you cannot see Land Rovers and Gurage migrants.” Many rural households in the study area are attempting to send migrants to cities across the country in order to reduce their vulnerability to food insecurity and the high risk of food shortages (Neda, Citation2007; Nida, Citation1995; Tadele et al., Citation2006). As a result, for many rural individuals seeking work, rural to urban migration is becoming a practical choice. Due to the desire for short-term gains from migration, a number of rural households refrain from sending their children to higher or technical education. In the study area, previous researchers such as Nida (Citation1995), Tadele et al. (Citation2006), and Neda (Citation2007) were unable to discern the ex-ante and ex post conditions of rural-urban migration quantitatively. Several studies (Abad et al., Citation2017; Bezon, Citation2019; Wurku & Joyce, Citation2019) have been conducted to determine the effect of remittances on household poverty; however, the studies have assumed that the effect is uniformly distributed across all households with migrants. Literature in the area of examining the effect of such continuous treatment that employs rigorous methodological approach is scarce. As a result, the study is expected to be relevant, both theoretically and empirically. Two main research questions were identified with the aim of completing the intended objectives: What are the primary factors that influence rural-urban migration? And what impact does remittance have on the livelihood of rural households in the research area?
2. Materials and methods
2.1 Study area description
Gurage zone is one of the zonal administrations in Ethiopia’s Southern Regional State, and it is located between 7 0 40“and 8 0 30” north and 37 0 30“and 38 0 40” east (Figure ). It covers an area of 5932 km2 and is home to a diverse population that primarily speaks Guragigna (Agza et al., Citation2021; Zerga et al., Citation2021). The zone’s elevation ranges from 1,000 to 3,638 meters, and its agro-ecology is divided primarily into highland, midland, and lowland (Zerga et al., Citation2021). The agro-ecological zones of the mid-highland, highland, and lowland, respectively, cover 65.5 percent, 31.6 percent, and 3.1 percent of the zone’s total area (Gebretsadik et al., Citation2018).
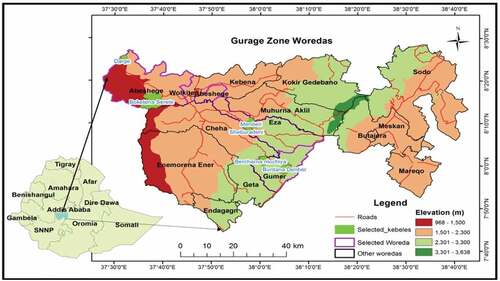
The zone’s total population and number of households were 1,280,483 and 286,328, respectively, with an average person in a household of 4.7 (CSA, Citation2007). Males make up 48.6% of the zone’s total population, while females make up 51.4%. As reported in the same source, agriculture employs 95% of the rural population in the study. Mixed farming, which includes crop and livestock production, is a major rural livelihood. In contrast, its contribution to household income and employment has varied and is declining over time (Agza et al., Citation2021). As a result, many households are looking into other options for coping with poverty, one of which is rural-urban migration (Tadele et al., Citation2006).
2.2 Samples and sampling methods
The samples were selected using a multistage sampling technique after the required sample size was determined based on Cochran’s (Citation1963) formula. The Gurage zone was purposefully chosen from other zones in Ethiopia in the first stage of sampling because it is well-known for human migration from rural areas of the zone to cities throughout the country (Agza et al., Citation2021; Nida, Citation1995). Following that, the zone’s districts were divided into three groups based on agro-ecological characteristics: lowland, midland, and highland. Then, three sample districts were drawn at random from each of the three agro-ecological strata. Finally, six rural kebeles are arbitrarily selected from the three districts, and sample households are drawn at random from the kebeles using a proportional size assumption. The sample size was estimated by assigning a 95% confidence level, a 5% error, a 1.96 Z-value derived from statistical tables, and a proportional value of 0.5 for maximum variability (p), i.e., q or 1-p equals 0.5. Consequently, the sample size was projected as follows:
2.3 Source of data, methods of collection, and analysis
Cross-sectional primary data on the various socio-economic variables and the indicators of livelihood security indexes were meticulously collected from the sample households through a questionnaire-based interview. The ivprobit model and the dose response function were used to determine the primary determinants of rural-urban migration and to assess the effect of remittance on the livelihood security index, respectively. The ivprobit model was chosen because, unlike most other dual models, it includes endogenous repressors for estimating the values of missing variable values within a model, measurement error in the independent variables, and reverse causality (Alem et al., Citation2016). StataCorp (Citation2013) defined the endogenous ivprobit model as follows:
Where: i = 1 … N, is the treatment variable, with values of 1 and 0 for migrant-sending and non-migrant households, respectively. Y
is the exogenous variable a 1×P vector. A 1 × K is a vector of exogenous variable lists denoted by xi. A 1 × K is vector of exogenous variables denoted by
. X
is a 1×K
the instrumental variable’s vector, and
is the first ivprobit regression result and its reduced-form equation. Assume that (
) ~ N (0, ∑), in which
is standardized to one to recognize the model.
are structural parameter vectors, and
are decreased-form parameter matrices. The model is recursive because
appears in the equation but y2 does not appear in the equation for y1. The model is recursive as
shown in the equation
did not shown in the equation for
.
We don’t see (the second stage ivprobit regression) but, we see
The criteria for detecting structural parameter requires ≥ p appears not to be blocked diagonally between
and ∑; otherwise,
would be exogenous.
However, a dose response function (DRF) was used to evaluate the impact of remittance on household livelihood security. Remittance in Ethiopian Birr was used as a treatment variable, and the livelihood security index was used as an outcome variable. In the analysis, we considered several doses of treatment ranging from 0 to 100 for the untreated and treated observations. The analysis was based on a continuous dose, with y representing the outcomes of treated observations and y
representing the outcomes of untreated observations. We defined
as the treatment indicator with 1 and 0 representing treated and untreated observations, respectively, and x = (x1i, x2i, X3i… xi) as a set of vectors of K observed variables for I = 1… K. In response to the confounding variable xi, two separate functions (g0 (x) and g1 (x)) were used for the untreated and treated units, correspondingly. Using the above data and assuming a parametric form of g
(x)
, g
(x)
, and conditional on x, the dose response function was estimated as follows:
Where ATT+ (h (t)-) at t > 0 and ATNT at t = 0 represented the results of treated and untreated observations, respectively. Finally, to obtain accurate estimates of all the above parameters, we used a regression approach based on the Ordinary Least Squares method with the assumption of unconfoundedness or CMI (Conditional Mean Independence). The regression line of the outcome variable y has been obtained as follows: using the supplied observable exogenous confounders x, treatment indicator w, and treatment intensity t, the regression line of the outcome variable y has been obtained as follows:
Where,
2.4 Definitions of variables
This section defines and summarizes the major characteristics of the dependent and independent variables in the study. The variable’s operational definitions are provided below.
Rural-urban migration
This is an outcome variable defined as the migration of household members from rural parts of the Gurage zone to various towns throughout the country in search of employment for more than six months. The rural household was called a “migrant-sending household” because at least one of its members migrated to cities for various reasons; otherwise, it was called a “non-migrant household.”
Livelihood security index
This variable is a composite index that assesses households’ social and economic well-being in relation to the Sustainable Livelihood Approach (Sanzidur & Shaheen, Citation2010). Children’s education, medical needs, drinking water, electricity, multiple rooms, multiple communication assets, and household level bathrooms were used to create the index. We treated all of the indicators as dummy variables and did not standardize them (Kamaruddin & Samsudin, Citation2014). Then, for each household, a livelihood security index was calculated by weighting all of the indicators equally. The derived index value was a continuous variable, and its relationship with remittance was investigated. The index was calculated as follows:
Where n denotes the number of indicators used to generate the index and j denotes the sum of the indicators’ successes.
Remittance
In this study, remittances are defined as all monetary and non-monetary transfers of cash and other materials made by migrants to left-behind households in rural areas. The variable was treated as a continuous variable and was predicted to have a positive effect on the livelihood security of migrant-sending households.
Household head’s age
This is a variable that is continuously measured over time and was predicted to be directly related to the outcome variable. We predicted that the older the head of the household, the more likely he or she would have more children, and thus the greater the likelihood of rural-urban migration.
Household head’s sex
This is a dummy variable with a value of 1 if the head is male and 0 if it is not. In this study, we predicted that houses led by men would be more migratory than houses led by women.
Household head’s education
The variable was treated as continuous, with years of schooling as the unit of measurement, and it was expected to be inversely related to household members’ rural-urban migration.
Household head’s religion
Religion was treated as a dummy variable, with a value of 1 if the head of the household was Christian and a value of 0 otherwise. It was expected that there would be a direct relationship between it and household member migration.
Household head’s ethnicity
This variable was treated as dummy, one if the head was Gurage and zero otherwise, and we expected a direct relationship between it and rural household migration.
Family size
This variable is continuous and was calculated by adding the number of household members prior to migration, and we expected that larger households would have more migrants.
Access to information
This is a dummy variable that is 1 if the household has access to different communication assets and 0 otherwise, and we expected it to be related to household member migration positively.
Landholding size
This is a continuous variable in acres that was predicted to have a negative relationship with rural-household migration.
Soil infertility problem
Normally, soil fertility is assessed directly via chemical analysis; however, farmers can also assess soil fertility indirectly by monitoring the development and output of their crops (Boonchan & Preston, Citation2004). The variable is treated as a dummy and given a value of 1 if the household is having the problem and a value of 0 otherwise, assuming the indirect approach. We presented a hypothesis that suggested a clear connection between household member migration and issues with soil fertility.
Livestock holding in TLU
This continuous variable represents livestock numbers prior to household member migration, converted into a common unit using a conversion factor of 1 for cows, 1.1 for oxen, 0.8 for heifers, 0.3 for a calf, 0.1 for sheep and goats, 1 for horse and mule, 0.7 for donkey, and 0.01 for chickens (Naseri & Kabul, Citation2005).
The size of cultivated fields
This continuous variable represents the average size of cultivations within the agricultural lands of the sample households and we expected that households with a greater size of cultivated fields would be less likely to send migrants to urban areas.
Agro-ecology
The variable was created as a dummy variable that was set to 1 if the household was located in the lowland agro-ecological zone and 0 otherwise. It was used as a predictor of rural-urban migration and as an instrumental variable for livestock ownership, with the expectation of an indirect and direct relationship.
Distance in kilometers to the nearest town
The distance between the sample households’ dwelling and the nearest city was determined by this continuous variable, which was predicted to have a negative relationship with rural households.
Distance in kilometers to the nearest secondary school
This is a continuous variable that measured the distance between the rural households’ residences and the nearest available secondary school. It was anticipated that the variable would have a linear relationship with rural-household migration.
Distance in kilometers to farmer training centers
The distance between the rural household’s home and the nearest farmer training center, where the farmer can obtain a variety of advisory services (Alemayehu, Citation2010), is a continuous variable. The greater the distance between the two locations, the less benefit the household would receive from the services, raising the possibility of rural-urban migration.
3. Results and discussion
This section discusses the study’s findings in light of the research questions. The results are explained with different descriptive statistics, inferential statistics and various econometric models. To predict the relationship between dummy and continuous independent variables and migration, inferential statistics tests like the t-test and Chi-square were used. The ivprobit regression model was used to explain the household-level factors influencing rural-urban migration. A dose response function was also used to investigate the effect of remittance on the livelihood security index of migrant-sending households.
3.1 A category of sample households based on the research variables
In this study, households with migrants made up 55.7% of the total, while non-migrant households made up 44.3%. Tables show how the outcome is related to the continuous and discrete independent variables, respectively. The age of the household head, household size, landholding, livelihood security index, distance to the nearest town, and distance to the nearest secondary school are all continuous explanatory variables that have been found to be significantly correlated with rural-household migration (see Table ).
Table 1. The association of continuous variables with rural-urban migration
Table 2. Correlation between rural-urban migration and categorical variables
With a significance level of 1%, the age of the head of the migrant-sending household was 4.6 years older than the age of the head of the non-migrant household. This study’s findings are consistent with prior research, which discovered that the heads of migrant-sending households were older and more educated than non-migrant household heads. (D. Laura & Elisenda, Citation2016; Herrera & Sahn, Citation2013). At a 1% significance level, a statistically significant mean difference in family size was identified between migrant-sending and non-migrant households. Prior to migration, the average family size in migrant-sending households was larger than the average family size in non-migrant households. Migrants make up 27.7% of the population in total sample households and 46.6% of the population in migrant-sending households. The size of the landholding and the amount of livestock held in TLU were also used as indicators of the respondents’ wealth. At the 1% significance level, there was a higher mean difference in landholding size between the two groups. The mean difference in livestock holding between the two household groups, however, was significant. Non-migrant households fared better in terms of landholding and livestock ownership, with a higher proportion in the lowland agro-ecological zone. The findings support the economic theory of migration, which anticipated that the ownership of productive assets such as land, cattle, machinery, and equipment would be a determining factor in household migration (de Brauw et al., Citation2013; Waddington & Sabates-Wheeler, Citation2003).
A greater mean difference in the livelihood security index was observed between the two groups at the 1% significance level. The analysis found that migrant-sending households have a larger average livelihood security index, ranging from 0.43 to 1, with a mean of 0.85 and a standard deviation of 0.148. Non-migrant households, on the other hand, have a livelihood security index that ranges from 0.143 to 1, with a mean of 0.69 and a standard deviation of 0.177. The average livelihood security index for all of the households studied was 0.782, with a standard deviation of 0.18. As a result, household livelihood security is often linked to the presence of a migrant family member, as family members’ mobility is justified to help alleviate poverty and hunger by raising household knowledge of future threats (De Haas, Citation2007; FAO, Citation2019). Finally, Table shows the relationship between rural households’ migration status and the locations of key services in the research area. At the 1% and 5% significance levels, respectively, the t-tests reveal a significant mean difference between the two household groups in terms of distance to the nearest town and secondary school. In terms of distance to a neighboring FTC, however, there is no significant difference between the household groups.
Table shows the predicted value of the Chi-square test to confirm the correlations of dummy variables with household member migration. Along with demographic factors, the gender of the household head had no effect on household migration. However, at 1% and 5% levels of significance, household heads’ religion and ethnicity were statistically associated with rural household migration, respectively. Christian households are more likely to send migrants than other households in the study, in absolute terms. At the 1% significance level, Gurage people were more likely to migrate than others in terms of ethnicity. Table further summarizes the comparisons of respondents based on their households’ access to key indices of livelihood security. The ability to meet medical needs, access to drinking water, electricity, more than two rooms, more than one communication asset, and access to a toilet at the household level are all indices. The evaluated factors were strongly connected to the migration of a household member at the 1% significance level. As a result, with the exception of children’s schooling, all the selected livelihood security indicators showed that migrant-sending households own more valued material assets than non-migrant sending households.
Agro-ecology was also mentioned as a factor in rural-urban migration. The study found that the intensity of household migration varied greatly across the agro-ecological zones and it was statistically significant at 1%. According to the survey, 89.25% of migrant-sending households lived in agro-ecological zones other than the lowland. However, migrant-sending households made up only 10.75% of the sample households in the lowlands. Table also shows that the respondents’ soil infertility is strongly related to member migration at the 1% level of significance. The vast majority of migrant-sending households, according to the analysis, were predisposed to soil infertility, with 72.8% sending migrant family members.
3.2 Determinants of rural-urban migration
Following a multicollinearity test, the relationship between the outcome variable and the explanatory variables was investigated using standard probit regression. Except for four explanatory variables (livestock holding, household head’s education, size of cultivation, and distance to nearest town), all explanatory variables were significantly related to household members’ migration in this model (see Table ). Because the ivprobit model is more powerful than conventional probit regression (Statacorp, Citation2013), it was used to identify the potential driving factors of rural-urban migration. The livestock holding was chosen as an endogenous variable in the ivprobit model because it was extremely insignificant in comparison to other variables and displayed a theoretically unexpected sign in the conventional probit model. Agro-ecology was chosen as an instrumental variable to explain the endogeneity of livestock holding in rural-urban migration because it influences breed types, altitude, and land availability, all of which are beneficial to maintaining intensive livestock production in rural areas (Njonge, Citation2017). A Wald test for the exogeneity of the instrumental variable confirmed this, as the test statistic is significant (p-value = 0.0000). A number of factors that influence rural-to-urban migration have been identified, and the most important ones are summarized below.
Table 3. Determinants of rural-urban migration
In this study, livestock ownership was chosen as a metric of household income in rural communities and was used as an endogenous variable. However, because previous data on livestock holding for various time periods could not be obtained, the study is based solely on data from the current period. If the data was correct before a household member migrated, the variable was significantly related to the extent of rural-urban migration at a 1% level, and the relationship was discovered to be negative. When all other variables were held constant, increasing livestock holding by one unit reduced the likelihood of rural-urban migration by 15.33%. The possible justification is that adequate livestock holding by households increases household income and results in a lower rate of rural-urban migration because households believe they can meet cumulative food consumption needs throughout the year. Another possibility is that increased livestock ownership necessitates more labor for livestock management, absorbing surplus labor and creating labor shortages in the household, reducing the likelihood of rural-urban migration. Assefa and Eshetu (Citation2017), Iritani (2018) and Otte et al. (Citation2012) also found an inverse relationship between livestock ownership and rural-urban migration. Their studies have revealed that increasing livestock holdings can help to alleviate poverty by reducing the likelihood of rural-urban migration.
At a 1% significance level, family size was found to have a direct relationship with the migration of household members from rural to urban areas. This study discovered that households with one more person were 6.03% more likely to participate in rural-urban migration, assuming all other factors remained constant. The possible reason for this is that when family size grows, household per capita income declines, forcing family members to migrate to find work elsewhere. Assefa and Eshetu (Citation2017), Eshetu and Beshir (Citation2017), Thorat et al. (Citation2011), Ratha et al. (Citation2011), and Agesa and Kim (Citation2001) all agreed with the study’s findings, demonstrating that densely populated households were more likely to migrate to secure their household livelihood. Furthermore, the size of a family and the size of a landholding are inextricably linked, influencing rural-urban migration. Due to the inverse relationship between landholding size and family size, densely populated households would have overexploited agricultural land and lower agricultural income, both of which are major factors in rural-urban migration (Francesco, Citation2018). Households would be unable to engage in labor-intensive farming if the land was divided into multiple portions. Moreover, the haphazard landholding scheme has an impact on planting patterns and intensities, reducing labor absorption in agriculture. As a result, migration is seen as a solution to address socioeconomic disparities through the benefits of agglomeration economies (Michele & Domenica, Citation2020). Similarly, Citationundefined reported that land scarcity caused by large family size was the primary determinant of rural-urban migration in Ethiopia. Soil fertility degradation and agricultural yield loss put pressure on household income, prompting densely populated households to send members to alleviate the situation (Clemens & Patrick, Citation2013; Hua & Zhuang, Citation2019). Conflicts within households may also play a role in members moving from rural to urban areas. Conflicts between family members are more common in more densely populated households than in less densely populated households, resulting in household members migrating to avoid a habitual deviation (FAO, Citation2018b; Nye et al., Citation1970).
In this study, a positive relationship between access to information and household member migration was discovered at a 1% significance level. However, because previous data on access to information assets for various time periods could not be obtained, the study is solely based on current period data. If the data was correct prior to a household member’s migration, access to a wide range of information assets increased the likelihood of rural-urban migration by 19.97%, with other factors remaining constant. This is because they are more likely to learn about suitable migration destinations as well as the culture, traditions, and customs of the destination areas (Gelb & Krishnan, Citation2018). Households that send migrants, on the other hand, are more likely to have access to information now as a result of the migrants’ assistance. Thus, household migration and information access are two interconnected situations in which information is required for member migration and migrants serve as a foundation for the spread and use of information-supporting technology in the destination area. Duncan and Popp (Citation2017) (Duncan & Popp, Citation2017), FAO (Citation2016), and Sun (Citation2019) discovered that access to information had a positive impact on rural household migration and that migrants played a significant role in the development of ICT in rural areas.
The size of cultivated fields was found to be inversely related to rural-urban migration by 5%. A household with more farmed fields, on average, reduced the likelihood of sending migrants by 3.7%, ceteris paribus. There are typically two main explanations for the smaller size of farmed fields in migrant-sending households. First, rural-urban migration creates a labor shortage, and the loss of workforce reduces rural households’ ability to respond to labor demand; as a result, the households abandon their farmland (Shaoyao et al., Citation2020; Timmer, Citation2014). The second argument could be related to the investment: Because of specialization, mechanization, commercialization of agriculture, and capital-intensive investments made by rural migrants, the size of cultivated fields has decreased, but the land may not be left uncultivated (Ajaero Chukwuedozie & Onokala Patience, Citation2013; Dazhuan et al., Citation2020).
We also discovered a significant link between soil infertility and household member migration. The ivprobit regression model predicted that households with soil infertility problems were 9% more likely to have migrant members than households without soil fertility problems, at a 5% level of significance. This implies that in the study area, migrant households were more affected by the soil infertility problem than non-migrant households. One possible explanation is that as soil fertility deteriorates, arable land shrinks and the internal ability of land to produce the required agricultural output eventually diminishes. As a result, rural households suffering from soil infertility are unable to generate adequate agricultural output, and they are forced to send migrants to supplement their income or meet their livelihood needs. Similarly, FAO (Citation2016) reported that households suffering from soil infertility used rural-urban migration as a strategy to mitigate the problem and poor crop yields. This study’s findings, which demonstrated a direct link between land degradation and migration, were also supported by Michele and Domenica (Citation2020), McLeman (Citation2017), and Hua and Zhuang (Citation2019).
The household residence distance in kilometers to the nearest town was used as a determinant of rural-urban migration and was found to have a significant and negative influence on rural-urban migration at a 5% significance level. When all else is equal, a greater distance between the locations reduces the likelihood of sending a migrant by 1.1 %. This means that households located far from towns are less likely than their partners who live in nearby towns to participate in rural-urban migration. This is because proximity to a town may make migration easier for households because they can easily obtain information about migration benefits and costs due to the free flow of people, commodities, and services. Similar findings were found by Junfu and Zhong (Citation2013) and Eshetu and Beshir (Citation2017). They discovered that the greater the distance between a rural household’s home and the nearest town, the higher the cost of migration and the lower the likelihood of rural-urban migration.
The study also discovered a significant relationship between households’ distance from FTC locations and rural-urban migration. According to the study, a one-kilometer increase in the distance between rural households and the FTC increased the likelihood of rural-urban migration by 2.6 percent at a 5% significance level. The most likely explanation is that access to FTC services benefits agricultural production (Alemayehu, Citation2010), and households closer to these centers benefit more and they are less likely to send members.
3.3 Impact of rural-urban migration on household livelihood security
This study presents relatively new findings derived from advanced continuous treatment analysis. A dose response function was used to investigate the impact of remittance on household livelihood security, and it was found to be beneficial. Before utilizing DRF to evaluate treatment effects, a multicollinearity test was performed. Table shows the dose response function outputs for the estimated impact of remittance on household livelihood security. The function explained 28.6 percent of the variability in the response data in the region of the mean value, according to the R-squared value of 0.2860. Table also shows the estimated treatment effects for binary treatment cases, including the population’s Average Treatment Effect (ATE), Average Treatment Effect on Treated (ATT), and Average Treatment Effect on Non-Treated (ATNT), as well as predicted household livelihood security. Family size, land ownership, and livestock ownership were all significant predictors. Landholding and livestock count were positively related to the value of the household livelihood security index, but family size was negatively related. The positive coefficient suggests that having more land and livestock is critical to achieving rural-household livelihood security, as both are primary assets that can be easily converted into cash. Similarly, Ana and Demmelash (Citation2017) found that landholding size and livestock ownership were the most important factors in lifting rural households out of poverty. The negative coefficient of family size suggests that an increase in family size leads to a decrease in household assets, making rural households vulnerable in their livelihood.
Table 4. Regression results for the effect of remittance on livelihood security
This finding indicated that remittances had a positive and direct relationship with household livelihood security. When the treatment exposure was used as a dummy in the dose-response model, a unit increase in remittance intensity increased the overall population’s livelihood security index by 10.99%. The average positive impact of remittance on the rural livelihoods of remittance-receiving and non-receiving households was 13.6% and 7.69%, respectively. The average treatment effect value of 7.69% on the outcome of the non-treated groups is used as a counterfactual for the treated groups (Holland, Citation1986; Sekhon Jasjeet, Citation2007). This implies that the rural livelihoods of remittance-receiving households would be reduced from 13.61% to 7.69% if remittances were not received. Kangmennaang et al. (Citation2018), Gaaliche and Zayati (Citation2014), Jørgen (Citation2014), Redehegn et al. (Citation2019), and Kunofiwa (Citation2018) all reported similar findings. Their findings revealed that remittances sent by migrants to their sending households reduced poverty.
However, the DRF was used to estimate the impact of remittance intensity on household livelihood security, and the binary treatment effect cases are re-denoted as ATE (x, t), ATT (x, t), and ATNT (x, t) (x, t). Figure depicts the kernel density estimation for the distribution functions ATE (x, t), ATT (x, t), and ATNT (x, t), along with the 95 % confidence intervals. The ATT (x, t) and ATE (x, t) were significantly more concentrated in the middle values, as shown in Figure , with a peak modal value of 0.136 and 0.109, respectively, in the livelihood security index. Furthermore, the distributions of ATT (x, t) and ATE (x, t) were more regular than those of ATNT (x, t), though ATE (x, t) is more uniform. This implies that remittances had a much greater impact on remittance-receiving households than on non-remittance households and the general population. However, the ATNT (x) distribution is more concentrated in the lower values, with the maximum modal value in the livelihood security index being around 0.076.
Figure 2. Distribution of ATE (x, t), ATET (x, t) and ATENT (x, t) and the DRF of remittance.
The contour of the DRF in Figure has a positive slope, with large confidence intervals between (0; 100]. The higher the intensity of the remittance, as shown in Figure , has a greater effect on household livelihood security, as the DRF curve develops continuously with very large confidence intervals. Remittance-receiving households were entirely responsible for the overall positive effect on household livelihood security, with households receiving more remittance assistance contributing more to improving rural livelihood security.
Figure depicts the average DRF’s instantaneous rate of change in relation to the average change in remittance intensity. The graph also shows that, in percentage terms, higher remittance intensity is associated with a higher index of livelihood security. The DRF has a concave upward curve (the graph bends higher), a positive slope (increasing function), and a local minimum near 40% dosage (the point at which the DRF switched from decreasing to increasing). Finally, bootstrapped standard error was used to assess estimation’s computational correctness and consistency. Fortunately, the analytical standard errors and estimated DRF with bootstrapped standard errors from 20 replications followed a similar pattern (Figure ).
Figure 3. The DRF and its derivatives; exogenous treatment case.
Figure 4. Dose-response function with bootstrapped std.Err.
4. Conclusion and recommendations
This study discovered that rural-urban migration is influenced by a variety of demographic, economic, social, and institutional factors and has a positive impact on household livelihood security. The study found that livestock ownership, family size, access to multiple information assets, number of cultivated fields, soil infertility, distance to the next town, and proximity to farmer training centers all have a significant impact on rural-urban migration. Except for livestock ownership, size of farmland, and proximity to the town, all other major variables positively influence the rise of rural-urban migration. The involvement of the governing body and potential stakeholders at all levels is critical in better managing the vast situation of rural-urban migration by addressing the primary factors. To reduce the labor loss effects of migration in the study area, special attention should be paid to the implementation of proper livestock management systems in migrant-sending households’ farms, with a focus on poultry and small ruminant (goats and sheep) production, as these create jobs and increase household income.
Furthermore, non-migrant households had fewer cultivated fields than migrant-sending households, possibly due to labor shortages. As a result, policies and strategies that assist households, particularly migrant-sending households, in extending their farmed fields by utilizing upgrading technology that replaces labor should be carefully considered. In addition, the government must take concrete steps to reduce family size by raising awareness of family planning methods and improving soil fertility through integrated soil management, which benefits households economically, environmentally, and socially.
The analysis confirms with the optimist’s viewpoint when examining the impact of rural-urban migration on rural livelihoods. We found that the remittance dose raised the indicator of livelihood security. With an increase in remittances, the livelihood security of rural households also increases. Thus, effective government for effective remittance management and institutional capacity building are critical to reaping the greatest benefit from migrant remittances. Institutions might do this by providing investment land in rural areas with other supporting infrastructures, especially in low-lying areas. As investment drives the expansion of non-farming activities in rural areas, remittance productivity rises and spreads throughout the community, improving rural livelihood security.
Acknowledgments
Local government officials, sample households, data enumerators, and institutions like Addis Ababa University and Wolkite University all contributed to the completion of this study. The authors express their sincere thanks to all the contributors for their invaluable help.
Disclosure statement
No potential conflict of interest was reported by the author(s).
Additional information
Notes on contributors
Mesfin Agza
Mesfin Agza As of 2012, he has been employed by Wolkite University in the Department of Agricultural Economics.
Bamlaku Alamirew
Bamlaku Alamirew Additionally, he has a global project manager qualification (CIPM).
References
- Abad, N. (2017, April). The Impact of Remittances on Household Food Security<year/>: A Micro Perspective from Tigray //Preliminary Draft. Mekelle University.
- Agesa, R. U., & Kim, S. (2001). Rural to urban migration as a household decision: Evidence from Kenya. Review of Development Economics, 5(1), 60–17. https://doi.org/10.1111/1467-9361.00107
- Agza, M., Alamirew, B., & Shibru, A. (2021). Crop producers’ technical efficiency and its determinants in Gurage zone, Ethiopia: A comparative analysis using rural-urban migration as a parameter. Cogent Social Sciences, 7(1), 1–14. Tylor and Francis Group. https://doi.org/10.1080/23311886.2021.1995996
- Ajaero Chukwuedozie, K., & Onokala Patience, C. (2013). The Effects of Rural-Urban Migration on Rural Communities of Southeastern Nigeria. International Journal Population Research, 2013, 1–10. https://doi.org/10.1155/2013/610193
- Alemayehu, N. (2010). Farmer training centres and the IPMS programme in Ethiopia [Report]. IPMS Ethiopia.
- Alem, Y., Maurel, M., & Millock, K. (2016). Migration as an Adaptation Strategy to Weather Variability: An Instrumental Variables Probit Analysis. Environment for Development Initiative, 1–29.
- Ana, D., & Demmelash, H. (2017). Effect of Non-farm Income on Rural Household Livelihood: A Case Study of Moyale District Oromia Regional State, Ethiopia. American Scientific Research Journal for Engineering, Technology, and Sciences (ASRJETS), 33(1), 10–36.
- Assefa, B., & Eshetu, M. (2017). Determinants of Rural Out-Migration in Habru District of Northeast Ethiopia. Hindawi International Journal of Population Research, 2017, 1–8. https://doi.org/10.1155/2017/4691723
- Berhanu, B., & Michael, W. (2000). War, famine, and female migration in Ethiopia, 1960–1989. Economic Development and Cultural Change, 49(1), 91–113. https://doi.org/10.1086/452492
- Bezon, K. (2019). The Impact of International Remittances on Poverty Alleviation in Bangladesh. Remittances Review, 4(1), 67–86. https://doi.org/10.33182/rr.v4i1.665
- Bezu, S., & Holden, S. (2014). Are Rural Youth in Ethiopia Abandoning Agriculture? World Development. Norwegian University of Life Sciences, Aas, Norway, 64. 259–272 https://doi.org/10.1016/j.worlddev.2014.06.013
- Bhandari and, G., & Reddy, B. V. C. (2015). Impact of Out-Migration on Agriculture and Women Work Load: An Economic Analysis of Hilly Regions of Uttarakhand, India. Journal of Agricultural Economics, 70(3), 396–404. https://doi.org/10.22004/ag.econ.230218
- Birgit, S., & Claudia, R. (2008). International labor migration from a tropical development frontier: Globalizing households and an incipient forest transition. Human Ecology, 36(6), 891–908. https://doi.org/10.1007/s10745-008-9207-0
- Boonchan, C., & Preston, T. R. (2004). Measuring fertility of soils by the bio-test method [Report] ( Art. #78., Vol. 16). Livestock Research for Rural Development.
- Clark, G., & Valerie, M. (2012). Drought and population mobility in rural Ethiopia. World Development, 40(1), 134–145. https://doi.org/10.1016/j.worlddev.2011.05.023
- Clemens, G., & Patrick, S. (2013). Rural—urban migration, agrarian change, and the environment in Kenya: A critical review of the literature. Population and Environment, 34(4), 524–553. Springer. https://doi.org/10.1007/s11111-012-0178-0
- Cochran, W. G. (1963). Sampling Techniques (2nd ed.). Book. John Wiley and Sons, Inc.
- CSA. (2007). Summary and Statistical Report of Population and Housing Census [Report]. United Nations Population Fund (UNFPA).
- Dazhuan, G., Long, H., Qiao, W., Wang, Z., Sun, D., & Yang, R. (2020). Effects of rural–urban migration on agricultural transformation: A case of Yucheng City, China. Journal of Rural Studies Elsevier Ltd, 76, 85–95. https://doi.org/10.1016/j.jrurstud.2020.04.010
- de Brauw, A., Valerie, M., & Lim, L. H. (2014). The role of rural–urban migration in the structural transformation of sub-Saharan Africa. World Development, 63, 33–42. https://doi.org/10.1016/j.worlddev.2013.10.013
- de Brauw, A., Valerie, M., & Woldehan, T. Does Internal Migration Improve Overall Well-Being in Ethiopia? Ethiopia Strategy Support Program II; ESSP Working Paper 55. . Ethiopian Development Research Institute and International Food Policy Research Institute, 2013.
- De Haas, H. (2007). The complex role of migration in shifting rural livelihoods: The case of a Moroccan oasis. (T. Van Naerssen, E. Spaan, & A. Zoomers, Eds.). Routledge. : Global Migration and Development.
- Duncan, H., & Popp, I. (2017). Migrants and Cities: World Migration Report 2018. International Organization for Migration.
- Entwisle, B., & Tong, Y. The impact of migration and remittances on households in rural Thailand. Paper presented at the annual meeting of the Population Association of America March 31April Philadelphia: 2005.
- Eshetu, F., & Beshir, M. (2017). Dynamics and determinants of rural-urban migration in Southern Ethiopia. Journal of Development and Agricultural, 12(9), 328–340. https://doi.org/10.5897/JDAE2017.0850
- FAO Migration, Agriculture and Rural Development Addressing the root causes of migration and harnessing its potential for development. 2016. 8–11.
- FAO. (2018a) . Migration, Agriculture and Climate Change: Reducing vulnerabilities and enhancing resilience [Report]. Food and Agricultural Organization.
- FAO. (2018b). The State of Food and Agriculture: Migration, Agriculture and Rural Development [Conference] //Economic and Social Development Department. Food and Agriculture Organization of the United Nations.
- FAO. (2019). FAO Migration Framework – Migration as a choice and an opportunity for rural development. Food and Agriculture Organization of the United Nations. Report.
- Ford, K., Jampaklay, A., & Chamratrithirong, A. The impact of migration on household wealth in Kanchanaburi Province, Thailand. [Conference] //Paper presented at the annual meeting of the Population Association of America, March 29–31 New York: [ s.n.], 2007.
- Francesco, C. (2018). Drivers of migration: Why do people move? Journal of Travel Medicine, 25(1), 1–7. https://doi.org/10.1093/jtm/tay040
- Gaaliche, M., & Zayati, M. (2014). The causal relationship between remittances and poverty reduction in developing country: Using a non-stationary dynamic panel data. Atlantic Review of Economics, 1, 1–13.
- Garip, F. Internal migration, remittances and community development: Paper presented at the annual meeting of the Population Association of America, 29–31 March. 2007.
- Gebeyehu Zemene Haddis Rural-urban migration and land and rural development policies in Ethiopia Paper prepared for presentation at the “2014 World Bank Conference on land and poverty”, March 24-27, 2014. . Washington DC: The World Bank, 2014. 1–24.
- Gebretsadik, W., Weldemariam, Z., Humnessa, T. and Adane, H. (2018). Characterization of Agro forestry Practices and their Socioeconomic Role in Selected Districts of Gurage ZoneEthiopia [Journal] //SRYAHWA. International Journal of Research in Agriculture and Forestry, 5(11), 30–40.
- Gedefaw, T. (2018). Wolde Impact of Remittance on Rural Household s Welfare: Evidence from North Wollo Zone, Gubalafto Woreda in Amhara Regional State, Using IV Estimation Technique. Journal of Global Economics, 6(1), 1–6.
- Gelb, S., & Krishnan, A. (2018). Technology, migration and the 2030 Agenda for Sustainable Development, Swiss Agency for Development and Cooperation SDC [Report]. ODI.
- Herrera, C., & Sahn, D. (2013). Determinants of internal migration among Senegalese youth. SSRN Electronic Journal, 1–43. https://doi.org/10.4054/DemRes.2020.43.45
- Holland, P. W. (1986, December). Statistics and Causal Inference. Journal of the American Statistical Association, 81(396), 396–960945–960. Taylor & Francis, Ltd. on behalf of the American Statistical Association https://doi.org/10.2307/2289064
- Hua, Z., & Zhuang, L. (2019). The impact of soil erosion on internal migration in China. PLoS One, 14(4), 1–17. https://doi.org/10.1371/journal.pone.0215124
- IOM. (2017). World Migration Report 2018. International Organization for Migration.
- Jørgen, N. Remittances and Development: The Impact of Remittances on LivelihJørgen Remittanc Master’s Thesis is carried out as a part of the education at the University of Agder. : University of Agder, 2014.
- Junfu, Z., & Zhong, Z. Measuring the Income-Distance Tradeoff for Rural-Urban Migrants in China, Discussion Paper No. 7160The Institute for the Study of Labor (IZA). . 2013. 1–41.
- Kamaruddin, R., & Samsudin, S. (2014). THE sustainable livelihoods index: A tool to assess the ability and preparedness of the rural poor in receiving entrepreneurial project. Journal of Social Economics Research, 1(6), 108–117. United Kingdom : [s.n.].
- Kangmennaang, J., Bezner-Kerr, R., & Lu, I. (2018). Impact of migration and remittances on household welfare among rural households in Northern and Central Malawi. Migration and Development, 7(1), 55–71. https://doi.org/10.1080/21632324.2017.1325551
- Kassa, B. (2004). Resettlement of peasants in Ethiopia. Journal of Rural Development, 223–254.
- Kunofiwa, T. (2018). The Impact of Remittances on Poverty Alleviation in Selected Emerging Markets. Comparative Economic Research Central and Eastern Europe, 21(2), 51–68. https://doi.org/10.2478/cer-2018-0011
- Laura, H. (2008). Strategies of invisibilization: How Ethiopia’s resettlement programme hides the poorest of the poo. Journal of Refugees Studies, 21(4), 517–536. Oxford University Press. https://doi.org/10.1093/jrs/fen041
- Laura, D., & Elisenda, E. (2016). Addressing rural youth migration at its root causes: A conceptual framework[report]. FAO.
- Lewis, W. A. (1954). Economic Development with Unlimited Supplies of Labour. The Manchester School, 22(2), 139–191. https://doi.org/10.1111/j.1467-9957.1954.tb00021.x
- Mazambani, D. Labor Migration Impacts on Communal Land Agriculture: Case Studies from Manicaland Province, Zimbabwe, Doctoral Dissertation, Clark University. 1990.
- McLeman, R. (2017). Migration and Land Degradation: Recent experience and future trends [Report]. Wilfrid Laurier University : UN.
- Michele, N., & Domenica, F. (2020). Migration, Agriculture and Rural Development: IMISCOE Research Series [Book]. Springer.
- Naseri, A., & Kabul, A. K. F. (2005). Animal nutrition training manual [Book]. National Animal Husbandry Advisor.
- Neda, F. An Exploratory Study of Child Out-Migration in Ethiopia: The Gurage Case Master’s Thesis. July. 2007.
- Nida, W. The Impact of Urban Migration in Village Life: The Gurage case MA thesis in Social Anthropology. . CODESTRIA- LIBRARY, 1995.
- Njonge, F. K. (2017). Agro-Ecological Zones, Breed Type and Animal Management Styles Association with the Prevalence of the GI Parasites in Cattle of Kirinyaga County, Kenya. Journal of Agriculture and Veterinary Science, 10(5), 4–28. https://doi.org/10.9790/2380-1005012428
- Nye, F. I., Carlson, J., & Garrett, G. (1970). Family Size,Interaction Affect and Stress. Journal of Marriage and the Family, 32(2), 216–226. https://doi.org/10.2307/350127
- Otte, J., Costales, A., Dijkman, J., Pica-Ciamarra, U., Robinson, T., Ahuja, V., Ly, C. and Roland-Holst, D. (2012). Livestock sector development for poverty reduction:An economic and policy perspectiveLivestock’s many virtues [Report]. FAO.
- Ratha, D. (2011). Leveraging migration for Africa: Remittances, skills, and investments. [Report]. The International Bank for Reconstruction and Development, World Bank.
- Redehegn, M. A., Sun, D., & Am, E. (2019). Development impacts of migration and remittances on migrant-sending communities: Evidence from Ethiopia. PLoS One, 14(2), 1–20. https://doi.org/10.1371/journal.pone.0210034
- Richard, A. (1998). Remittances, investment and rural asset accumulation in Pakistan. Economic Development and Cultural Change, 47(1), 155–173. https://doi.org/10.1086/452390
- Sanzidur, R., & Shaheen, A. A. Determinants of livelihood security in poor settlements in Bbangladesh. International Working Paper Series, Paper No. 10/01. . 2010.
- Sekhon Jasjeet, S. (2007). The Neyman-Rubin Model of Causal Inference and Estimation via Matching Methods: Forthcoming in the Oxford Handbook of Political Methodology Janet Box-Steffensmeier (B. Henry & C. David, Eds.). HanSekhon Oxford Handbook.pdf.
- Shaoyao, Z., Deng, W., Peng, L., Zhou, P., & Liu, Y. (2020). Has Rural Migration Weakened Agricultural Cultivation? Evidence from the Mountains of Southwest China. Journal of Agriculture, 10(3), 1–19. https://doi.org/10.3390/agriculture10030063
- Statacorp. (2013). Stata Treatment Effects Reference Manual //Potential Outcomes/Counterfactual Outcomes Release 13 a Stata. StataCorp LP.
- Sun, L. Rural Urban Migration and Policy Intervention in China: University of Leeds, UK https://doi.org/10.1007/978-981-10-8093-7. September 20, 2019. Palgrave macmilla.
- Sylvie, D. (2015). Migration and families left behind. IZA World of Labor, 144. https://doi.org/10.15185/izawol.144
- Tadele, F. [et al.] Migration and Rural-Urban Linkages in Ethiopia and implications for Policy and Development [Conference] //Irish Aid–Ethiopia. University of Bath : Research Group on Wellbeing in Developing Countries, Ethiopia Programme, 2006. 1–97.
- Tafere, K. [et al.] Causes and Consequences of Irregular Migration in Selected Woredas of Tigray Regional State, Mekelle University Working Paper presented to the Italian Agency of Development Cooperation Mekelle University, April. 2017.
- Taylor, J. E., Scott, R., & De Brauw, A. (1999). Migration, remittances and agricultural productivity in China. The American Economic Review, 89(2), 287–291. https://doi.org/10.1257/aer.89.2.287
- Tesfahun, G., Asfaw, W., Zeleke, G. and Scott, D. (2008). The nexus of migration, HIV/AIDS and food security in Ethiopia. [Report]. IFPRI. (RENEWAL Working Paper.
- Thorat, V. A., Dhekale, J.S., Patil, H.K. and Tilekar, S.N. (2011). Determinants of rural-urban migration in Konkan Region of Maharastra. Agricultural Economics Research Review, 24, 503–509.
- Timmer, P. (2014). Managing Structural Transformation: A Political Economy Approach. UNU Wider.
- UNDESA. (2019). International Migrant Stock 2019 [Report]. United Nations, Department of Economic and Social Affairs.
- Waddington, H., & Sabates-Wheeler, R. (2003). How Does Poverty Affect Migration Choice? A Review of Literature Development Research Centre on Migration: Globalization and Poverty, 1–22.
- WB. (2008). World Development Report: Agriculture for Development [Report]. The World Bank.
- WB. (2015). Global Monitoring Report 2015/2016: Development Goals in an Era of Demographic Change [Report]. The World Bank.
- WB. (2016). Global Migration Revisited: Short-Term Pains, Long-Term Gains, and the Potential of South-South Migration [Report]. World Bank Groups.
- Weldegebrial, G., & Beyene, F. (2012). Causes and consequences of out-migration on rural households’ livelihood in Gulomekeda district, Tigray, Ethiopia. Agricultural Research and Reviews, 1(1), 26–33.
- Wurku, S., & Joyce, M. (2019). The Impact of Remittance on Poverty: Evidence from the South African National Income Dynamics Study (NIDS). ResearchGate, 78–99.
- Yousra, A., & Julie, L. Does Migration Improve Living Standards of Migrant-Sending Households? Evidence from Rural Ethiopia: //Migrating out of Poverty; Working Paper 41. . http://migratingoutofpoverty.dfid.gov.uk/, September. 2016.
- Zerga, B., Warkineh, B., Teketay, D., Woldetsadik, M., & Sahle, M. (2021). Land use and land cover changes driven by expansion of eucalypt plantations in the Western Gurage Watersheds, Centeral-south Ethiopia. Trees, Forests and People ELSEVIER, 5, 1–12. https://doi.org/10.1016/j.tfp.2021.100087