
 ?Mathematical formulae have been encoded as MathML and are displayed in this HTML version using MathJax in order to improve their display. Uncheck the box to turn MathJax off. This feature requires Javascript. Click on a formula to zoom.
Abstract
Financial inclusion has become an important goal of the global development agenda, particularly for post-conflict and fragile states. Enhancing financial inclusion is vital for a country like Burundi which aims to achieve inclusive growth in its attempt to break free of its fragility. However, the adoption of instruments of financial inclusion such as bank account, microfinance account and mobile money account is low due to weak institutional capacity leading to high-risk exposure and a greater risk of economic instability. This study examines the factors that influence the adoption of these instruments of financial inclusion using the Multivariate Probit and Poisson regression models. The results show that there is a significant correlation between the instruments of financial inclusion, signifying that the adoption of these instruments is interrelated. The analysis also reveals that, factors such as receipt of government transfers, receipt of remittances, education, membership of a social network, access to electricity, employment status, and area of residence influence both the probability and intensity/extent of adoption of the instruments of financial inclusion. By implication, policymakers should enhance access to electricity, formalise employment and strengthen social networks to improve the adoption of financial inclusion instruments.
PUBLIC INTEREST STATEMENT
Financial inclusion is essential to achieving global development goals. Access to financial services has been noted to be low in fragile and post-conflict states because people prefer to hold cash due to both economic and political instability. However, for a country like Burundi which has a large refugee population in its neighbouring countries, citizens need to be financially included as having an account with a financial institution makes it easier to receive remittances. Faced with limited infrastructure, it is essential to examine how innovations in the provision of financial services across sub-Saharan Africa are enhancing financial inclusion in fragile states in the sub-region. Mobile money has gained traction among many, especially the vulnerable (women and youth), and this is driving financial inclusion within all groups of people. Mobile money is preferred over traditional services such as bank and microfinance accounts due to its less requirements.
1. Introduction
In 2010, world leaders at the G20 summit in Seoul, South Korea recognized financial inclusion as a pillar to achieving the global development agenda. This is because financial inclusion has been identified as a key enabler of seven out of the seventeen Sustainable Development Goals (World Bank [WB], Citation2022). Leaders of the G20 have reaffirmed their commitment to promoting financial inclusion to benefit all people, including the most vulnerable such as the elderly and displaced persons as well as underserved groups such as women and youth (Global Partnership for Financial Inclusion [GPFI], Citation2020). In simple terms, financial inclusion describes a situation where individuals and businesses have access to financial products and services that meets their needs (WB, Citation2022). A growing body of research points to the beneficial impacts of financial inclusion on both individuals and businesses who are financially included. It is therefore essential to develop more inclusive financial systems that make formal financial services available, accessible, and affordable to all members of the public (Triki & Faye, Citation2013).
The availability of more-inclusive financial systems have positive ramifications on the entire economy of a country and largely benefits the poor and most vulnerable in society (Demirgüç-Kunt & Klapper, Citation2013). Financial inclusiveness broadly entails the process of making available a range of financial services at a fair price, the right place, form and time to all members of a society without discrimination (Aduda & Kalunda, Citation2012). Financial inclusion eases access to financial services and further enhances the efficient allocation of resources (Sarma & Pais, Citation2011) and ensures that poor households and small- and medium-sized enterprises gain access to financial services which they would ordinarily not be able to access (Gopalan & Rajan, Citation2018). Additionally, several studies, for instance, Atta-Aidoo et al. (Citation2022), Koomson et al. (Citation2020) Manja and Badjie (Citation2022), Mohammed et al. (Citation2017) and Park and Mercado (Citation2018) have documented the household welfare-enhancing effect of financial inclusion mostly through poverty reduction, particularly among the most vulnerable groups in society.
The welfare-enhancing impact of financial inclusion attracted the attention of global development partners leading to the establishment of international organizations such as the Alliance for Financial Inclusion in 2008 and the Global Partnership for Financial Inclusion in 2010. Despite the promotion of financial inclusion globally, the level of financial inclusion in sub-Saharan Africa (SSA) as measured by the percentage of the adult population who hold an account at a formal financial institution lag behind other regions (Costa & Ehrbeck, Citation2015). This notwithstanding, there is an upward trend in technological innovations such as mobile money in SSA and these are believed to have increased access to financial services in the region (Triki & Faye, Citation2013). Traditionally, financial inclusion has been measured by the proportion of adults who have access to formal financial services such as bank accounts and/or the use of credit and savings facilities of a bank (Efobi et al., Citation2014). This was further widened to include people with access to microfinance accounts, especially in the developing world. This was because microfinance overcame the challenges associated with the formal banking system by providing micro-credit at discounted interest rates with little requirement for collateral (Milana & Ashta, Citation2020). In recent times, mobile money has developed to facilitate financial inclusion among all categories of people. Mobile money has become the major driver of financial inclusion particularly in Africa over the years because it can reach the remotest of locations which hitherto were inaccessible to traditional financial institutions (Mago & Chitokwindo, Citation2014).
Despite the efforts by global development partners and the development of financial innovations, financial inclusion remains low among SSA countries with significant sub-regional and national disparities (Asuming et al., Citation2019). For example, although financial inclusion in SSA is estimated to be around 34% (Global Findex Data, Citation2019), wide disparities exist among its sub-regions. Asuming et al. (Citation2019) estimate that the level of financial inclusion in SSA ranges from about 24%, 28%, 44% and 45% in West Africa, Central Africa, East Africa and Southern Africa respectively. Yet still, differences exist within sub-regions. In East Africa, financial inclusion is estimated to be about 75% in Kenya, 45% in Uganda, 42% in Rwanda, 40% in Tanzania and as low as 7% in Burundi (Global Findex Data, Citation2019). It is therefore important to examine the determining factors of financial inclusion especially in SSA countries with low levels of financial inclusion.
Existing literature on the determinants of financial inclusion has mainly focused on the adoption of the instruments of financial inclusion in isolation (Akinyemi & Mushunje, Citation2020; Meli et al., Citation2022; Nandru et al., Citation2016, Citation2021; Noor et al., Citation2020; Soumaré et al., Citation2016) or combined these instruments into an index (Laha et al., Citation2011; Sanderson et al., Citation2018; Zins & Weill, Citation2016). However, individuals typically adopt multiple instruments of financial inclusion as complements or substitutes that deal with their overlapping limitations. Additionally, adoption decisions are path dependent and the adoption of a new instrument of financial inclusion may be partly dependent on an earlier adopted instrument. Therefore, a comprehensive analysis of the adoption of financial inclusion must consider the interdependence and simultaneous adoption of various instruments of financial inclusion, in this case, bank, microfinance and mobile money accounts. We define an instrument of financial inclusion as any financial service that enhances people’s level of financial inclusion. In this study, we limit our focus to the three dominants forms of financial services in Africa, i.e., bank account, microfinance account and mobile money account ownership.
The overarching aim of this study is to examine the factors that influence the adoption of multiple financial inclusion instruments and the intensity of such adoption. Specifically, we aim to; (1) examine the factors that influence the adoption of multiple instruments of financial inclusion; and (2) examine the factors influencing the intensity of the adoption of financial inclusion instruments. The current study contributes to the growing literature on financial inclusion in three main directions; first, our analysis uses a novel dataset on financial inclusion in the post-conflict and fragile state of Burundi; second, we adopted methods that take into cognizance the interdependency between different instruments of financial inclusion and jointly analyse the decision to adopt these different instruments, in this case, mobile money account, bank account and microfinance account. Lastly, we extend the focus from the likelihood of adoption to the intensity/extent of adoption as measured by the number of financial inclusion instruments adopted by the individual.
The remainder of the paper is structured as follows. Section two provides the context of the country under study while section three provides a brief theoretical and empirical literature review. Section four covers the methodology adopted for the study while sections five and six provide the results and discussion, and conclusions respectively.
2. Context of the study
A post-conflict country lies “along a transition continuum (in which they sometimes move backwards)” and cannot be “placed in more or less arbitrary boxes of being ‘in conflict’ or ‘at peace’” (Brown & Langer, Citation2012). On the other hand, fragile states are those in which “the government is unable to deliver basic services and security to the population—face severe and entrenched obstacles to economic and human development” (Gelbard et al., Citation2015). Burundi is a post-conflict and fragile state which has experienced six episodes of civil war and several successful and unsuccessful coup d’états since gaining independence in 1962 and this has led to mass emigration of the country’s population as well as the emergence of a large refugee population (Nkurunziza, Citation2022). Burundi like all post-conflict and fragile societies faces the twin problem of economic recovery and reducing the risk of conflict recurrence (Collier, Citation2009). This has resulted in numerous economic consequences ranging from slow economic growth, underdevelopment of the private sector, unstable investment environment and severe financial constraints (Nkurunziza, Citation2022). The financial sector of Burundi is extremely underdeveloped and people who require credit to undertake investments are unlikely to get access to such credit (Nkurunziza, Citation2010). The level of financial inclusion in Burundi is significantly lower than sub-regional averages and this may be due to the fragile nature of the country (Atta-Aidoo et al., Citation2022). It is estimated that only 2% of adults in Burundi access credit from formal sources as against 44% of adults accessing credit from informal sources such as family or friends (Demirgüç-Kunt & Klapper, Citation2013). This lack of credit has significant implications for economic growth. At the firm level, firms in Burundi rather rely on internal funds than seek credit because of its high cost not only in terms of high-interest rates but extra transaction costs related to credit application such as different fees, long waiting times and costly collateral requirements (Nkurunziza, Citation2016). In light of this, it is extremely important to examine the determinants of financial inclusion in Burundi given its peculiar nature.
3. Literature Review
3.1. Theoretical literature
The main theory underlying this study is the Rational Choice Theory proposed by Adam Smith in 1776. The theory incorporates the three concepts of a rational actor, self-interest and the invisible hand. The theory posits that an individual will always conduct a cost-benefit analysis before making any economic choice to determine the best course of action despite the presence of uncontrollable factors (Ulen, Citation1999). In this study, we follow the same logic and postulate that an individual will conduct a cost-benefit analysis before choosing any instrument of financial inclusion. The quality of financial services and the attributes of service providers form the basis of such a cost-benefit analysis conducted by individuals on the demand side of financial inclusion (Awunyo, Citation2018; Wamuyu et al., Citation2022).
3.2. Empirical literature review
An array of factors has been identified to affect financial inclusion; however, these factors can be broadly classified into supply-side and demand-side factors (Demirgüç-Kunt & Klapper, Citation2013). Supply-side factors refer to the availability and accessibility of financial services, while demand-side factors refer to the willingness and ability of individuals and households to use financial services.
3.2.1. Supply-side factors
One of the key supply-side factors that affect financial inclusion is infrastructure. The availability of physical infrastructure, such as roads, electricity, and telecommunication networks, is critical for the provision of financial services in remote and rural areas (Aduda & Kalunda, Citation2012; Sarma & Pais, Citation2011). In addition, the availability of digital infrastructure, such as mobile phones and the internet, has facilitated the provision of financial services to underserved populations in many developing countries (Mas & Radcliffe, Citation2010). For example, Siddik et al. (Citation2016) find that paved road network and internet access are significant determinants of financial inclusion in Bangladesh. Furthermore, the availability and quality of financial infrastructure and innovation, including payment systems and credit registries, also affect financial inclusion. Efficient payment systems can reduce the cost of financial transactions and promote the use of formal financial services (World Bank, Citation2014). Similarly, credit registries can reduce information asymmetries and improve access to credit for individuals and small businesses (Demirgüç-Kunt & Klapper, Citation2013).
The regulatory environment also plays an important role in promoting a country’s state of financial inclusion. A supportive regulatory environment can reduce barriers to entry for financial service providers and encourage innovation in product design and delivery (Demirgüç-Kunt & Klapper, Citation2013). However, excessive regulation can stifle innovation and limit the availability of financial services, particularly in low-income countries where the cost of compliance can be prohibitive (Claessens & Rojas-Suarez, Citation2016). In particular, Lashitew et al. (Citation2019) find that a supportive regulatory environment promotes mobile money innovations in Kenya. Additionally, the institutional quality of financial service providers helps to minimize the level of financial exclusion on the African continent (Nsiah & Tweneboah, Citation2023).
There is also increasing evidence that greater ownership and use of financial accounts are associated with affordability (low cost) and greater proximity of service providers (Allen et al., Citation2016; Nandru & Rentala, Citation2020). Notably, Nandru et al. (Citation2015) show that physical accessibility to bank branches significantly influences the use and ownership of bank accounts. These findings taken together underscore the importance of having robust infrastructure that would open remote areas to financial service providers.
3.2.2. Demand-side factors
Financial literacy, defined as the knowledge and skills needed to make informed financial decisions, is a key demand-side factor that affects financial inclusion (Bire et al., Citation2019; Grohmann et al., Citation2018; Lusardi & Mitchell, Citation2014; Uddin et al., Citation2017). Low levels of financial literacy can limit the ability of individuals to understand and use financial services, particularly in complex financial markets. Therefore, financial education programs can play an important role in promoting financial inclusion (Adetunji & David‐west, Citation2019; Demirgüç-Kunt & Klapper, Citation2012). Additionally, individual and household income levels and wealth status can potentially influence their inclusion in formal financial systems (Tuesta et al., Citation2015). Low-income households are more likely to be excluded from formal financial systems due to high transaction costs and lack of collateral (Adetunji & David‐west, Citation2019). Therefore, policies that aim to reduce income inequality, such as cash transfer programs and minimum wage laws, can significantly promote financial inclusion.
Studies in low-income countries reveal that social networks and trust are critical determinants of financial inclusion. For instance, individuals who are part of social networks are more likely to have microfinance accounts than those who are not (Pitt & Khandker, Citation1998). In a more specific context, Okello Candiya Bongomin et al. (Citation2018) find a significantly positive moderating effect of social networks on the relationship between mobile money usage and financial inclusion in rural Uganda. The intuition here could be that social networks provide a form of collateral and reduce the risk of default. Additionally, trust is a critical factor in promoting financial inclusion within a society. Individuals are more likely to use financial services, especially microfinance and mobile money if they trust the institutions offering these services (Jack & Suri, Citation2011). Further, people’s inability to trust financial institutions affect their access to financial services. This is because mistrust of financial institutions coupled with their strict requirements to provide necessary paperwork, like proof of income for workers in the informal sector or official proof of residence undermine formal financial inclusion in low-income countries (Aggarwal et al., Citation2013).
Several other studies (e.g., Asuming et al., Citation2019; Musa et al., Citation2015; Soumaré et al., Citation2016; Wale & Makina, Citation2017; Zins & Weill, Citation2016) indicate that individual and household characteristics such as age, gender, area of residence, employment status, marital status, and household size among others are significant determinants of financial inclusion. For example, Akinyemi and Mushunje (Citation2020), and Amoah et al. (Citation2020) report that financial inclusion in the form of mobile money adoption is higher among the youth and educated populace because such category of people tends to be technology savvy.
From the forgoing literature review, it is evident that most studies on the determinants of financial inclusion have taken a general view of financial inclusion by aggregating all forms of services and instruments into a single index. Such aggregation prevents a better understanding of the factors determining financial inclusion since the influence of each factor may play out differently among the various components of the financial inclusion index. Additionally, other studies examine the determinants of only individual instruments of financial inclusion without considering the overall decision-making process of being financially included. To this end, our study overcomes these challenges by examining the factors determining the adoption of each instrument of financial inclusion simultaneously.
4. Methodology
4.1. Study area and sampling
The study was carried out in Burundi (Figure ), one of the fragile post-conflict African countries located on 3° 25’ S, 29° 55’ E with a total area of 27,830 sq km (land: 25680 square km and water: 2,150 square km). To the North, the country borders Rwanda, Tanzania to the East, the Democratic Republic of Congo to the West, and Lake Tanganyika to the South-East. Burundi has one of the highest population densities in Africa (463 per Km2 or 1,199 people per mi2) and has a total estimated population of 11,890,784. The population of Burundi comprises 86.2% rural population whose major livelihood strategy is agriculture (The World Fact Book, Citation2021). The country is administratively divided into three divisions, the largest of these divisions are the provinces (18 total provinces), followed by “communes” or municipals (117 communes in total), and the lowest administrative unit “collines” or hills/villages (2638 collines in total).
Figure 1. Map of Burundi showing the study area.
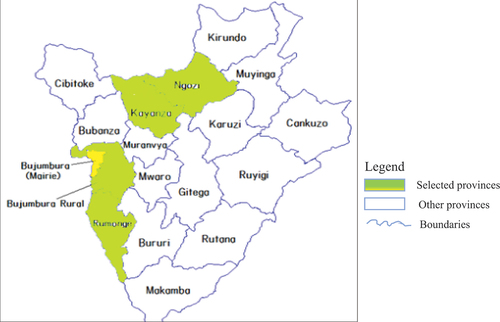
The data used for this study are derived from a household survey in Burundi conducted from October to November 2021 for an African Economic Research Consortium project that aimed to examine the impact of financial inclusion on household welfare. The sample covers a total of 860 households drawn from five provinces in Burundi. A multi-stage cluster probability sampling with stratification was adopted for the data collection. In the first stage, the country was sub-divided into North, South, East, West and Central and a province based on this sub-division was selected randomly. The provinces selected to represent the five sub-divisions created were Ngozi, Bujumbura Rural, Bujumbura Mairie, Rumonge, and Kayanza. Each province was further stratified into rural and urban leading to the random selection of one urban commune and one rural commune within each province making a total of ten communes. Communes in this case were the clusters, and at least two villages (collines) from each cluster were sampled leading to at least 20 primary sampling units, from which households/individuals were drawn. Due to the high population dispersion between urban and rural, a representative sample required allocation of the sample to be done proportional to size. The sampling frame for each village (colline) was based on the list of villages from the previous national census. Table presents the total sample selected from each province.
Table 1. Distribution of sample in Provinces
The survey instrument used for the data collection comprised five sections. In the first section, information about the province, zone, village, area of residence and period of stay in the community was solicited. The second section comprised information about the socioeconomic and demographic profile of respondents. Section three comprised questions on the various measures of financial inclusion, section four comprised questions on the ownership of household assets and the last section covers questions on household food security measures. Formal consent for participation in the study was obtained verbally from each respondent before the data collection could proceed. Respondents were further informed that they could stop participation at any point in time. Additionally, all respondents were assured of the anonymity and confidentiality of their responses.
4.2. Econometric framework and estimation techniques
Individuals adopt a mix of financial inclusion instruments to overcome the challenges associated with the use of just one instrument of financial inclusion, in this regard, the adoption of financial inclusion instruments is inherently multivariate. Dorfman (Citation1996) argues that any attempt to model such adoption behaviours in a univariate manner would leave out important economic information about interdependent and simultaneous adoption decisions. Our econometric specification comes in two parts: first, individuals’ choice of interrelated instruments of financial inclusion (in this case ownership of a bank account, microfinance account and mobile money account) was modelled using a multivariate probit (MVP) model; second, the determinants of the intensity/extent of adoption of the instruments of financial inclusion was analysed using a Poisson regression model and a negative binomial regression model.
4.2.1. Multivariate probit model for examining the factors that influence the adoption of multiple instruments of financial inclusion
Univariate probit/logit models used to examine the determinants of the adoption of a single instrument of financial inclusion (say bank account ownership) assume that such a decision does not affect the likelihood of adopting another instrument of financial inclusion (say microfinance account ownership). However, the MVP model allows for the simultaneous analysis of the determinants of each instrument of financial inclusion (in this case the ownership of a bank account, a microfinance account and a mobile money account) while allowing for the potential correlation between the unobserved disturbances, as well as the relationship between the adoption of the different instruments of financial inclusion (Belderbos et al., Citation2004). The use of the MVP model helps to overcome the issue of bias and inefficient estimates that would have arisen from our failure to capture the unobserved factors and interrelationship among the adoption decision regarding the different instruments of financial inclusion (Greene, Citation2012).
The observed outcome of financial inclusion adoption was modelled following a random utility formulation. Consider the ith individual (i = 1, … , N) facing a decision to either adopt or not adopt any of the instruments of financial inclusion. Let U0 represent the benefit an individual enjoys from not adopting any instrument of financial inclusion, and let Uk represent the benefits an individual derives from adopting the kth instrument of financial inclusion: where k represents the choice of bank account ownership (B), microfinance account ownership (C) and mobile money account ownership (D). The individual will decide to adopt the kth instrument of financial inclusion if . The net benefit from adopting the kth instrument of financial inclusion is a latent variable determined by observed household socio-demographic and economic characteristics (Xi) and the error term (εi):
Using the indicator function, the unobserved preferences in Equationequation (1)(1)
(1) translate into the observed binary outcome equation for each choice in Equationequation (2)
(2)
(2) as follows:
In the MVP where the adoption of multiple instruments of financial inclusion is possible, the error terms jointly follow a multivariate normal distribution (MVN) with zero conditional mean and variance normalised to unity where: (UB, UC, UD) ≈ MVN (0, Ω) and the symmetric covariance matrix Ω is given in EquationEquation 5(5)
(5) as:
The non-zero off-diagonal elements in the covariance matrix represent the unobserved correlation between stochastic components of the different instruments of financial inclusion. The resulting correlation coefficients establish the complementary (i.e., positive correlation) and substitution (i.e., negative correlation) associations among the various instruments of financial inclusion.
4.2.2. Poisson regression model and negative binomial regression model for examining the factors affecting the intensity of financial inclusion adoption
The MVP specified above only considered the likelihood of adopting multiple instruments of financial inclusion with no distinction made between, for instance, those individuals who adopt one instrument of financial inclusion and those who adopt a combination of multiple instruments of financial inclusion.
The Poisson regression model is the most appropriate method for analysing the intensity of adoption (Greene, Citation2012). This is because the data for measuring intensity is of a count nature and shows no order. The poisson regression model used in this study was based on two fundamental assumptions: first, it was assumed that if the individual derives optimum utility from the latest instrument of financial inclusion adopted, then there is no limit to the number of financial inclusion instruments to be adopted; second, it was assumed that an individual’s decision to adopt any instrument of financial inclusion does not prevent the adoption of other available instruments of financial inclusion. Following existing literature (Greene, Citation2012; Maddala, Citation1983; Winkelmann, Citation2008), we adopted the standardised poisson regression model for this study. The standardised poisson used for this study was specified in EquationEquation 5(5)
(5) as follows:
From EquationEquation 5(5)
(5) ,
= E(yi |xi) = Var(yi |xi) and the mean is commonly formulated as yi = exp (xiβ) where xi is a vector of socioeconomic characteristics of the individual i and β is a vector of unknow parameters to be estimated. The marginal effects in the Poisson regression model were then computed as specified in EquationEquation 5
(5)
(5) :
The obtained marginal effect is then interpreted as a unit change in the intensity of adoption resulting from a unit change in the particular explanatory variable (Cameron & Trivedi, Citation2013). The study further estimated a negative binomial regression model to enable comparison with estimates from the Poisson model. The negative binomial regression model is a generalisation of the Poisson model which loosens the restrictive assumption that the variance is equal to the mean in the Poisson model. It is therefore assumed that the results from a binomial model will be more precise than estimates from a Poisson model (Martey & Kuwornu, Citation2021).
4.3. Description of variables
The variables used in the study as with their description, measurement, prior expectation are presented in Table .
Table 2. Description, measurement and a priori expectation of the variables used in the study
5. Results and Discussion
5.1. Adoption and intensity of adoption of the three instruments of financial inclusion
Figure indicates that the percentage of adoption of all three instruments of financial inclusion was higher among male respondents than their female counterparts. This is consistent with the findings of Roy and Patro (Citation2022) who highlight the prevalence of gendered financial inclusion. Additionally, Mndolwa and Alhassan (Citation2020) reveal that there exist gender discrepancies in financial inclusion with men being more financially included than women. Such discrepancies exist because, men enjoy a comparative advantage in terms of education, employment, resource ownership, and mostly make productive decisions in the household. It is well documented that bank account ownership for example is more prevalent among richer, older, educated and working men (Allen et al., Citation2016). Microfinance accounts were the least patronised instruments by both males (34.3%) and females (24.7%). There was a wider disparity between males (27.8%) and females (17.4%) in terms of bank account ownership. Mobile money account ownership was the most preferred among both males (65%) and females (59.7%), with ownership among females being more than double compared to ownership of bank and microfinance accounts. This is because mobile money adoption has a significant impact on the economic empowerment of women (Buvinić & Furst-Nichols, Citation2016).
Figure 2. Adoption and intensity of adoption of the instruments of financial inclusion by gender.
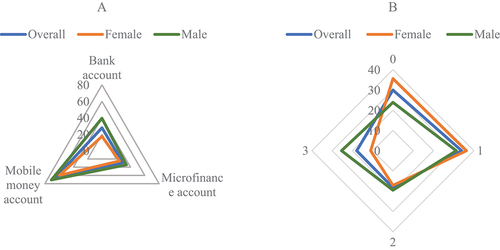
In most cases, individuals adopted more than one instrument of financial inclusion to maximise the benefits of being financially included. Figure indicates that a greater percentage of females (35.6%) did not adopt any instrument of financial inclusion compared to their male (23.85%) counterparts. Relatively more females (36.3%) adopted a single instrument of financial inclusion compared to their male counterparts (32.28%). The maximum number of financial inclusion instruments adopted was three, with significantly more adoption among males (25.38%) than females (11.01%).
5.2. Summary statistics by instrument and adoption status
The sampled respondents were categorized into non-adopters, low-adopters, mid-adopters and high-adopters based on the number of financial inclusion instruments currently being used (Table ). Non-adopters are households that do not use any of the three instruments of financial inclusion. Low-adopters are households that adopt any one of the instruments of financial inclusion. Mid-adopters are households that adopt any two of the instruments of financial inclusion while high-adopter are households that adopt all three instruments of financial inclusion. Adoption of financial inclusion was relatively higher among households that received government transfers and remittances. This may be because households needed a form of account to receive such transfers. A small fraction of non-adopters (3.27%) reported receiving remittances, it has been noted that some remitters still send remittances to their relatives far away through travellers and transport operators in cases where the recipients do not have any account (Hunter, Citation2018).
Table 3. Summary statistics of explanatory variables by adoption status
Having a formal education was highest among high-adopters (87.67%) followed by mid-adopters (85.91%), low-adopters (74.01%) and non-adopters (44.90%). The results indicate that being formally educated facilitates the adoption of more instruments of financial inclusion. The employment status of a respondent also had an association with the level of financial inclusion. The majority of high-adopters (67.81%) are employed relative to mid-adopters (45.64%), low-adopters (22.38%) and non-adopters (10.20%). This may be an indication that the employed had more income and could therefore access and afford the charges associated with the instruments of financial inclusion. Additionally, the employed may have been compelled to adopt some of these instruments of financial inclusion to receive their salaries and other payments (Barajas et al., Citation2013). The number of financial inclusion instruments adopted is related to households having access to electricity. About 78.77% of high-adopted have access to electricity compared to 55.03% of mid-adopters, 36.73% of low-adopters and 25.10% of non-adopters. This may indicate that not having access to electricity may be a constraint to the adoption of more instruments of financial inclusion (Chinyere et al., Citation2022).
The majority of non-adopters (93.88%), low-adopters (55.96%) and mid-adopters (57.72) were rural residents while high-adopters are largely urban residents (63.70%). This may be because the operators of the three instruments of financial inclusion may have more presence in the urban areas than in the rural areas (Allen et al., Citation2016). High-adopters (67.81) and mid-adopters (51.01) are largely male household heads while female heads comprised a majority of low-adopters (55.96%) and non-adopters (62.04%). The need for more instruments of financial inclusion among male heads may be because male heads tend to be engaged in multiple economic activities that may require several instruments to receive payments. There were no significant differences in the mean age and household size among all categories of adopters an indication that they may play no role in the decision to adopt instruments of financial inclusion (Table ).
5.3. MVP model results: factors influencing the adoption of multiple instruments of financial inclusion
The results of the multivariate probit regression are presented in Table . The Log-likelihood value of −1031.7843 and Wald chi-square value of 467.01 (p < 0.01) indicate a good model fit which implies that the independent variables significantly explain the variation in the dependent variables. The test of independence between the choice of an instrument of financial inclusion is given by the likelihood ratio test (rho21 = rho31 = rho32 = 0) which is statistically significant at a 1% level and indicates the goodness of fit of the model. By implication, there is a difference in the choice of financial inclusion instruments among households in Burundi which is given by the likelihood ratio statistic.
Table 4. Multivariate probit estimates of the factors that influence the choice of financial inclusion instrument
The result indicates the presence of a correlation between the dependent variables (instruments of financial inclusion) which are given by rhoij. Results in Table show a statistically significant positive relationship between the ownership of mobile money and bank accounts which is given by the positive correlation coefficient of rho21. This implies that respondents who had a bank account were more likely to have a mobile money account as well. The positive correlation coefficient of rho31 (correlation between ownership of microfinance and mobile money accounts) indicates that respondents who owned a microfinance account were more likely to own a mobile money account. The correlation coefficient of rho32 is positive and statistically significant indicating that respondents who own a microfinance account were more likely to own a bank account. The results for all three correlation coefficients were positive and statistically significant indicating that respondents recognised the three instruments of financial inclusion as complementary rather than substitutes. This follows the intuition that individuals adopt several instruments of financial inclusion to easily make transactions across all platforms, especially in a country that is less interconnected in terms of infrastructure. As evident in Table , the estimates from the MVP model differ considerably across the three equations signifying the relevance of differentiating between the instruments of financial inclusion.
The results in Table revealed that the likelihood of owning a bank account and a microfinance account is higher among individuals who received government transfers compared to nonrecipients of government transfers. Individuals who receive government transfers are 118.7% more likely to have a bank account and 67.9% more likely to own a microfinance account. A positive but non-significant result was found for the effect of government transfers on mobile money account ownership. We found that remittances have a positive and significant effect on mobile money and bank account ownership. Individuals who receive remittances were 69.4% and 29.5% more likely to own a mobile money account and a bank account respectively. Mobile money account is increasingly becoming the main avenue for remittance transfers across sub-Saran Africa (Kirui, Citation2022). Toxopeus and Lensink (Citation2007) argue that remittances have a substantial effect on financial inclusion, which in turn affects development. However, a negative relationship between remittances and microfinance account ownership was revealed albeit insignificant. The negative coefficient on remittances for microfinance account ownership is probably because remittances are mostly received as “Cash Pick Ups” at commercial banks and mobile money points.
Respondents who have some form of formal education have a higher probability of owning a mobile money account (62.3%) and a bank account (28.9%). Numerous studies from around the world such as Olaniyi and Adeoye (Citation2016) and Zins and Weill (Citation2016) in Africa, Soumaré et al. (Citation2016) in West and Central Africa, Tuesta et al. (Citation2015) in Argentina, Akudugu (Citation2013) in Ghana, Musa et al. (Citation2015) in Nigeria, Uddin et al. (Citation2017) in Bangladesh have reported similar results about education and financial inclusion. Because mobile money account is largely user-operated, their use among the educated populace is likely to be higher than the uneducated populace. Household size was found to have a significant effect on the ownership of a bank account. Households with larger sizes were 4.5% more likely to have a bank account. This result is consistent with a study by Siddik et al. (Citation2016) in Bangladesh who indicated that as the number of people in the household rises, the likelihood of having a bank account rises. Being married increases the probability of owning a microfinance account by 26.8%. Our result is consistent with that of Zins and Weill (Citation2016) who found a similar relation in 37 other African countries. Being a member of a social network and having access to electricity has a positive significant effect on the probability of owning all three instruments of financial inclusion under study. People who belonged to a social network were 60.1% more likely to own a mobile money account, 23.2% more likely to own a bank account and 62.6% more likely to own a microfinance account compare to those who did not belong to any social networks. Social networks improve the likelihood of becoming financially included by helping to overcome the issue of information asymmetry while playing a mediation role between financial intermediation and financial inclusion (Okello Candiya Bongomin et al., Citation2017, Citation2018). Access to electricity increases the probability of having a mobile money account by 23.4%, a bank account by 36% and a microfinance account by 28.9%. Access to electricity on the one hand improves the efficiency of services provided by financial institutions and mobile money operators and this may encourage consumers to increase their patronage of such services, on the other hand, an instrument like mobile money can only operate on a charged phone and as such people who can have regular access to charge their phone will be enticed to adopt mobile money services.
Ownership of livestock increases the likelihood of owning a mobile money account by 20.3%. Mobile money account ownership is prevalent among livestock owners because mobile money is increasingly being adopted as a payment system for trade in agricultural produce (Kikulwe et al., Citation2014). Older people were less likely to own a mobile money account (0.9%) but more likely to own a bank account (1.4%) compared to younger folks. This may be because mobile money usage may be novel to older folks, unlike traditional banking institutions. The result on bank account ownership is consistent with that of Musa et al. (Citation2015), Soumaré et al. (Citation2016), and Tuesta et al. (Citation2015)who reported a positive effect of age on financial inclusion. They argued that as people age, they become more aware of financial products and begin to use them. Individuals residing in urban areas were more likely to own a mobile money account (91.8%) and a bank account (100.8%) than their counterparts in rural areas. Males are 26.3% more likely to own a bank account compared to females while being employed increases the probability of owning a bank account by 77.8% and a microfinance account by 64%. This is because employers normally paid wages through formal financial institutions.
5.4. Poisson and negative binomial models result: factors influencing the intensity of adoption of financial inclusion instruments
Factors affecting the ownership of financial inclusion instruments may differ from the factors affecting the extent of ownership of these instruments. The extent/intensity of adoption of financial inclusion which is measured by the number of financial inclusion instruments owned by the respondent was examined using a Poisson regression model (Table ). The Poisson model is deemed fit for the analysis given the count nature of the dependent variable and the goodness of fit results (Pearson goodness-of-fit = 588.6347; Prob > chi2 (780) = 1.0000). The statistical significance of the goodness-of-fit chi2 indicates that the Poisson regression model is adequate. To check the robustness of our estimates, a negative binomial regression model was estimated and the results are presented in Table . However, our discussion is based on the Poisson regression model given that both models yielded similar results.
Table 5. Poisson and negative binomial regression estimates of the number of financial inclusion instruments adopted
Results in Table indicate that the significant determinants of the number of financial inclusion instruments adopted based on the marginal effects include remittances, education, marital status, social network, area of residence and employment status. The recipients of remittances are 14.4% more likely to adopt more instruments of financial inclusion compared to those who do not receive remittances. It was noted that having a deposit account is a requirement for receiving remittances, therefore, owning an account in a bank, microfinance or mobile money is very likely for those expecting to receive remittances. This finding corroborates the results of Anzoategui et al. (Citation2014) who found a positive effect of remittances on financial inclusion by promoting the use of deposit accounts in El Salvador. Similarly, Ajefu and Ogebe (Citation2019) reported that remittances increase the chances of using formal financial services. This is because people want to overcome the barriers to remittance inflows resulting from sending charges or related taxes. The role of remittances in increasing financial inclusion can be particularly higher in post-conflict and fragile countries because such countries have higher numbers of migrants who later tend to send money back home for reconstruction in times of relative peace. This was further reiterated by Gioli et al. (Citation2013) who indicated that remitted money from people who were forced to migrate due to conflict was almost the only supply line to ensure the survival of their relatives back home. In Burundi, it was confirmed that remittances have a strong impact on poor urban households (Fransen & Mazzucato, Citation2014).
An individual with formal education is predicted to be 42.1% more likely to adopt more instruments of financial inclusion compared to those without formal education. The literature on the role of formal education in financial decisions is still unsettled. Some studies such as Jung (Citation2014) found that returns from an extra year of formal education lead to risk-averse behaviour while others such as Aydemir and Kırdar (Citation2017) have found a positive relationship between formal education and saving behaviour in formal financial institutions. Our result resonates with those of Fungáčová and Weill (Citation2015), and Nyoka (Citation2019) who found a positive relationship between education and financial inclusion through formal credit and the ability to understand financial services better. Girón et al. (Citation2021) argue that in the least developed countries of Africa, education is almost always a predictor of financial inclusion and that the only time an educated individual is financially excluded is when that individual has no money.
It is estimated that being married increases the extent of financial inclusion by 22.3% compared to being unmarried. This result is consistent with the findings of Clamara et al. (Citation2014) who found that marital status had a positive relationship with the use of financial services. The likelihood of adopting more instruments of financial inclusion increases by 31.5% for members of a social network compared to people without any social network membership. As different members of a social network continue to adopt different instruments of financial inclusion and share their experiences with fellow members, the barrier created through information asymmetry reduces and encourages other members to adopt more financial inclusion instruments. Social networks serve as a source of information and motivation for individuals who want to try out innovations and new systems (Slade et al., Citation2015). Information among fellow members in a social network, therefore, becomes the credible source of information based on which adoption of new instruments of financial inclusion is made. Moreover, social network membership gives a reputation to loan applicants in a group than individual loan applications and this enhances the chances of securing loans from financial institutions (Pham & Talavera, Citation2018).
The area of residence significantly influences the extent of adoption of the instruments of financial inclusion. It was estimated that individuals residing in urban areas are 44.5% more likely to adopt more instruments of financial inclusion compared to rural residents. This may be because urban areas tend to exhibit proximity to formal financial institutions such as banks and microfinance institutions and easy access to mobile money operators compared to rural areas. This finding is similar to that of Allen et al. (Citation2016) who reported a positive relationship between urban residency and the use of financial services, and Izquierdo and Tuesta (Citation2015) who found a negative relationship between living in a rural area and being financially included. Mehry et al. (Citation2021) observe that this may be the case because financial institutions find it costly and risky to extend their activities to rural areas. Most importantly, rural areas of post-conflict and fragile countries in Africa are known for their high levels of insecurity. The employment status of an individual exhibited a significant positive effect on the extent of adoption of the instruments of financial inclusion. We found that individuals that are employed are 35.1% more likely to adopt more instruments of financial inclusion than their unemployed counterparts. Simatele and Maciko (Citation2022) indicates that people considered employment as a necessary condition for having a bank account in South Africa. Our result is similar to studies such as Allen et al. (Citation2016), Clamara et al. (Citation2014) and Llanto and Rosellon (Citation2017) who have reported a positive relationship between employment and financial inclusion. Other studies (see; Chen & Jin, Citation2017; Fanta & Mutsonziwa, Citation2016; Mndolwa & Alhassan, Citation2020; Tinta et al., Citation2022) highlighted that employed people are induced to use formal and mobile money accounts to access formal financial services like savings and credit because their reliable source of income makes them attractive to formal financial institutions.
6. Conclusion and policy implications
Increasing access to the instruments of financial inclusion is essential to achieving inclusive growth in a post-conflict and fragile country like Burundi. In this study, we analysed the likelihood and level of adoption of three instruments of financial inclusion using household survey data from five provinces in Burundi. We utilised the multivariate probit and poisson regression models to analyse the adoption of three instruments of financial inclusion and the number adopted by individuals while taking into account the interrelationship between these instruments. The results of our study show strong complementarities among the instruments of financial inclusion under consideration indicating that they complement one another rather than serve as substitutes. Studies that consider the adoption of the instruments of financial inclusion in isolation or use an index to measure financial inclusion ignore the important spillover effect the adoption of one instrument may have on the adoption of other instruments. Our estimation reveals that variables such as receipt of remittances, education level, social networks, access to electricity and employment status were significant determinants of the adoption of the instruments of financial inclusion.
The significant role of social networks in the adoption of financial inclusion instruments suggests the need for the establishment and strengthening of such organisations to enhance financial inclusion. In a post-conflict and fragile state like Burundi where information asymmetry is high, building such social institutions can aid in providing individuals with accurate information about financial inclusion and therefore encourage the financially excluded to be included.
The area of residence significantly influences both the adoption and intensity of adoption of the instruments of financial inclusion. People in urban areas are more likely to adopt more instruments than people in rural areas. This may be due to the poor or absence of infrastructure in rural areas. Therefore, infrastructural development such as the promotion of solar power can facilitate the use of mobile phones and the adoption of mobile money for those who can have access to mobile networks in rural areas. The impact of access to electricity on the adoption of financial inclusion instruments is profound, implying that having access to electricity is a necessary if not a sufficient condition for becoming financially included. It is therefore recommended that the government of Burundi accelerate its rural electrification project to increase access to electricity which will then enhance financial inclusion in the country. Additionally, the employment status of individuals was a significant driver of adoption, indicating that employers regularly paid their employees through their accounts. Policymakers can therefore leverage this to formalise all forms of employment and make it a requirement for all employers to pay their employees only through their financial accounts. This will encourage more employees to adopt the instruments of financial inclusion.
Two limitations of our study were that there was limited or no prior study that has been conducted to simultaneously examine the determinants of multiple instruments of financial inclusion. As such, our theoretical and methodological framework had to be adopted from other fields of interest where the adoption of multiple outcomes had been carried out. Additionally, although we aimed to examine the adoption of multiple instruments of financial inclusion, we limited the number of instruments to three, i.e., bank account, microfinance account and mobile money account. This is because of limited data on other instruments of financial inclusion. Future studies can expand on our analysis by including more instruments of financial inclusion to provide a broader understanding of the decision to adopt multiple instruments of financial inclusion.
Acknowledgments
The authors would like to express their gratitude to the study respondents.
Disclosure statement
The authors declare that they have no known competing financial interests or personal relationships that could have appeared to influence this research article.
Additional information
Funding
Notes on contributors
Jonathan Atta-Aidoo
Jonathan Atta-Aidoo is an Applied Economist at the Department of Environmental Science, KNUST – Ghana. His research interests include sustainable agricultural production, climate risks and adaptation, food security and financial development.
Saidi Bizoza
Saidi Bizoza is a researcher at the International Institute of Tropical Agriculture in Burundi. He received his bachelor’s degree in Rural Economics from the University of Burundi, Burundi, and an MSc degree in Agricultural and Applied Economics in a joint program run by Sokoine University of Agriculture, Tanzania, and the University of Pretoria, South Africa. His research areas include rural development, agriculture finance, and financial inclusion, agricultural program and project impact assessment, international trade, and policy in agricultural products.
Abdulkarim Onah Saleh
Abdulkarim Onah Saleh is a Lecturer at Nasarawa State University Keffi, Nigeria. He holds a Master of Science in Agricultural and Applied Economics from Sokoine University of Agriculture, Tanzania. Agribusiness management, farm productivity and sustainable agriculture, financial inclusion, and food security are among his research interests.
Ester Cosmas Matthew
Ester Cosmas Matthew is an early career researcher who has consulted for institutions such as the Sokoine University of Agriculture, International Livestock Research Institute (ILRI), International Institute of Tropical Agriculture (IITA), World Fish, and World Vegetable Center. She holds an MSc in Agricultural and Applied Economics from Sokoine University of Agriculture, Tanzania and University of Pretoria, South Africa. Her research interests include agriculture and food systems, rural development, gender and social equality in agriculture and financial inclusion.
References
- Adetunji, O. M., & David‐west, O. (2019). The relative impact of income and financial literacy on financial inclusion in Nigeria. Journal of International Development, 31(4), 312–21. https://doi.org/10.1002/jid.3407
- Aduda, J., & Kalunda, E. (2012). Financial inclusion and financial sector stability with reference to Kenya: A review of literature. Journal of Applied Finance & Banking, 2(6), 95.
- Aggarwal, S., Klapper, L., & Singer, D. (2013). Financing businesses in Africa: The role of microfinance. Palgrave Macmillan UK.
- Ajefu, J. B., & Ogebe, J. O. (2019). Migrant remittances and financial inclusion among households in Nigeria. Oxford Development Studies, 47(3), 319–335. https://doi.org/10.1080/13600818.2019.1575349
- Akinyemi, B. E., & Mushunje, A. (2020). Determinants of mobile money technology adoption in rural areas of Africa. Cogent Social Sciences, 6(1), 1815963. https://doi.org/10.1080/23311886.2020.1815963
- Akudugu, M. A. (2013). The determinants of financial inclusion in Western Africa: Insights from Ghana. Research Journal of Finance & Accounting, 4(8), 1–10.
- Allen, F., Demirguc-Kunt, A., Klapper, L., & Peria, M. S. M. (2016). The foundations of financial inclusion: Understanding ownership and use of formal accounts. Journal of Financial Intermediation, 27, 1–30. https://doi.org/10.1016/j.jfi.2015.12.003
- Amoah, A., Korle, K., & Asiama, R. K. (2020). Mobile money as a financial inclusion instrument: What are the determinants? International Journal of Social Economics, 47(10), 1283–1297. https://doi.org/10.1108/IJSE-05-2020-0271
- Anzoategui, D., Demirgüç-Kunt, A., & Pería, M. S. M. (2014). Remittances and financial inclusion: Evidence from El Salvador. World Development, 54, 338–349. https://doi.org/10.1016/j.worlddev.2013.10.006
- Asuming, P. O., Osei-Agyei, L. G., & Mohammed, J. I. (2019). Financial inclusion in sub-Saharan Africa: Recent trends and determinants. Journal of African Business, 20(1), 112–134. https://doi.org/10.1080/15228916.2018.1484209
- Atta-Aidoo, J., Matthew, E. C., Saleh, A. O., & Bizoza, S. (2022). Financial inclusion and household welfare in Burundi: What are the gender dynamics? African Economic Research Consortium (AERC) Discussion Paper
- Awunyo, D. (2018). Theoretical and conceptual framework of access to financial services by farmers in emerging economies: Implication for empirical analysis. Acta Universitatis Sapientiae, Economics and Business, 6(1), 43–59. https://doi.org/10.1515/auseb-2018-0003
- Aydemir, A., & Kırdar, M. (2017). Low wage returns to schooling in a developing Country: Evidence from a major policy reform in Turkey. Oxford Bulletin of Economics and Statistics, 79(6), 1046–1086. https://doi.org/10.1111/obes.12174
- Barajas, A., Beck, T., Dabla-Norris, E., & Yousefi, S. R., (2013). “Too cold, too hot, or just right? Assessing financial sector development across the globe?” IMF Working Paper 13/81.
- Belderbos, R., Carree, M., & Lokshin, B. (2004). Cooperative R&D and firm performance. Research Policy, 33(10), 1477–1492. https://doi.org/10.1016/j.respol.2004.07.003
- Bire, A. R., Sauw, H. M., & Maria, M. (2019). The effect of financial literacy towards financial inclusion through financial training. International Journal of Social Sciences and Humanities, 3(1), 186–192. https://doi.org/10.29332/ijssh.v3n1.280
- Brown, G. K., & Langer, A. (Eds.). (2012). Elgar handbook of civil war and fragile states. Edward Elgar Publishing.
- Buvinić, M., & Furst-Nichols, R. (2016). Promoting women’s economic empowerment: What works? The World Bank Research Observer, 31(1), 59–101.
- Cameron, A. C., & Trivedi, P. K. (2013). Regression analysis of count data (Vol. 53). Cambridge university press.
- Chen, Z., & Jin, M. (2017). Financial inclusion in China: Use of credit. Journal of Family & Economic Issues, 38(4), 528–540. https://doi.org/10.1007/s10834-017-9531-x
- Chinyere, N. U., Joshua, A. B., & Betsy, O. M. (2022). Review of financial inclusion and access to energy in West Africa. Applied Journal of Economics, Management and Social Sciences, 3(2), 17–27. https://doi.org/10.53790/ajmss.v3i2.29
- Claessens, S., & Rojas-Suarez, L. (2016). Financial regulations for improving financial inclusion. Center for Global Development, 2(3), 44–53.
- Clamara, N., Pena, X., & Tuesta, D. 2014. “Factors that Matter for Financial Inclusion: Evidence from Peru”. BBVA Working Paper 14/09
- Collier, P. (2009). The political economy of fragile states and implications for European development policy. Background paper for European Report on Development.
- Costa, A., & Ehrbeck, T. (2015). A market-building approach to financial inclusion. Innovations: Technology, Governance, Globalization, 10(1–2), 53–59. https://doi.org/10.1162/inov_a_00229
- Demirgüç-Kunt, A., & Klapper, L. (2013). Measuring financial inclusion: Explaining variation in use of financial services across and within countries. Brookings Papers on Economic Activity, 2013(1), 279–340. https://doi.org/10.1353/eca.2013.0002
- Demirgüç-Kunt, A., & Klapper, L. F. (2012). Measuring financial inclusion: The global findex database. World bank policy research working paper, (6025).
- Dorfman, J. H. (1996). Modelling multiple adoption decisions in a joint framework. American Journal of Agricultural Economics, 78(3), 547–557. https://doi.org/10.2307/1243273
- Efobi, U., Beecroft, I., & Osabuohien, E. (2014). Access to and use of bank services in Nigeria: Micro-econometric evidence. Review of Development Finance, 4(2), 104–114. https://doi.org/10.1016/j.rdf.2014.05.002
- Fanta, A. B., & Mutsonziwa, K. (2016). Gender and financial inclusion: Analysis of financial inclusion of women in the SADC region (Policy research paper No. 01/2016).
- Fransen, S., & Mazzucato, V. (2014). Remittances and household wealth after conflict: A case study on urban Burundi. World Development, 60, 57–68. https://doi.org/10.1016/j.worlddev.2014.03.018
- Fungáčová, Z., & Weill, L. (2015). Understanding financial inclusion in China. China Economic Review, 34, 196–206. https://doi.org/10.1016/j.chieco.2014.12.004
- Gelbard, M. E., Deléchat, C., Fuli, M. E., Hussain, M. M., Jacoby, M. U., Glaser, M. D., & Xu, R. (2015). Building resilience in sub-Saharan Africa’s fragile states. International Monetary Fund.
- Gioli, G., Khan, T., & Scheffran, J. (2013). Remittances and community resilience to conflict and environmental hazards in Northwestern Pakistan. In Frederick, S. (Ed.), Remittances flows to post-conflict states: Perspective on human security and Development (pp. 117–127). Pardee Center.
- Girón, A., Kazemikhasragh, A., Cicchiello, A. F., & Panetti, E. (2021). Financial inclusion measurement in the least developed countries in Asia and Africa. Journal of the Knowledge Economy, 13(2), 1–14. https://doi.org/10.1007/s13132-021-00773-2
- Global Findex Data. (2019) https://www.worldbank.org/en/publication/globalfindex#sec3
- Global Partnership for Financial Inclusion [GPFI]. (2020). G20 2020 financial inclusion action plan. https://www.gpfi.org/sites/gpfi/files/sites/default/files/G20%202020%20Financial%20Inclusion%20Action%20Plan.pdf
- Gopalan, S., & Rajan, R. S. (2018). Foreign banks and financial inclusion in emerging and developing economies: An empirical investigation. Journal of International Development, 30(4), 559–583. https://doi.org/10.1002/jid.3354
- Greene, W. H. (2012). Econometric analysis (Seventh ed.). Prentice Hall.
- Grohmann, A., Klühs, T., & Menkhoff, L. (2018). Does financial literacy improve financial inclusion? Cross country evidence. World Development, 111, 84–96. https://doi.org/10.1016/j.worlddev.2018.06.020
- H, G. W. (2012). Econometric analysis (Seventh ed.). Prentice Hall.
- Hunter, A. (2018). Return to sender: Remittances, communication and family conflict. In Retirement home? Ageing migrant workers in France and the question of return (pp. 105–127). IMISCOE Research Series.
- Izquierdo, N. C., & Tuesta, D. (2015). Factors that matter for financial inclusion: Evidence from Peru. Aestimatio: The IEB International Journal of Finance, 10, 10–31.
- Jack, W., & Suri, T. (2011). Mobile money: The economics of M-PESA (No. w16721). National Bureau of Economic Research.
- Jung, S. (2014). Does education affect risk aversion? Evidence from the 1973 British education reform. Paris School of Economics, WORKING PAPER N° 2014 – 13
- Kikulwe, E. M., Fischer, E., & Qaim, M. (2014). Mobile money, smallholder farmers, and household welfare in Kenya. PLos One, 9(10), e109804. https://doi.org/10.1371/journal.pone.0109804
- Kirui, B. K. (2022). The role of mobile money in international remittances: Evidence from Sub-Saharan Africa. African Economic Research Consortium (AERC) Research Paper 518.
- Koomson, I., Villano, R. A., & Hadley, D. (2020). Effect of financial inclusion on poverty and vulnerability to poverty: Evidence using a multidimensional measure of financial inclusion. Social Indicators Research, 1–27. https://doi.org/10.2139/ssrn.3518908
- Laha, A., Kuri, D., & Kumar, P. (2011). Determinants of financial inclusion: A study of some selected districts of West Bengal, India. Indian Journal of Finance, 5(8), 29–36.
- Lashitew, A. A., van Tulder, R., & Liasse, Y. (2019). Mobile phones for financial inclusion: What explains the diffusion of mobile money innovations? Research Policy, 48(5), 1201–1215. https://doi.org/10.1016/j.respol.2018.12.010
- Llanto, G. M., & Rosellon, M. A. D. (2017). What determines financial inclusion in the Philippines? Evidence from a national baseline survey (No. 2017-38). PIDS Discussion Paper Series.
- Lusardi, A., & Mitchell, O. S. (2014). The economic importance of financial literacy: Theory and evidence. American Economic Journal: Journal of Economic Literature, 52(1), 5–44. https://doi.org/10.1257/jel.52.1.5
- Maddala, G. S. (1983). Methods of estimation for models of markets with bounded price variation. International Economic Review, 24(2), 361–378. https://doi.org/10.2307/2648751
- Mago, S., & Chitokwindo, S. (2014). The impact of mobile banking on financial inclusion in Zimbabwe: A case for Masvingo Province. Mediterranean Journal of Social Sciences, 5(9), 221. https://doi.org/10.5901/mjss.2014.v5n20p415
- Manja, L. P., & Badjie, I. A. (2022). The welfare effects of formal and informal financial access in the Gambia: A Comparative assessment. SAGE Open, 12(1), 21582440221081111. https://doi.org/10.1177/21582440221081111
- Martey, E., & Kuwornu, J. K. (2021). Perceptions of climate variability and soil fertility management choices among smallholder farmers in northern Ghana. Ecological Economics, 180, 106870. https://doi.org/10.1016/j.ecolecon.2020.106870
- Mas, I., & Radcliffe, D. (2010). Mobile payments go viral. Yes Africa can: Success stories from a dynamic continent. World Bank.
- Mehry, E. B., Ashraf, S., & Marwa, E. (2021). The impact of financial inclusion on unemployment rate in developing countries. International Journal of Economics and Financial Issues, 11(1), 79. https://doi.org/10.32479/ijefi.10871
- Meli, S. D., Djoumessi, Y. F., & Djiogap, C. F. (2022). Analysis of the socio-economic determinants of mobile money adoption and use in Cameroon. Telecommunications Policy, 46(9), 102412. https://doi.org/10.1016/j.telpol.2022.102412
- Milana, C., & Ashta, A. (2020). Microfinance and financial inclusion: Challenges and opportunities. Strategic Change, 29(3), 257–266. https://doi.org/10.1002/jsc.2339
- Mndolwa, F. D., & Alhassan, A. L. (2020). Gender disparities in financial inclusion: Insights from Tanzania. African Development Review, 32(4), 578–590.
- Mohammed, J. I., Mensah, L., & Gyeke Dako, A. (2017). Financial inclusion and poverty reduction in Sub-Saharan Africa. African Finance Journal, 19(1), 1–22.
- Musa, A., Abdullahi, B., Idi, A., & Tasiu, M. (2015). Drivers of financial inclusion and gender gap in Nigeria. The Empirical Econometrics and Quantitative Economics Letters, 4(4), 186–199.
- Nandru, P., Anand, B., & Rentala, S. (2015). Factors influencing financial inclusion through banking services. Journal of Contemporary Research in Management, 10(4), 17–30.
- Nandru, P., Byram, A., & Rentala, S. (2016). Determinants of financial inclusion: Evidence from account ownership and use of banking services. International Journal of Entrepreneurship and Development Studies, 4(2), 141–155.
- Nandru, P., Chendragiri, M., & Velayutham, A. (2021). Examining the influence of financial inclusion on financial well-being of marginalized street vendors: Empirical evidence from India. International Journal of Social Economics, 48(8), 1139–1158. https://doi.org/10.1108/IJSE-10-2020-0711
- Nandru, P., & Rentala, S. (2020). Demand-side analysis of measuring financial inclusion: Impact on socio-economic status of primitive tribal groups (PTGs) in India. International Journal of Development Issues, 19(1), 1–24. https://doi.org/10.1108/IJDI-06-2018-0088
- Nkurunziza, J. D. (2010). Why is the financial sector in Burundi not development-oriented? Working Paper, EUI RSCAS, 2010/29, European Report on Development
- Nkurunziza, J. D. (2016). Msmes financing in Burundi and its welfare effect (No. 0111). University of Namur, Department of Economics.
- Nkurunziza, J. D. (2022). The origin and persistence of state fragility in Burundi. In Bizhan, N. (Ed.), State fragility (pp. 101–140). Routledge.
- Noor, N., Batool, I., & Arshad, H. M. (2020). Financial literacy, financial self-efficacy and financial account ownership behavior in Pakistan. Cogent Economics & Finance, 8(1), 1806479. https://doi.org/10.1080/23322039.2020.1806479
- Nsiah, A. Y., & Tweneboah, G. (2023). Determinants of financial inclusion in Africa: Is institutional quality relevant? Cogent Social Sciences, 9(1), 2184305. https://doi.org/10.1080/23311886.2023.2184305
- Nyoka, C. (2019). Education level and income disparities: Implications for financial inclusion through mobile money adoption in South Africa. Comparative Economic Research Central and Eastern Europe, 22(4), 129–142. https://doi.org/10.2478/cer-2019-0036
- Okello Candiya Bongomin, G., Mpeera Ntayi, J., Munene, J. C., & Malinga Akol, C. (2017). Financial intermediation and financial inclusion of poor households: Mediating role of social networks in rural Uganda. Cogent Economics & Finance, 5(1), 1362184. https://doi.org/10.1080/23322039.2017.1362184
- Okello Candiya Bongomin, G., Ntayi, J. M., Munene, J. C., & Malinga, C. A. (2018). Mobile money and financial inclusion in sub-Saharan Africa: The moderating role of social networks. Journal of African Business, 19(3), 361–384. https://doi.org/10.1080/15228916.2017.1416214
- Olaniyi, E., & Adeoye, B. (2016). Determinants of financial inclusion in Africa: A dynamic panel data approach. University of Mauritius Research Journal, 22, 310–336.
- Park, C. -Y., & Mercado, R. V. (2018). Financial inclusion, poverty, and income inequality in developing Asia. The Singapore Economic Review, 63(01), 185–206. https://doi.org/10.1142/S0217590818410059
- Pham, T., & Talavera, O. (2018). Discrimination, social capital, and financial constraints: The case of Viet Nam. World Development, 102, 228–242. https://doi.org/10.1016/j.worlddev.2017.10.005
- Pitt, M. M., & Khandker, S. R. (1998). The impact of group-based credit programs on poor households in Bangladesh: Does the gender of participants matter? Journal of Political Economy, 106(5), 958–996. https://doi.org/10.1086/250037
- Roy, P., & Patro, B. (2022). Financial inclusion of women and gender gap in access to finance: A systematic literature review. Vision: The Journal of Business Perspective, 26(3), 282–299. https://doi.org/10.1177/09722629221104205
- Sanderson, A., Mutandwa, L., & Le Roux, P. (2018). A review of determinants of financial inclusion. International Journal of Economics and Financial Issues, 8(3), 1.
- Sarma, M., & Pais, J. (2011). Financial inclusion and development. Journal of International Development, 23(5), 613–628. https://doi.org/10.1002/jid.1698
- Siddik, N. A., Sun, G., Shanmugan, J., & Yanjuan, C. (2016). Impacts of e-banking on performance of banks in a developing economy: Empirical evidence from Bangladesh. Journal of Business Economics and Management, 17(6), 1066–1080. https://doi.org/10.3846/16111699.2015.1068219
- Simatele, M., & Maciko, L. (2022). Financial inclusion in rural South Africa: A qualitative approach. Journal of Risk and Financial Management, 15(9), 376. https://doi.org/10.3390/jrfm15090376
- Slade, E. L., Dwivedi, Y. K., Piercy, N. C., & Williams, M. D. (2015). Modelling consumers’ adoption intentions of remote mobile payments in the United Kingdom: Extending UTAUT with innovativeness, risk, and trust. Psychology & Marketing, 32(8), 860–873. https://doi.org/10.1002/mar.20823
- Soumaré, I., Tchana, F. T., & Kengne, T. M. (2016). Analysis of the determinants of financial inclusion in central and West Africa. Journal of Transnational Corporations Review, 8(4), 231–249. https://doi.org/10.1080/19186444.2016.1265763
- Tinta, A. A., Ouédraogo, I. M., & Al‐hassan, R. M. (2022). The micro determinants of financial inclusion and financial resilience in Africa. African Development Review, 34(2), 293–306. https://doi.org/10.1111/1467-8268.12636
- Toxopeus, H. S., & Lensink, R. (2007). Remittances and financial inclusion in development, WIDER Research Paper, No. 2007/49, ISBN 9291909947=978-92-9190-994-0, The United Nations University World Institute for Development Economics Research (UNU-WIDER), Helsinki
- Triki, T., & Faye, I. (Eds.). (2013). Financial inclusion in Africa. African Development Bank.
- Tuesta, D., Sorensen, G., Haring, A., & Cámara, N. (2015), Financial inclusion and its determinants: The case of Argentina BBVA Research working paper no.15/03.
- Uddin, A. A., Chowdhury, M. A. F., & Islam, N. (2017). Determinants of financial inclusion in Bangladesh: Dynamic GMM and quantile regression approach. Journal of Developing Areas, 51(2), 221–237. https://doi.org/10.1353/jda.2017.0041
- Ulen, T. S. (1999). Rational choice theory in law and economics. Encyclopedia of Law and Economics, 1, 790–818.
- Wale, L. E., & Makina, D. (2017). Account ownership and use of financial services among individuals: Evidence from selected Sub-Saharan African economies. African Journal of Economic and Management Studies, 8(1), 19–35. https://doi.org/10.1108/AJEMS-03-2017-146
- Wamuyu, V., Jagongo, A., & Musau, S. (2022). Digital credits and financial inclusion among the youth in Kenya. African Journal of Emerging Issues, 4(3), 130–139.
- Winkelmann, R. (2008). Econometric analysis of count data. Springer Science & Business Media.
- World Bank. (2014). Global Findex database 2014: Measuring financial inclusion around the world.
- World Bank. (2022). Overview of financial inclusion. Assessed on 17 November 2022 from https://www.worldbank.org/en/topic/financialinclusion/overview
- The World Factbook. (2021). https://www.cia.gov/the-world-factbook/countries/burundi/
- Zins, A., & Weill, L. (2016). The determinants of financial inclusion in Africa. Review of Development Finance, 6(1), 46–57. https://doi.org/10.1016/j.rdf.2016.05.001