
 ?Mathematical formulae have been encoded as MathML and are displayed in this HTML version using MathJax in order to improve their display. Uncheck the box to turn MathJax off. This feature requires Javascript. Click on a formula to zoom.
Abstract
Climate-Smart Agriculture (CSA) presents the opportunity to meet the world increasing food demands in the face of climate variability. In Kenya, CSA has been promoted as a means of adapting to climate change among Kenyan farmers under Kenya Climate Smart Agriculture Project (KCSAP) and farmers’ participation is key. This study, therefore, sought to identify the extent of participation in climate-smart agricultural projects (CSAPs) in terms of longevity of farmers’ participation in CSAPs and the number of climate-smart agricultural practices adopted from the projects by the farmers in Kakamega County, Kenya. Multi-stage sampling technique was employed to collect cross-sectional primary data from 240 project participants in Kakamega County, Kenya. Data collected were analyzed using descriptive statistics and Tobit regression model. Results revealed that farmers’ extent of participation in CSAPs in terms of both longevity and number of climate-smart practices adopted from the project was positively and significantly influenced by the type of project funder and number of climate-smart practices offered by the projects. The longevity was significantly and negatively influenced by frequency of extension visits and distance to the market while the number of climate-smart practices adopted was significantly negatively influenced by distance to the market and legal land ownership status. The study recommended the need for expansion and promotion of climate-smart agricultural projects to non-benefiting communities in order to accelerate economic growth and poverty reduction through partnerships between the national and international governments funding agricultural projects and closer collaboration with local leaders, extension agents and more youthful farmers.
1. Introduction
The economic growth and efforts to reduce poverty in many nations heavily rely on the agricultural sector. The effects of climate change on agriculture production are among the top global concerns. Food insecurity is being addressed through climate-smart agriculture (CSA), which is becoming widely accepted as a viable solution. CSA offers a unique opportunity to adapt to the effects of climate change while at the same time mitigating GHG emissions (Abegunde et al., Citation2019). In order to improve income levels, food security, and development, CSA focuses on three main objectives: (1) a sustainable increase in agricultural productivity; (2) adaptation to climate change from a micro to a macro level; and (3) a reduction or elimination of greenhouse emissions, where possible (Abegunde et al., Citation2019). As a result, CSA is more receptive to the accomplishment of Sustainable Development Goals (SDGs) 2 and 13.
Launching a CSA strategy as part of its development initiatives that aim to simultaneously achieve food security and sustainable development, Kenya has reacted to the international demand to reduce and adapt to the consequences of climate change, just like any other country that is vulnerable to them (Waaswa et al., Citation2022). The Kenya Climate Smart Agriculture Project (KCSAP), developed by the Kenyan government and the World Bank to tackle climate change on smallholder farms in Kenya, is one example of this type of program. KCSAP is being implemented over a five year period (2017–2022) under the framework of the Agriculture Sector Development Strategy (ASDS) (2010–2020) and National Climate Change Response Strategy (Symons, Citation2014). The project is implemented within five components: Component 1: Upscaling Climate-Smart Agricultural Practices; Component 2: Strengthening Climate-Smart Agricultural Research and Seed Systems; Component 3: Supporting Agro-weather, Market, Climate, and Advisory Services; Component 4: Project Coordination and Management; Component 5: Contingency Emergency Response. KCSAP will cost a total of USD 279 million with USD 250 million financing from the World Bank and a Government contribution of USD 29 million.
Farmers’ participation in programmes such as Climate Smart Agricultural Projects (CSAPs) is an important factor for sustainable agricultural development in rural areas as it is considered necessary to get community support for agricultural development projects (Cole, Citation2007). Participation in agricultural projects means empowering farmers and giving them responsibility so that they feel that they own the projects, which helps in ensuring that the projects are compatible with the local environment and do not have conflicts with the target group (Nxumalo & Oladele, Citation2013). Studies have shown that inclusiveness and active involvement of all stakeholders nurtures a deep sense of pride and ownership of the joint venture (Kumar, Citation2002). This active participation also ensures that the venture can outlive its existence to future generations (Garande & Dagg, Citation2005). Without participation, there are obviously no partnerships, no developments, and no program. Therefore, a lack of participation in the decision to implement an agricultural policy can lead to failure in the agricultural development (Aref, Citation2011). Farmers’ participation in agricultural projects has a direct impact on technological awareness, adoption, poverty, the performance of the agricultural sector, and the macroeconomy (Etwire et al., Citation2013). Previous studies (Etwire et al., Citation2013; Jamilu et al., Citation2015; Nahayo et al., Citation2017; Nxumalo & Oladele, Citation2013) analyzed factors influencing farmers’ participation in agricultural projects from the viewpoint of farmers participating or otherwise. The extent of participation has been neglected with only few studies oriented to this angle (Chesterman et al., Citation2019; Ngavara et al., Citation2021; Martey et al., Citation2014). The extent of participation is a very crucial factor as it enables one to measure how farmers have been empowered either through the number of activities that the farmer undertakes, or the length of time that the farmer can stay consistent in the project. This gives farmers responsibility as they feel that they own the projects and thus contribute to the sustainability of the project which is the major goal of setting up projects by governmental and non-governmental organizations.
In Kenya, there is a growing concern about the weak participation of farmers in CSAPs. For example, in Kakamega County, poverty still persists with 51% of the proportion of people living below the poverty line (MoALF, Citation2017) despite the existence of CSAPs which have the potential to reduce the poverty levels through the adoption of the various practices for increased household income and food security. Moreover, there is no study conducted so far to assess the determinants of smallholder farmers’ extent of participation in CSAPs in Kenya. This research went further and assessed the farmers’ extent of participation in CSAPs. Thus, the specific objective of this study was to determine socioeconomic and institutional factors influencing farmers’ extent of participation in CSAPs. The study findings are intended to inform the policy-makers to improve the implementation of CSA practices for sustainable agricultural production. This study adds to the existing knowledge on agricultural projects and significantly informs governmental and non-governmental agencies of the crucial areas to focus on in order to enhance sustainable agricultural development through project implementations.
2. Methodology
2.1. Study area
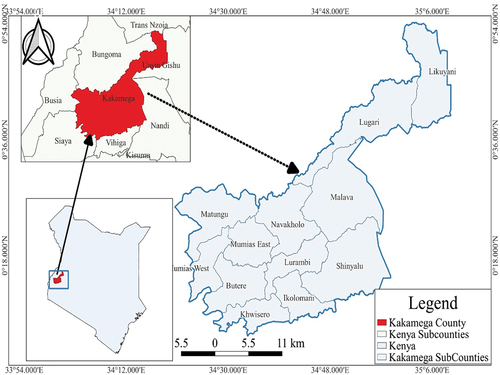
This study was undertaken in Kakamega County, Kenya (Figure ) and largely borrows from Okumu et al. (Citation2021). Kakamega county was purposively selected because it was one of the 24 Counties where the Kenya Climate Smart Agriculture Project (KCSAP) have been rolled out in Kenya. Kakamega county is located in Western Kenya and lies between longitudes 34° 32ʺ and 35° 57ʹ30 E of the prime meridian and latitudes 0° 07ʹ30ʺ N and 0° 15ʺ N of the equator. Administratively, the County has 12 sub-counties namely Ikolomani, Lurambi, Malava, Navakholo, Shinyalu, Lugari and Likuyani sub counties which covers the central and northern parts of the county and Matungu, Mumias East, Mumias West, Butere and Khwisero in the southern part of the county. According to the County Government of Kakamega (CGOK) Integrated Development Plan (2018–2022), it covers an approximate area of 3051 km2 with a population density of 1,660,651. This translate to a population density of 554.3/km2. Annual rainfall ranges between 1250 and 1750 mm with an altitude range between 1240 and 2000 metres above sea level. Agriculture is the backbone of the County accounting for over 65% of total earnings. The average farm size is approximately 0.6 ha for small scale farmers while large scale farmers have an average of 4 ha (CGOK, Citation2017). According to KNBS (Citation2019), the main food crops in the County include cereals (maize, sorghum, finger millet and rice), pulses (beans and grams), and roots/tubers (cassava, sweet and arrowroots). Agriculture employs 80% of the population and is critical to livelihoods in the Kakamega county. This is significant because poverty levels in county is above 50% (KNBS, Citation2019). Poverty is one of the critical drivers of vulnerability to climate change risks and maladaptive practices to CSAPs.
Figure 1. Map of the study area.
2.2. Research design, sample and sampling technique
This study used cross-sectional research design to collect data. Cross-sectional design allows data collection at one specific point in time from selected individuals (Kothari, Citation2004). This design was relevant to this study as it enabled the researcher to gather data from a pool of participants with varied characteristics from each sub-county at one point in time within a short period of time. The multi-stage sampling technique was employed. The Sub County Agriculture Officers (SCAOs) at the Ministry of Agriculture, Livestock and Fisheries were visited to obtain the most recent sampling frame of farmers in the sub county. From the provided list systematic sampling was conducted to select farmers both project participants and non-participants whereby after the first farmer in the list every fifth farmer was selected. According to White (Citation2018) a 25% to 30% range for control group is a good compromise, however minimal losses in statistical power occur when the control size is shrunk to 40%. This study therefore adopted 37.5% control group size i.e. 144 project non-participants exposing 62.5% of the sample to the treatment (240 project participants). To achieve the sample size, 20 project participants and 12 project non-participants were to be selected from each of the 12 sub-counties in Kakamega County. Every selected farmer was then called to confirm their location and whether they had ever participated in an agricultural project or not. They were later visited for administration of the questionnaires. A total of 20 project participants and 12 project non-participants selected sums up to a total of 32 respondents from each sub-county and 384 farmers in the whole county. In addition, one sub county agriculture officer was selected from the 12 sub-counties as key informants adding up to a total of 12 key informants. However, for the purpose of this paper only data from project participants was used since this a continuation of the study by Okumu et al. (Citation2021).
2.3. Data collection procedure
Primary data were collected electronically on android smartphones and tablets through face-to-face interviews using a semi-structured questionnaire by a team of trained enumerators. Information on gender, age, marital status, household size, farm size under agriculture, education level, legal land ownership status, type of project funders, number of CSA practices adopted, training, access to credit, frequency of agricultural extension visits and market distance was gathered to determine socio-demographic and institutional factors influencing farmers’ extent of participation in climate-smart agriculture projects. All the Ministry of Health guidelines against the COVID-19 virus were observed by the enumerators. The data obtained were then downloaded from KoboCollect as Comma-separated values (CSV) files and exported to STATA version 16.0 for analysis. To check the understandability and validity of the questionnaire before data collection, a pre-test was carried out. This helped in assessing the ease of respondents’ understanding of the questions and their appropriateness under the study context. It also helped in refining the questionnaire making it farmer friendly
2.4. Conceptual framework and variables
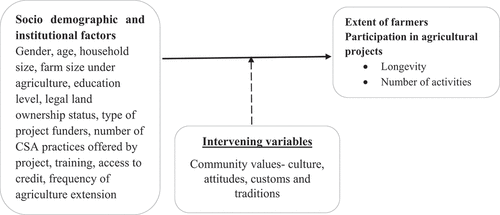
One set of the independent variables was socio-demographic and institutional factors influencing extent of farmers’ participation in agricultural development projects; the effect of gender, age, household size, farm size under agriculture, education level, legal land ownership status, type of project funders, number of CSA practices adopted, training, access to credit, frequency of agriculture extension visits and market distance on longevity of farmers’ participation in agricultural development project and number of practices adopted from the project by the farmer while the intervening variables included Community values- culture, attitudes, customs and traditions (Figure ).
Figure 2. Conceptual framework.
2.5. Analytical methods
2.5.1. Descriptive statistics
Descriptive statistics was generated using STATA version 16.0 software. Data was analyzed to generate means and frequencies which gave the description of households in the study sites.
2.5.2. Analytical framework
For this study, the farmers’ extent of participation was measured in terms of how long the farmer has participated in the climate-smart agricultural projects (longevity) and in terms of the number of practices that the farmer has adopted from the project. Since the dependent variables, longevity and number of practices, have a special feature with two outcomes: either equal to zero or positive numbers of years and equal to zero or positive numbers of practices. The most adequate approach to apply is the Censored Tobit regression model. The response variable is censored at zero and therefore the data are censored in the lower tail of the distribution. According to Odah et al. (Citation2018), a tobit regression model is given by:
Where is the observed variable of interest, and
is the latent variable. The random effects
and the error term
are assumed to be
) and
) respectively and independent of
which are gender, age, education level, household dependents farm size under agriculture, farming experience, legal land ownership status, type of project funders, number of CSA practices adopted, training, access to credit, frequency of agricultural extension visits, and market distance variables.
Estimates the maximum likelihood estimation (Amemiya, Citation1984; Odah et al., Citation2018).
2.5.3. Model diagnostic tests
Before conducting the Tobit regression analysis, all the selected independent variables to be used were checked for the existence of a multicollinearity problem. The Variance Inflation Factor (VIF) which measures the severity of multicollinearity was used to test the association between continuous explanatory variables in an ordinary least square (OLS) regression analysis while a Pearson’s contingency coefficient test (CC), a Chi-square-based measure of association for categorical data was used for discrete explanatory variables. As shown in Table , the VIFs results indicate that the data had no serious problem of multicollinearity. The mean VIF is 1.39. The VIF of the explanatory variables ranges from 1.03 to 1.92. The independent variables’ VIF is less than five. No significant correlations between any of the independent variables were established, ruling out the possibility of multicollinearity. VIF is calculated using the formula shown in Equationequation 4(4)
(4) ;
Table 1. Variance inflation factor test results for continuous explanatory variables
Where: = the coefficient of correlation among explanatory variables and R2 of the regression with the ith independent variable as a dependent variable.
Table presents Pearson’s contingent coefficients results for the categorical variables. Results show that there was no serious association among the categorical variables, as all the contingent coefficients were less than 1 showing either a strong negative or positive association.
Table 2. Pearson’s contingency coefficient test results for categorical explanatory variables
Where: C = Coefficient of contingency
Chi-square random variable
N = Total sample size.
3. Results and discussion
3.1. Descriptive statistics
Gender, age, household size, education level, marital status, land ownership, farm size, farmer occupation, access to credit, access to agricultural extension services, and frequency of use of extension services are among the socioeconomic characteristics of the participants that were collected for this study. Male-headed households made up 60.83% of the sample as compared to female-headed households, which made up 39.17%. Many of the households interviewed were headed by men who had a say in the adoption of CSAP programs. The highest levels of education attained were non-formal, primary, secondary, and tertiary education, with 5.42%, 51.25%, 35.83%, and 7.50%, respectively. The majority of the households had completed primary school. The ability to adapt in the wake of climate change is increased by formal education (Table ).
Table 3. Categorical Socio-economic characteristics of CSAPs project participants in Kakamega County, Kenya
In terms of the farmers’ marital status, a major portion (99.17%) of the chosen sample was married, with only 0.42% single and 0.42% widowed. Regarding their legal land ownership status, 77.08% of the respondents indicated that they were the only owners of their land and that they had title deeds, while roughly 22.50% said they lacked such documents. The property on which they farmed was either rented, owned jointly, or belonged to the family.
With farm income being the primary source of income for 99.17% of respondents and non-farm income for 0.83%, farming was the majority of respondents’ primary occupation. This demonstrates that the majority of respondents worked as farmers full-time. Farmers who engage in off-farm income-generating activities have limited access to extension professionals, which causes them to know less about intended interventions like CSA initiatives.
In terms of loan availability, 79.17% of people had access to agricultural credit whereas 20.83% did not. Last but not least, 97.50% of respondents had access to extension services, while 2.50% did not.
The average age of the farmers was 52.48 years, and they had an average of 21.06 years of agricultural experience. The average farm size, which includes sole, family, and joint ownership parcels of land, was 1.75 acres in terms of resource endowments for the uptake of CSAPs (Table ). Additionally, the findings show that project participants made extension contacts 2.16 times more frequently.
Table 4. Descriptive statistics of continuous socio-demographic and economic variables
3.2. Extent of farmers’ participation in agricultural projects
Extent of farmers’ participation was measured in terms of how long the farmer had been a participant of the agricultural development project (longevity of participation) and the number of practices that the farmer had adopted from the project out of the total number of practices offered by the agricultural development projects.
From Table , descriptive statistics results on extent of farmers’ participation in terms of longevity reveal that the highest number of months that the farmer participated in the projects was 20 months (1 year 8 months) while the minimum was 0 for the non-participants. On average farmers participated in the projects for a period of about 5 months. This confirms the low participation levels of farmers in agricultural development projects as most of the projects under study were running for a period of 5 years. These results are backed up by Ouma (Citation2016) who affirmed that people’s participation in their own projects had not yet attained the acceptable levels that qualify to imply full participation
Table 5. Descriptive statistics of extent of farmers’ participation in agricultural projects
With regard to extent of farmers’ participation in terms of number of practices adopted from the project, results show a mean ratio of 0.73 indicating that out of the total number of practices offered by the projects farmers adopted at least 73% of the practices. This illustrates high level of farmers’ willingness to adopt project interventions. This could be explained by the fact that partnering with developmental agencies increases benefits accessible to farmers leading to higher adoption and utilization of agricultural practices (Amudavi, Citation2007)
3.3. Factors influencing the extent of participation in CSAPs
Farmers’ extent of participation was measured in terms of how long the farmer had been a participant in the climate-smart project (longevity) and the number of practices that the farmer had adopted from the climate-smart agricultural projects. The overall significance and fitness of the Tobit regression model was checked with the LR values; accordingly, Prob> chi2 = 0.000 indicates that the independent variables reliably predict the dependent variable (Table ).
Table 6. Tobit regression estimates of socio-economic factors influencing longevity and number of practices adopted from the projects
Among the selected socioeconomic and institutional characteristics, The Tobit regression analysis revealed that the type of project funder (National government or International non-governmental organization), number of climate-smart practices offered by the project, frequency of extension visits, and distance to the market are the main variables that had a statistically significant influence on the longevity of farmers’ participation in climate-smart agricultural practices. On the other hand, legal land ownership status, type of project funder (National government or International non-governmental organization), number of climate-smart practices offered by the project, and distance to the market were the main variables that had a statistically significant influence on the number of practices adopted by the farmer. Overall, from the results, the type of project funder, the number of climate-smart practices offered by the project, and distance to the market influence farmers’ extent of participation in climate-smart agricultural projects both in terms of longevity and number of practices adopted by the farmer.
The type of project funder (National government or International non-governmental organization) had a significant influence on the longevity of farmers’ participation in a project at a 1% level of significance. The longevity of farmers’ participation in projects funded by international organizations (German Cooperation) was lower compared to the participation in projects funded by the national government of Kenya by about 18 months. This could be attributed to trust issues among participants and project funders. Farmers can rely more on the interventions of the national government than non-governmental organizations because the participants are familiar with and have a relationship with the national government implementing agencies like the Ministry of Agriculture which they can directly sanction in case of poor performance of the adopted practices or the project at large. On the other hand, Non-governmental organizations have a chain of long and complex accountability relationships stretching from an international donor through the national government and implementing agencies to a set of ultimate end users. In addition, its implementing personnel are highly mobile and do not stay in one location for an extended time. This might make it difficult for farmers to be uncertain about whom to hold accountable for the ultimate delivery of goods and services (Winters, Citation2010). These findings are consistent with those of Kumar (Citation2002) who states that externally assisted projects in most cases are not sustainable and fail to continue once donor withdraws their support, particularly funding. Dollar and Levin (Citation2005) also suggest that a positive relationship exists between national governance quality and project performance.
Regarding the number of practices adopted by the farmer, the marginal effects at a 10% level of significance indicate that the number of practices adopted by the farmers from projects funded by international organizations (Swedish Government) is more compared to the national government of Kenya by about 37%. This could be explained by the fact that international governments avail adequately budgeted funds for their projects with legally defined institution frameworks for the flow of resources. This ensures timely and sufficient injection of funds which complements cost sharing among farmers and also supports efficient delivery of agricultural extension services and training during implementation. This enhances a higher adoption of climate-smart practices among participants (Echeme, Citation2009). On the other hand, government-funded projects most time only provide technical assistance to the participants. In case some financial assistance is provided to farmers then the projects are likely to experience late and insufficient supply of funds as national governments may shift funds to alternative purposes (Echeme, Citation2009). According to (Chandra, Citation2008) availability of adequate funds has a direct connection with the expeditious performance of projects. Firms with adequate funds had successfully completion of their projects. Shiferaw et al. (Citation2009) also concur with these findings by supporting that enabling policies and programs support play a positive role in stimulating farmers’ investment in the adoption of sustainable technologies.
Number of practices offered by the project returned a positive and significant coefficient at 5% and 10% level of significance for longevity and number of practices adopted by the farmer respectively. The marginal effects indicate that when a project introduces an additional climate smart practice, longevity of participation in climate smart projects increases marginally by 2 months whereas the number of practices adopted by the farmer increases by 45%. This suggests that the more the number of practices offered by the project the more likely it is for farmers to participate in a project for a longer time and adopt more practices. These results could be explained by the fact an increment in the number of practices offered by the project significantly builds the confidence of the farmer in the project hence reducing the perceived risks and uncertainties in their mind. This subsequently influences the number of practices adopted and their length of participation in the project. According to Rogers (Citation2003) and Wossink & Boonsaeng (Citation2003), perception is an important prerequisite that determines decisions and actions of farmers in the course of adopting agricultural technologies or practices. These findings are supported by Amudavi (Citation2007) who asserted that partnering with developmental agencies increased benefits accessible to farmers and also promoted collaborative learning leading to higher adoption and utilization of agricultural practices.
Longevity of farmers’ participation in climate smart agricultural projects was also negatively influenced with frequency of extension services at 10% level of significance. This implies that an increment in the frequency of extension agent visits to the farmer lowers the likelihood of farmers remaining participants of the projects. This could be explained by the fact that regular contact with extension officers enhances farmers’ knowledge and equips them well with the necessary techniques. This may seem as a good thing but on the other hand it may bear a negative consequence on the number of years that a farmer would participate in the project. Once a farmer is able to frequently and easily access information and training on the adopted climate smart practices the chances of opting out from the project increase. Findings of this study concur with those of Tologbonse et al. (Citation2013) & Jamilu et al. (Citation2015) who noted frequency of extension contact influenced farmers’ participation in projects. However, there was a contradiction in the results as there was a positive association between frequency of extension contact and project participation. It is important to note that the contradiction could be as a result of the different measurement levels of participation. Whereas this study determined extent of farmers participation in terms of farmers longevity level of project participation, Tologbonse et al., (Citation2013) used number of agricultural practices or programmes the participant were engaged in during farming season under study. Jamilu et al. (Citation2015) on the other hand treated participation as a dummy variable.
Distance to the market had a significant negative effect on longevity of farmers’ participation in a project and the number of practices adopted at 10% and 5% level of significance respectively. The results imply that a decrease in the distance to the nearest market by one kilometer increases the likelihood of a farmer adopting more climate smart practices and increasing his time of participation in a project. Decreasing the distance from the market decreases the transportation cost of agricultural inputs and outputs. Adoption of more climate smart practices from the project will automatically trigger longer participation as an additional new practice requires access to new knowledge and proper skills. Continued project participation guarantees extension information, capacity building benefits and even lowered cost inputs. These findings are in line with Tefera et al. (Citation2016) findings that showed that maize and teff technology package adoption improved as the households’ residences became closer to market while the reverse held true for wheat technology package adoption. However, Sithole et al. (Citation2014) found out that access to the market had no significant influence on the farmers’ participation in irrigation scheme.
Finally, legal land ownership status returned a significantly negative effect on the number of practices adopted by the farmer at 1 % level of significance. The number of practices adopted by farmers who did not have title deeds to the land they cultivated on (family land) were less compared to farmers who had title deeds to their land (sole owners) by about 42%. These result could be explained by the fact that lack of tenure security can encourage shortsighted decisions and irresponsible use of land resources (B. O. Okumu, Citation2018). This findings are consistent with Udayakumara et al. (Citation2010) who found that farmers who cultivate land owned by others were less likely to participate and invest in soil and water conservation projects. These findings are also backed up by Adusumilli and Wang (Citation2019) whose results show that results show that owners, irrespective of their length of ownership, are more willing to participate in conservation programs. These findings however contradicts those of Caswel et al., who found out that ownership of the surveyed field had less impact on practice adoption, based on the hypothesis that landowners would be more likely to invest in new practices than renters. However he found out that Investment in irrigation technologies, which have high initial costs, was more likely for owners rather than renters, but the difference was small.
4. Conclusion and policy recommendations
The study aimed at determining socioeconomic and institutional factors influencing farmers’ extent of participation in CSAPs in terms of longevity of farmers’ participation and the number of climate smart agricultural practices adopted from the projects by the farmers. From the censored Tobit regression results, it can be concluded that the type of project funder (international agencies or national government), number of agricultural practices offered by the project and distance to the market are the major influencers of extent of farmers’ participation in agricultural development projects. These factors had a significant influence on extent of farmers’ participation both in terms of longevity of participation and number of practices adopted by the farmer.
Based on the findings of the study, project implementers should embrace partnerships between the national government and international agencies funding agriculture projects in order to offer a wide variety of new climate smart agricultural practices and enhance high farmer participation in terms of both longevity and high practice adoption. Establishment of marketing arrangements within the projects to bring down transaction costs, bargain for better prices and enforce farmer trader contracts should also be adopted.
Contributions
All the authors contributed to this work. The first author designed the study, collected and analyzed the data, interpreted the results and drafted the manuscript. The second author contributed to the design the study interpreted of the data and drafting the manuscript. All authors read and approved the final manuscript.
Disclosure statement
No potential conflict of interest was reported by the authors.
Data availability statement
The data that support the findings of this study are available from the corresponding author upon reasonable request.
Additional information
Funding
Notes on contributors
Janet Julie Okumu
Janet Julie Okumu is a Master of Science in Agricultural Economics Student in the School of Agriculture and Food Security, Maseno University, Kenya.
Kenneth Waluse Sibiko
Dr Kenneth Waluse Sibiko is a Postdoctoral Social Scientist at Alliance of Bioversity International and CIAT. He is also a Lecturer of Agricultural Economics in the School of Agriculture and Food Security, Maseno University, Kenya. He holds a PhD in Agricultural Economics from the University of Goettingen, Germany.
Phoebe Bwari Mose
Dr Phoebe Bwari Mose is a Lecturer of Agricultural Economics in the School of Agriculture and Food Security, Maseno University, Kenya. She holds a PhD in Agricultural Economics from Maseno University, Kenya.
Kevin Okoth Ouko
Kevin Okoth Ouko a Doctoral Fellow in Food Security and Sustainable Agriculture at Jaramogi Oginga Odinga University of Science and Technology, Kenya. He is currently a Research Associate Consultant for WorldFish.
References
- Abegunde, V. O., Sibanda, M., & Obi, A. (2019). Determinants of the adoption of climate-smart agricultural practices by small-scale farming households in King Cetshwayo district Municipality, South Africa. Sustainability, 12(1), 195. https://doi.org/10.3390/su12010195
- Adusumilli, N., & Wang, H. (2019). Conservation adoption among owners and tenant farmers in the Southern United States. Agriculture, 9(3), 53. https://doi.org/10.3390/agriculture9030053
- Amemiya, T. (1984). Tobit models: A survey. Journal of Econometrics, 24(1–2), 3–16. https://doi.org/10.1016/0304-4076(84)90074-5
- Amudavi, D. (2007). The effects of farmer community group participating on rural livelihoods in Kenya. Decentralization and the Social Economics of Development: Lessons from Kenya, 159–188. https://doi.org/10.1079/9781845932695.0159
- Aref, F. (2011). Farmers’ participation in agricultural development: The case of fars province, Iran. Indian Journal of Science & Technology, 4(2), 155–158. https://doi.org/10.17485/ijst/2011/v4i2.17
- CGOK. (2017). County integrated development plan 2017–2022. Kakamega County. https://kakamega.go.ke/download/kakamega-county-urban-institutional-development-strategy-2018-2022/
- Chandra, P. (2008). Projects planning; analysis selection, financing, implementation and review. Pashupati printers pvt.ltd.
- Chesterman, N. S., Entwistle, J., Chambers, M. C., Liu, H. C., Agrawal, A., & Brown, D. G. (2019). The effects of trainings in soil and water conservation on farming practices, livelihoods, and land-use intensity in the Ethiopian highlands. Land Use Policy, 87, 104051. https://doi.org/10.1016/j.landusepol.2019.104051
- Cole, S. (2007). Tourism, culture and development: Hopes, dreams and realities in East Indonesia. Channel view publications. https://doi.org/10.21832/9781845410711
- Dollar, D., & Levin, V. (2005). Sowing and reaping: Institutional quality and project outcomes in developing countries. Available at SSRN 667882.
- Echeme, I. I. (2009). Impact of project funding on the implementation of LEEMP development projects: A situational study. International Journal of Development and Management Review, 4(1), 197–206. https://www.ajol.info/index.php/ijdmr/article/view/51027
- Etwire, P. M., Dogbe, W., Wiredu, A. N., Martey, E., Etwire, E., & Robert, K. (2013). Factors influencing farmer’s participation in agricultural projects the case of the agricultural value chain mentorship project in the Northern region of Ghana.
- Garande, T., & Dagg, S. (2005). Public participation and effective water governance at the local level: A case study from a small under-developed area in Chile. Environment, Development and Sustainability, 7(4), 417–431. https://doi.org/10.1007/s10668-004-3323-9
- Jamilu, A. A., Atala, T. K., Akpoko, J. G., & Sanni, S. A. (2015). Factors influencing smallholder farmers’ participation in IFAD-community based agricultural and rural development project in Katsina State. Journal of Agricultural Extension, 19(2), 93–105. https://doi.org/10.4314/jae.v19i2.8
- Kenya National Bureau of Statistics. (2019). Kenya population and housing census: Counting our people for sustainable development and devolution of services; KNBS: I. Available online: www.knbs.or.ke
- Kothari, C. R. (2004). Research Methodology: Methods and Techniques (2nd ed.). New Age International Publishers Ltd.
- Kumar, S. (2002). Does “participation” in common pool resource management help the poor? A social cost–benefit analysis of joint forest management in Jharkhand, India. World Development, 30(5), 763–782. https://doi.org/10.1016/S0305-750X(02)00004-9
- Martey, E., Wiredu, A. N., Etwire, P. M., Fosu, M., Buah, S. S. J., Bidzakin, J., Ahiabor, B. D. K., & Kusi, F. (2014). Fertilizer adoption and use intensity among smallholder farmers in Northern Ghana: A case study of the AGRA soil health project. Sustainable Agriculture Research, 3(1), 24. https://doi.org/10.5539/sar.v3n1p24
- MoALF. (2017). Climate Risk Profile for Kakamega County. Kenya county climate risk profile series. In The Ministry of Agriculture, Livestock and Fisheries (MoALF). Nairobi, Kenya. https://cgspace.cgiar.org/handle/10568/96289
- Nahayo, A., Omondi, M. O., ZHANG, X. H., LI, L. Q., PAN, G. X., & Joseph, S. (2017). Factors influencing farmers’ participation in crop intensification program in Rwanda. Journal of Integrative Agriculture, 16(6), 1406–1416. https://doi.org/10.1016/S2095-3119(16)61555-1
- Ngarava, S., Mushunje, A., & Chaminuka, P. (2021). Determinants of participation in livestock development programmes: Evidence from South Africa’s Kaonafatso ya Dikgomo (KyD) Scheme. African Journal of Science, Technology, Innovation & Development, 13(5), 635–647.
- Nxumalo, K. K. S., & Oladele, O. I. (2013). Factors affecting farmers’ participation in agricultural programme in Zululand district, Kwazulu Natal Province, South Africa. Journal of Social Sciences, 34(1), 83–88. https://doi.org/10.1080/09718923.2013.11893120
- Odah, M. H., Mohammed, B. K., & Bager, A. S. M. (2018). Tobit regression model to determine the dividend yield in Iraq. LUMEN Proceedings, Chisinau, Republic of Moldova, 3, 347–354. https://doi.org/10.18662/lumproc.nashs2017.30
- Okumu, B. O. (2018). An assessment of the impact of community participation on soil and water conservation projects in lower Nyakach division, Nyakach sub-county, Kenya ( Doctoral dissertation).
- Okumu, J. J., Sibiko, K. W., & Mose, P. B. (2021). Drivers of perceived sustainability of climate smart Agricultural projects in Kakamega County, Kenya. East African Agricultural and Forestry Journal, 85(3 & 4), 12–12.https://kalro.org/www.eaafj.or.ke/index.php/path/article/view/507
- Ouma, G. O. (2016). Factors influencing community participation in the implementation of agricultural projects: a case of Kimira-Oluch smallholder farm improvement project, Homa Bay county-Kenya. Doctoral dissertation, University of Nairobi.
- Rogers, E. (2003). Diffusion of innovation. The Free Press.
- Shiferaw, B. A., Okello, J., & Reddy, R. V. (2009). Adoption and adaptation of natural resource management innovations in smallholder agriculture: Reflections on key lessons and best practices. Environment, Development and Sustainability, 11(3), 601–619. https://doi.org/10.1007/s10668-007-9132-1
- Sithole, N. L., Lagat, J. K., & Masuku, M. B. (2014). Factors influencing farmers’ participation in smallholder irrigation schemes: The case of Ntfonjeni rural development area. Journal of Economics & Sustainable Development, 5(22), 157–167. https://core.ac.uk/download/pdf/234646649.pdf
- Symons, K. (2014). Anti-politics, apocalypse and adaptation in Kenya's national climate change response strategy. Scottish Geographical Journal, 130(4), 266–278. https://doi.org/10.1080/14702541.2014.907442
- Tefera, T., Tesfay, G., Elias, E., Diro, M. U. L. U. G. E. T. A., & Koomen, I. (2016). Drivers for adoption of agricultural technologies and practices in Ethiopia. A Study Report From, 30. https://www.researchgate.net/profile/Irene-Koomen/publication/335001228_Drivers_for_adoption_of_agricultural_technologies_and_practices_in_Ethiopia_A_Study_report_from_30_woredas_in_four_regions/links/5d498be8299bf1995b6a6eeb/Drivers-for-adoption-of-agricultural-technologies-and-practices-in-Ethiopia-A-Study-report-from-30-woredas-in-four-regions.pdf
- Tologbonse, E. B., Jibrin, M. M., Auta, S. J., & Damisa, M. A. (2013). Factors influencing women participation in women in agriculture (WIA) programme of Kaduna state agricultural development project, Nigeria. International Journal of Agricultural Economics and Extension, 1(7), 47–54. https://citeseerx.ist.psu.edu/document?repid=rep1&type=pdf&doi=bc6c843545fbd425289a1a63c8d61ae5cd4b7a57
- Udayakumara, E. P. N., Shrestha, R. P., Samarakoon, L., & Schmidt-Vogt, D. (2010). People’s perception and socioeconomic determinants of soil erosion: A case study of Samanalawewa watershed, Sri Lanka. International Journal of Sediment Research, 25(4), 323–339. https://doi.org/10.1016/S1001-6279(11)60001-2
- Waaswa, A., Oywaya Nkurumwa, A., Mwangi Kibe, A., & Ngeno Kipkemoi, J. (2022). Climate-Smart agriculture and potato production in Kenya: Review of the determinants of practice. Climate and Development, 14(1), 75–90. https://doi.org/10.1080/17565529.2021.1885336
- White, H. M. (2018). How big should the control group be in a randomized field experiment?
- Winters, M. S. (2010). Accountability, participation and foreign aid effectiveness. International Studies Review, 12(2), 218–243. https://doi.org/10.1111/j.1468-2486.2010.00929.x
- Wossink, A., & Boonsaeng, T. (2003). Farmers' Knowledge and Perceptions of Animal Waste Management Technologies: An Explorative Study for North Carolina. ARE Report. https://porkgateway.org/wp-content/uploads/2015/07/animal-waste-management-technologies-an-explorative-study-of-farmers-knowledge-and-perceptions1.pdf