
 ?Mathematical formulae have been encoded as MathML and are displayed in this HTML version using MathJax in order to improve their display. Uncheck the box to turn MathJax off. This feature requires Javascript. Click on a formula to zoom.
Abstract
The primary objective of this study was to evaluate the impact of conservation agriculture (CA) practice on farmers’ livelihood status and examine factors influencing the adoption of CA practice in Arba Minch Zuria district of Southern Ethiopia. The logistic regression model result revealed that gender, education level, credit access, access to extension service, household size, marital status, income, and cooperating group membership were crucial factors in influencing the likelihood of farmers adopting conservation agriculture practices. Moreover, the Propensity Score Matching (PSM) result indicated that the return from maize grain productivity and farmers’ annual income was comparatively higher in conservation agriculture practice than conventional agriculture practice. Thus, this study recommended promoting CA practice as a livelihood-enhancing technology in areas experiencing low yields and annual income.
1. Introduction
The Primary Development Goal of the Ethiopian Government is to achieve food security and sustain high economic and export growth levels to end poverty. Hence, the country’s development policies and strategies are geared towards this end. Foremost among them a major emphasis is given and exerted more effort on sustainable agriculture (EEA, Citation2018; FDRE, Citation2017).
In Ethiopia, agriculture is the dominant economic sector, it accounts for 35% of the country’s GDP; over 65% of employment, and over 70% of the country’s exports (World Bank, Citation2019). Despite its high contribution, land degradation in the form of soil erosion and declining soil quality is pose a serious challenge to agriculture (Abebaw, Citation2019). Undeniably, soil erosion is one of the biggest global environmental problems. However, due to a lack of capacity and courage to cope with it and also to replace lost nutrients in the soil, the economic implication of soil erosion is more serious in developing countries (Tamene & Vlek, Citation2008), especially in Sub-Sahara Africa.
Ethiopia loses more than 1.5 billion tons of topsoil per year, leading to a reduction of about 1.5 million tons of grain in the country’s annual harvest (Taddese, Citation2001). Similar studies in Ethiopia confirmed that land degradation undermines agricultural productivity primarily in the highlands, where 88% of the country’s population lives, and accounts for more than 43 percent of the country’s area, 95% of the cultivated land, and 75% of the livestock. The Ethiopian Highland Reclamation Study (EHRS) estimated that by the mid-1980s about 50% of the highlands (27 million hectares) was significantly eroded, while more than one-fourth was seriously eroded (EHRS, 1986, cited in Gebremedhin and Swinton, (Citation2003). Above and beyond, agriculture production in Ethiopia is characterized by intensive tillage (Temesgen et al., Citation2008) and low productivity due to soil degradation (Oicha et al., Citation2010). Moreover, the high dependence of Ethiopian agriculture on rainfall makes smallholders’ livelihoods highly vulnerable to climate variability (Deressa & Hassan, Citation2009).
Consequently, all the above characteristics of Ethiopian agriculture lead to a predominance of subsistence agriculture, low productivity and income, and uncertain availability of food commodities which affect the livelihoods of the poor. This calls for the transition towards sustainable agricultural production practices that help regenerate soil and land quality, and productivity (LaCanne & Lundgren, Citation2018). In response, Conservation Agriculture (CA) has been considered one of the possible sustainable agriculture trajectories.
Climate-smart innovations are receiving increasing attention in policy dialogues for their potential to transform agricultural systems and improve the well-being and resilience of farm households (Wondimagegn et al., Citation2020). Conservation Agriculture (CA), a climate-smart agricultural practice, is an approach to managing agroecosystems for improved and sustained productivity, increased profits, and food security while preserving and enhancing the resource base and the environment through sustainable land management, environmental protection, and climate change adaptation and mitigation. Conservation Agriculture builds on three principles: minimum/zero soil disturbance, permanent soil covers with crop residues, and crop diversification (FAO & O, Citation2016). Zero or minimum soil disturbance is aimed to minimize processes that contribute to soil degradation (Kassam et al., Citation2015). The permanent soil cover practice reduces soil surface sealing, crusting, and evaporative moisture loss and hence contributes to improved water infiltration, soil water use efficiency, and increased insurance against in-season dry spells (Abera et al., Citation2020). Finally, the diversification of crops through sequences (rotations) and associations plays an important role in atmospheric Nitrogen fixation and the transformation of unavailable nutrients into plant-available form (Dumanski et al., Citation2006).
The Conservation Agriculture System practices were introduced to Ethiopia in 1998 by Sasakawa Sasakawa Global 2000 (SG 2000) on maize production (Tsegaye et al., Citation2016) as a response & viable production system which can assist smallholder farmers to increase the sustainability and productivity of crop production practices and ultimately cope with food insecurity. Thus, the overall aims were reducing soil degradation, increasing crop yield, minimizing the risk of crop failure, and thereby increasing food security. Conservation agriculture practices, therefore, aim to improve the use of agricultural resources through the combined management of soil, water, and biological resources.
Despite the benefits of CA and the continued efforts, the adoption rate remains limited throughout the district. Globally, several socio-economic factors such as age, gender, marital status, off-farm income, training on CA, extension service, asset ownership, farm experience, education level, access to credit and inputs, and labor availability (Arslan et al., Citation2013; Kahimba et al., Citation2014; Mohamed et al., Citation2008; Mudiwa, Citation2011; Nkhoma et al., Citation2017; Nyanga, Citation2012; Oscar et al., Citation2019; Tsegaye et al., Citation2011) and biophysical characteristics such as soil fertility, soil erosion, rainfall pattern, temperature (Giller et al., Citation2009; Uddin et al., Citation2016) have been identified as primary constraint factors limiting the adoption of conservation agriculture.
Similarly, global literature is also well stocked with positive impacts of CA adoption on crop production, productivity, and efficiency (Arslan et al., Citation2013; Nkhoma et al., Citation2017; Peter et al., Citation2011; Siziba et al., Citation2019; Steward et al., Citation2018). Similarly, the positive impact of conservation agriculture on farmers’ income has been also described in much literature (Adebayo & Olagunju, Citation2015; Nguema et al., Citation2013; Nkhoma et al., Citation2017; Peter et al., Citation2011).
In Ethiopia, despite several conservation agriculture promotion endeavors have been done over the last decades, only a few studies have been conducted on conservation agriculture (such as Tsigie et al., Citation2011; Arya, Citation2016; Liben B et al., Citation2018; Tesfaye, Citation2018; Assefa et al., Citation2019; JB, Citation2020; Abera et al., Citation2020). However, none of these studies examine the major factors limiting the adoption of conservation agriculture and demonstrate the alleged livelihood benefits of conservation agriculture for smallholder farmers. Furthermore, to the best of the researcher’s knowledge, no empirical evidence has been presented on the specified objectives of this research in southern Ethiopia since all of the studies are conducted in the northern and western parts of Ethiopia. Therefore, the very objectives of this study were to examine factors influencing the adoption of conservation agriculture practices and evaluate the impact of conservation agriculture on smallholder farmers’ livelihoods in Arba Minch Zuria District of Southern Ethiopia.
2. Materials and methods
2.1. Description of the study area
The five study kebeles (the smallest administrative unit) discussed in this study are located in the vulnerable agricultural production regions in the highland part of Arba Minch Zuria district of southern Ethiopia where livelihood options of farmers are mainly limited to agriculture, vegetable vending, enset production, Bamboo fence and weaving in a few cases.
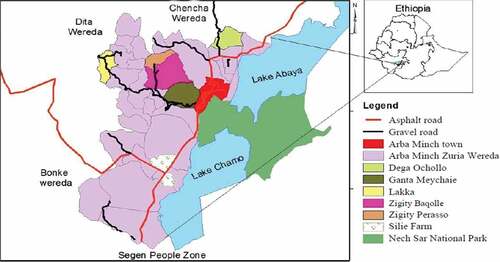
“Catholic Church Conservation Agriculture (CA) project” embarked on five kebeles of Arba Minch Zuria district of Southern Ethiopia in 2017; namely, Zigity Perasso, Lakka, Zigity Baqolle, Ganta Meychaie & Dega Ochollo by Spiritan Community OutReach Ethiopia (SCORE) (Please see Figure below). The project had three cycles; one cycle per year for each kebeles since 2017. Until the third-year implementation (2019), the total number of direct beneficiaries was 1300 farmers.
Figure 1. The five target kebeles (Zigity Perasso, Lakka, Zigity Baqolle, Ganta Meychaie & Dega Ochollo) of the CA project in Arba Minch Zuria district of southern Ethiopia..
2.2. Data type & source, and method of data collection
To achieve the above-stated objectives, in this study, both the primary and secondary data were employed depending on the nature and availability of data. Primary data was collected on farmers’ CA adoption practices, different socio-economic attributes of the farmers, their farms, and institutional factors of selected farmers of the study area through a survey questionnaire. In addition to the primary data, the researcher also used secondary data on the socio-economic conditions of the study area and other issues related to farmers’ adoption of conservation agriculture from the catholic church CA project documents and other relevant offices.
2.3. Sampling procedure
The total number of CA farmers considered as a target population was 400 (80 CA farmers × 5 kebeles)—only the 2017 & 2018 CA farmers/adopters of the catholic church CA project. This is because the literature recommended that targeted CA farmers should go through at least two cycles of CA practice, hence, they had a relatively good understanding of its impact, and the impact of CA can also be better seen in the long run. Accordingly, the sample size is determined by the formula designed by Taro (Citation1967) at a 10% level of precision.
Where, sample size,
Target population (CA farmers), and
level of precision (10%).
Based on the above formula, 80 sample CA farmers were the minimum sample size required for the study. However, the researcher randomly sampled 150 CA farms to increase the representativeness of the samples from the five kebeles. And the distribution was equal (30 CA farmers in each kebeles). For the use of the propensity scores matching (PSM) technique, 100 non-CA farmers (non-adopters) were randomly selected from the remaining farmers in each kebeles as a control group; and this distribution was also equal (20 CA farmers in each kebeles). Therefore, individual farmer questionnaire surveys were conducted on 250 smallholder farmers across the five kebeles.
2.4. The empirical model and estimation strategy
In this study, to examine the determinants of adopting conservation agriculture practice the logistic regression model was employed, and for evaluating the impact of adopting conservation agriculture practices on farmers’ livelihood the Propensity Score Matching (PSM) method was used. The primary livelihood outcomes of interest were reported changes in maize grain productivity and annual income. So, the logistic regression model and the propensity score matching (PSM) method are specified as follows.
2.4.1. Logistic regression model specification
A logistic regression model was used to analyze the extent of influence of the determinants on the decision-making status of adopting conservation agriculture practice. The binary logistic regression model used in this study was based on the decision of a farmer whether to adopt a CA practice or not using the latent variable approach, where the farmer will adopt conservation agriculture as a result of various factors influencing the decision of conservation agriculture practice. Various factors influencing adoption were incorporated into this model.
Following Gujarati (Citation2004), the probability that the ith farmer is adopting conservation agriculture is given by:
For simplicity assume , so the probability that a given farmer is adopting conservation agriculture can be expressed as:
The probability of not adopting conservation agriculture is
Then, take the ratio of the probability of adopting CA () to the probability of not adopting CA (
) and the resulting ratio is called the odds ratio. Thus,
Take the natural log of the above odds ratio and the resulting equation is called Logit. Thus,
Where Pi is a probability of adopting conservation agriculture ranges from 0 to 1, is a function of
explanatory variables (
) which is also expressed as:
Where is an intercept,
,
.
are the slopes of the equation,
is log of the odds ratio, which is not only linear in
but also linear in the parameters,
is a vector of the relevant independent variable.
If the disturbance term () is introduced, the logit model becomes:
Consequently, the estimable logit model is
= gender of the respondent (0 = female, 1 = male);
= age of the respondent (years);
= years of formal education (years of schooling);
= total farm size (ha);
= farm experience (years);
= access to credit (1 = Yes received, 0 = otherwise);
= extension contact (1= having extension contact, 0 = otherwise);
= distance to the nearest market (minute on foot);
= off-farm participation (1=participated, 0= not participated);
= household size (no.);
= marital status of the respondent (1=married, 0=otherwise);
= livestock ownership (1= owning livestock, 0 = otherwise);
= logarithm of annual income (Birr); and
=cooperating group membership (1=Member, 0 = otherwise).
2.4.2. Propensity score matching (PSM) model specification
The propensity score matching (PSM) method explores how changes precipitated by CA subsequently impact changes in farmers’ livelihoods. Primary livelihood outcomes of interest are reported changes in maize grain yield and farmers’ annual income. Each of these outcomes are continuous; the maize yields (kgha−1) were measured as the total grain harvested (kg) from a plot divided by the plot size (ha); whereas annual income was measured in Ethiopian money, that is Birr.
The propensity score matching (PSM) is a semi-parametric method that gives an average treatment effect on the treated (ATT), which is considered a better indicator of whether to continue promoting projects that target specific groups of interest like poor farmers than population-wide average treatment effects given by Logit models (Rosenbaum, Citation2002; Rosenbaum & Rubin, Citation1983). CA was the treatment variable, while reported improvements in crop productivity (i.e. maize yield), and farmers’ annual income were the outcomes of interest, and non-CA farmers were the control group.
PSM is based on the assumption that each farmer can’t be both in the CA as well as non-CA groups. This then necessitates the creation of a counterfactual of what can be observed by matching CA (treatment) and non-CA (control) groups. To investigate the impact of CA on farmers’ livelihoods, the researcher develops the following model.
Where, (household ith livelihood outcomes) is the dependent variable,
is participation in CA or treatment, and
is a vector of observed explanatory variables of farmers’ livelihood outcomes.
Recall that there are two groups of farmers distinguished by participation in CA or treatment status, where
denotes a farmer participating in CA or treatment group whereas
denotes a farmer that is a non-CA or control group. Moreover, let us denote
be the livelihood outcome conditional on practicing CA (
) and
be the livelihood outcome conditional on non-practicing CA (
).
Having this, our parameter of interest is to estimate the average treatment effect on the treated (ATT) which can be obtained by comparing the average treatment effect between the CA farmers and non-CA farmers. However, the difference between the average treatment effect of the CA farmers and non-CA farmers cannot be observed for the same farm household at a given point in time because a farm household cannot have two simultaneous existences—a farm household cannot be in the treated and control groups at the same time.
To handle this problem, Rosenbaum and Rubin (Citation1983) suggested propensity score matching which is defined as the probability of practicing in CA given a set of observed characteristics. This can be expressed as follows:
Where denotes propensity score and
is the probability of being in the CA group given observed covariates.
Once the propensity score, is known, the PSM estimator of the average effect of treatment on the treated (ATT) is the average difference in livelihood outcomes between CA farmers/treatment and non-CA farmers/control groups appropriately matched by the propensity score which can be defined as:
ATT is defined only in the region of common support or overlap in the propensity score distribution between the treatment group and comparison group (Caliendo & Kopeinig, Citation2005). Furthermore, the PSM estimator of ATT will be a good estimator when, given the propensity scores, the conditional independence or un-confoundednessFootnote1 assumption, and Common SupportFootnote2 assumptions are satisfied. That is, once these assumptions are satisfied, the mean of the potential outcome is the same after adjusting for observable differences (Rosenbaum & Rubin, Citation1983).
The propensity scores can be derived from a logit model, where being in the CA group serves as an endogenous variable. Consequently, the practicing CA model given observed characteristics is identified as:
Where denotes the normal cumulative distribution function,
is a function of all observed covariates with linear and higher-order terms.Footnote3
The variables that are included in of the above participation model were selected based on variable inclusion and exclusion advice for the PSM model given by Caliendo and Kopeinig (Citation2005) based on the un-confoundedness assumption which the matching strategy builds upon. Using this participation model, the researcher estimated the probability of being in the CA group or propensity score. Hence, every sampled CA farmers and non-CA farmers have an estimated propensity score, which is a continuous variable and can be expressed as:
The estimated propensity scores or predicted values were taken to construct the comparison groups. That is, CA farmers were matched based on this propensity score to non-CA farmers. To do so, the study used the four most widely used ATT estimation algorithms; namely, Nearest Neighbor Matching (NNM), Radius Matching (RM), Kernel Matching (KM), and Stratification Matching (SM) algorithms. The average treatment effect (ATT) of CA farmers is then calculated as the mean difference in outcomes across the two groups (i.e., CA farmers and non-CA farmers).
Finally, to check whether the results are sensitive to the effect of unobserved variables the researcher used the “Stimulation-based sensitivity analysis” for matching estimators proposed by Ichino et al. (Citation2007) to investigate how strong the effect of unobservable covariates has to be to reverse inferences drawn about the effects of conservation agriculture practice.
3. Results and discussions
3.1. Determinants of farmers’ adoption of conservation agriculture practice
Different socio-economic, institutional, and environmental factors affect farmers’ abilities to adopt conservation agriculture. Therefore, the binary logit model is used to analyze what determines a farmer’s likelihood of adopting conservation agriculture practices.
It is always mandatory to conduct diagnostic tests before accepting and interpreting the logistic regression results. The result passed all the necessary diagnostic tests except the Breusch-Pagan test which shows that there is a small problem of heteroskedasticity. To solve the problem of heteroskedasticity, the researcher estimated a robust model that computes a robust variance estimator based on a variable list of the equation. The multicollinearity test result shows that the mean VIF is 1.87 which is less than 10. This implies there is no multicollinearity problem in the model. Finally, the Link test result also showed that the probability value of the hat square is 0.588 which is statistically insignificant. Therefore, the model has no error in its mathematical formula and no omission of significant variable
As shown in Table below, in the marginal effect result, the likelihood of male respondents adopting conservation agriculture was lesser than that of female respondents. This can be explained by the fact that women conduct the majority of farm activities in Arba Minch Zuria district since the adoption of conservation agriculture is a lower labor demand technology. This result is consistent with the results of Mudiwa (Citation2011), Arslan et al. (Citation2013), and Oscar et al. (Citation2019). Similarly, the marginal effect result also established that more educated farmers were more likely to adopt conservation agriculture than farmers with not as many years of education. The possible justification for this finding was that higher education was likely to expose farmers to more information on conservation agriculture and to enhance information access to the farmer for improved technology uptake. This result is also validated by the results reported by Mudiwa (Citation2011) and Oscar et al. (Citation2019). Similarly, the odds ratio result also confirms that male-headed farming households are about 0.417 times more likely to adopt conservation agriculture as compared to female-headed households. This implies that the odds of the male’s probability to adopt conservation agriculture is lower than the probability of not adopting—that is why it is less than one. And The odds ratio for the years of education of the household head is 1.22, implying that as the education level of the farm household head increases, the odds of adopting conservation agriculture increases.
Table 1. Binary logit estimation for conservation agriculture (n = 250)
Noticeably, both the odds ratio and marginal effect results affirmed that farmers with access to credit are more likely to adopt conservation agriculture than farmers without access to credit. The marginal effect shows that farmers with credit have a 34% of likelihood to adopt conservation agriculture, and the odds-ratio implies that the likelihood of adopting conservation agriculture among household heads who have credit access is about 48.28 times higher than household heads who have not. This is because credit by its nature relaxes the financial constraint of farmers and increases farmers’ ability to meet transaction costs associated with CA adoption options they might want to take (Nhemachena & Hassan, Citation2008). Empirical studies which are conducted by Mohamed et al. (Citation2008) and Nyanga (Citation2012) also found a similar result. Moreover, advice in CA tends to increase the probability to adopt the technology for farmers who had access to extension services as compared to those who did not. This is because extension services make farmers aware of the importance of CA and its implementation as well as the benefits associated with the technology. This result of odds ratio and marginal effect is consistent with the findings of Tsegaye et al. (Citation2011) and Nkhoma et al. (Citation2017) who emphasize that access to agricultural extension services enhances the efficiency of making adoption decisions.
As shown in the logit result of odds-ratio and marginal effect, the coefficient of active family labor was positive and significant at a 5 percent probability level. The reason can be that in Ethiopia smallholder farmers rely on family labor for crop production and the agriculture sector is labor-intensive in general. Ngombe et al. (Citation2014), and Oscar et al. (Citation2019) argued that farmers with a larger number of active family labor members are typically better at conservation agriculture practices since they are more likely to have a surplus of labor that is required to do conservation activities.
Concerning marital status, the study revealed that marriage reduces farmers’ likelihood of adopting conservation agriculture practices. The possible reason could be that married farmers are more likely to be under pressure for family consumption expenditure. For this reason, they may face financial constraints to adopt new technologies that require initial capital or input investments. In addition to this, they may not find sufficient time to practice conservation agriculture since they may spend additional time taking care of their family. This observation is similar to the finding of Omonona et al. (Citation2005).
As to the level of income, the study found that farmers with high income were more likely to adopt conservation agriculture practices compared to farmers with lower income; this is because farmers with higher income can buy inputs for farming and hence can engage in conservation agriculture practice. Kahimba et al. (Citation2014) also made the same observation that higher incomes are associated with higher levels of adoption rates. Finally, the study also established a positive association between conservation agriculture adoption and farmers’ membership in different cooperating groups. This implies the fact that farmers´ participation in agricultural associations or cooperating groups enhances their interaction and enables them to gain knowledge of proper conservation agriculture practices. This result is consistent with the finding of Nyanga (Citation2012). The odds-ratio result also avowed that the likelihood of adopting conservation agriculture among household heads who participate in agricultural cooperatives is about 48.28 times higher than among non-member household heads.
3.2. The impact of conservation agriculture practice on farmers’ livelihood outcomes
In this study, a propensity score matching (PSM) model was used to estimate the average impact of conservation agriculture practices on farmers’ maize productivity and annual income. The Average Treatment Effect on the Treated (ATT) gives the mean difference between the observed maize yield and incomes among the adopters and non-adopters of conservation agriculture practice. The analysis was based on estimated propensity scores from the logit regression results and generated samples of matched CA and non-CA farmer groups using the different ATT estimation algorithms; Radius Matching (RM), Kernel Matching (KM), Stratification Matching (SM), and the Nearest Neighbor Matching (NNM) algorithms.
3.2.1. The impact of conservation agriculture on maize yield
To find out whether conservation agriculture practice intervention by SCORE is improving farmers’ crop productivity in the study area, the researcher estimates the maize yield impact of conservation agriculture using the Propensity Score Matching (PSM) technique. From the total sample size (250 farmers), the total number of maize grains producing farmers was 178. Of this, 57 of them were farmers who didn’t adopt conservation agriculture and the remaining 121 farmers were conservation agriculture adopters. Thus, the average treatment effect on the treated (ATT) which measures the impact of conservation agriculture on the maize yields of 178 maize-producing farmers was estimated using the four ATT estimation methods. As shown in Table below, ATT results denote that conservation agriculture had a positive and significant impact on maize yield.
Table 2. ATT estimated impact of conservation agriculture on Maize Yield (in Kg/ha)
As can be seen from Table , the results of the four matching algorithms show a significant difference in levels of maize yields between conservation agriculture adopters and non-adopters. The ATT results of the matching algorithms indicate that the average maize yields of matched CA farmers were 168.376 kg per hectare up to 250.306 kg per hectare higher than matched non-CA farmers. The difference is therefore attributable to the treatment variable which is conservation agriculture practice. This result can be substantiated by the empirical findings of Peter et al. (Citation2011), Arslan et al. (Citation2013), Nkhoma, S. (Citation2017), Steward et al. (Citation2018), and Siziba, S. (2019) who revealed that the positive impact of conservation agriculture on crop/maize yields. Moreover, the similar results generated by the different algorithms indicate the robustness and sensitivity of the estimated results of the ATT.
The final step of the PSM analysis is testing the robustness of the estimated results to possible failures of the conditional independence assumption (CIA) since the propensity score-matching method uses observable covariates to eliminate bias.
Hence, as it can be shown in Table , it can be concluded that the results of the analysis support the robustness of the matching estimates. This implies that the observed results on the impact of conservation agriculture on maize yield were not biased toward those who adopt conservation agriculture.
Table 3. Simulation-based sensitivity analysis results
3.2.2. The impact of conservation agriculture on farmers’ annual income
Here, the ATT was estimated to assess the impact of Conservation Agriculture on farmers’ annual income. The ATT gives the mean difference between the observed farmers’ annual incomes among the adopters and non-adopters of conservation agriculture.
On the PSM estimated results of matching algorithms reported in Table , all the matching estimators yield similar results, and it shows that conservation agriculture practice has a positive and statistically significant impact on smallholder farmers’ annual income. The average annual income of matched CA farmers was 6333.086 Birr up to 9913.316 Birr higher than matched non-CA farmers.
Table 4. ATT estimated impact of conservation agriculture on income (in Birr)
The results are consistent with the findings of Nkala et al. (2011), Nguema et al. (Citation2013), Adebayo and Olagunju (Citation2015), and Nkhoma, S. (Citation2017) who acknowledged a significant economic benefit in terms of income and wealth generation from a variety of conservation agriculture practices. The possible reason could be due to the fact farmers earned a notable amount of money by selling the additional production under conservation agriculture practice at high prices. In addition to this, the labor input in the conservation agriculture system could be reduced by 75% (IFAD and FAO, Citation2004). The time saved under conservation agriculture allows farmers to dedicate more time to other more profitable non-farm occupations for generating income than growing a crop. More time availability offers real opportunities for diversification options for farmers.
Finally, simulation-based sensitivity analysis was implemented for PSM estimates to evaluate the stability and robustness of the ATT results concerning possible failures of the CIA as proposed by Ichino et al. (Citation2007).
As reported in Table , the results of simulation—based sensitivity analysis show that the estimated treatment effects were insensitive to hidden bias. Put differently, the results are insensitive to possible deviations from the conditional independence assumption (CIA) of the PSM method. Therefore, the ATT estimates for farmers’ annual incomes are robust indicators of the impact of conservation agriculture practices.
Table 5. Simulation-based sensitivity analysis results
4. Conclusions and policy implications
Recall that the two main objectives of this study were examining the factors that influence the adoption of conservation agriculture practice and evaluating the impact of conservation agriculture on farmers’ livelihood outcomes: maize yield and annual income in Arba Minch Zuria district of southern Ethiopia.
The logistic regression model revealed that the farmers’ gender, education level, credit access, access to extension service, household size, marital status, annual income, and cooperating group membership were crucial factors in influencing the likelihood of farmers adopting conservation agriculture practice in Arba Minch Zuria district. Moreover, the Propensity Score Matching method was employed to estimate the impact of CA on farmers’ livelihoods, using maize grain productivity and annual income as indicators. The results show conservation agriculture is positively correlated with farmers’ livelihood status, which means higher maize yield and annual income. Generally, the study indicates that the return from agricultural productivity and farmers’ annual income was comparatively higher in conservation agriculture practice than in conventional agriculture practice. Therefore, the study concludes that conservation agriculture as a new resource-saving and efficient farming practice should be appreciated and successfully adopted by the farmers.
Even though governmental and non-governmental organizations’ efforts gradually increase farmers’ conservation agriculture adoption capacity, more needs to be done to protect the already weakened agricultural sector of Ethiopia. Therefore, considering the findings of the study, some essential policy recommendations have been drawn:
It was discovered in the study that extension services have a significant positive effect on the adoption of CA. It has important policy implications in that extension service provision should be scaled up by strengthening partnerships and collaboration between local agriculture offices and other institutions, to create synergies and offer opportunities to further enhance the adoption of conservation agriculture.
The PSM results show that conservation agriculture makes a positive difference in crop productivity and income, which usually comprise the poor in rural communities. However, this comes at an increased and extensive labor usage (especially the mulching practice) at the starting phase of the CA adoption. The study calls for measures to reduce labor usage and the tediousness of the practice, for example through affordable mechanization for smallholder farmers—like a cart for leaf transportation used for mulching purposes.
Even though the study discovered access to credit is an important determinant to enhance the adoption of conservation agriculture technology, the study also found that 77.20 percent (193 farmers) of maize-producing farmers are shy to take credit because they fear that credit institutions may sell their livestock/assets by auction if they fail to pay the principal and the interest rate. This shows agricultural credit policies are still business oriented rather than directed toward development. So, it is imperative on the part of such institutions to chalk out policies and programs by the government aimed at larger national interests rather than individual and personal gains. Moreover, since improving financing options for low-income farmers is a useful approach to support CA adoption, micro-credit should come in a package including input supply (seed, fertilizer, pesticides etc.), technical know-how, and marketing. This would increase the income of the borrowers and hence repayment conditions will be improved.
In a broader sense, the results underscore the role of conservation agriculture in improving the livelihoods of smallholder farmers through increased crop yields and income. These results further justify the need to promote Conservation Agriculture Practice rate as a livelihood-enhancing technology in areas experiencing low yields and annual income in the Arba Minch Zuria district and Southern Ethiopia at large.
Acknowledgments
I would like to extend my deepest gratitude to the Ethiopian Catholic Church – Social and Development Commission – Spiritan, Community OutReach Ethiopia, partners, and the funding organizations of the project for covering all the necessary costs of this study and there of activities in which this study is one of their fruits.
Disclosure statement
No potential conflict of interest was reported by the author(s).
Additional information
Funding
Notes on contributors
Teklebirhan Alemnew Gebeyehu
Teklebirhan Alemnew Gebeyehu is an Assistant Professor of Economics at the Department of Economics, College of Business and Economics, Arba Minch University, Ethiopia. His interest and study are in Agricultural economics, Poverty & Inequality, Fiscal & monetary policy, Economic growth, climate change, impact evaluation, etc, which he has been carrying out for the last few years. Teklebirhan was the Research Coordinator of the Business and Economics College at the University of Arba Minch, Ethiopia.
Notes
1. I.e., - which implies that treatment assignment is entirely based on observed characteristics.
2. Implies that there should be overlap in the distribution of propensity scores of treatment and control groups, i.e., - which ensures that treatment observations have comparison observations “nearby” in the propensity score distribution.
3. The choice of which higher order terms to include is determined by the need to obtain an estimate of the propensity score that satisfies the balancing property (Becker & Ichino, Citation2002).
References
- Abebaw, W. A. (2019). Review on impacts of land degradation on agricultural production in Ethiopia. Journal of Resources Development and Management, 57(2003), 21–15. https://doi.org/10.7176/jrdm/57-03
- Abera, D., Beshir, B., & Liben, F. M. (2020). The role of conservation agriculture for soil quality improvement: A review conventional agriculture through intensive tillage and high input based production. Ethiopian Journal of Agriculture Science, 30(4), 197–222.
- Adebayo, O., & Olagunju, K., 2015. Impact of agricultural innovation on improved livelihood and productivity outcomes among smallholder farmers in rural Nigeria. http://web2.msm.nl/RePEc/msm/wpaper/MSM-WP2015-07.pdf
- Arslan, A., McCarthy, N., Lipper, L., Asfaw, S., & Cattaneo, A. (2013). Adoption and intensity of adoption of conservation farming practices in Zambia. Agricultural Ecosystems & Environment, 187, 72–86. https://doi.org/10.1016/j.agee.2013.08.017
- Arya, T., 2016. Improving productivity, resilience and sustainability through conservation agriculture-based systems in the Ethiopian highlands. ECHO East Africa highlands symposium, Addis Ababa, Ethiopia.
- Assefa, T., Jha, M., Worqlul, A. W., Reyes, M., & Tilahun, S. (2019). Scaling-Up conservation agriculture production system with drip irrigation by integrating MCE Technique and the APEX model. Journal of Water, 11(10), 2007. https://doi.org/10.3390/w11102007
- Becker, S., & Ichino, A. (2002). Estimation of average treatment effects based on propensity scores. The Stata Journal, 2(4), 358–377. https://doi.org/10.1177/1536867X0200200403
- Caliendo, M., & Kopeinig, S. (2005). Some practical guidance for the implementation of propensity score matching. Journal of Economic Surveys, 22(1), 31–72. https://doi.org/10.1111/j.1467-6419.2007.00527.x
- Deressa, T. T., & Hassan, R. M. (2009). Economic impact of climate change on crop production in Ethiopia: Evidence from cross-section measures. Journal of African Economies, 18(4), 529–554. https://doi.org/10.1093/jae/ejp002
- Dumanski, J., Peiretti, R., Benites, J., McGarry, D., & Pieri, C. (2006). The paradigm of conservation agriculture. Proceedings of World Association of Soil and Water Conservation Paper, Beijing, PR China (pp. 58–64).
- EEA. (2018). Foreign direct investment in Ethiopia: Structure, performance, and determinants. Ethiopian Economics Association (EEA). https://eea-et.org/wp-content/uploads/2021/01/Annual-Economic-Report-2018.pdf
- FAO. (2016). Conservation agriculture. Conservation Agriculture. http://www.fao.org/3/i6169e/i6169e.pdf
- FDRE(2017). The 2017 Voluntary National Reviews on SDGs of Ethiopia: Government Commitments, National Ownership and Performance Trends. National Planning Commission. https://planipolis.iiep.unesco.org/en/2017/2017-voluntary-national-reviews-sdgs-ethiopia-government-commitments-national-ownership-and
- Gebremedhin, B., & Swinton, S. M. (2003). Investment in soil conservation in northern Ethiopia: The role of land tenure security and public programs. Agricultural Economics, 29(1), 69–84. https://doi.org/10.1111/j.1574-0862.2003.tb00148.x
- Giller, K. E., Witter, E., Corbeels, M., & Titonell, P. (2009). Conservation agriculture and smallholder farming in Africa: The heretics’ view. Field Crops Research, 114(1), 23–34. https://doi.org/10.1016/j.fcr.2009.06.017
- Gujarati, D. N. (2004). Basic Econometrics. (4th ed.). McGraw-Hill Book Company.
- Ichino, A., Mealli, F., & Nannicini, T. (2007). From temporary help jobs to permanent employment: What can we learn from matching estimators and their sensitivity? Journal of Applied Econometrics. forthcoming.
- IFAD and FAO. (2004). Conservation agriculture as a labour-saving practice for vulnerable households: A study of the suitability of reduced tillage and cover crops for households under labour stress in Babati and Karatu Districts.
- JB, A. (2020). The prospects for conservation agriculture in ethiopia. In B. Singh, A. Safalaoh N. Amuri, L. Eik, B. Sitaula, R. Lal (Eds.), Climate Impacts on Agricultural and Natural Resource Sustainability in Africa. Springer. https://doi.org/10.1007/978-3-030-37537-9_2
- Kahimba, F. C., Mutabazi, K. D., Tumbo, S. D., Masuki, K. F., & Mbungu, W. B. (2014). Adoption and scaling-up of conservation agriculture in Tanzania: Case of Arusha and Dodoma Regions. Natural Resources, 5(4), 161–176. https://doi.org/10.4236/nr.2014.54016
- Kassam, A., Friedrich, T., Derpsch, R., & Kienzle, J. (2015). Overview of the worldwide spread of conservation agriculture. Field Actions Science Reports, 8. https://doi.org/10.1201/9781315365800-12
- LaCanne, C. E., & Lundgren, J. G. (2018). Regenerative agriculture: Merging farming and natural resource conservation profitably. PeerJ, 2018(2), 1–12. https://doi.org/10.7717/peerj.4428
- Liben B, F. M., Tadesse, Y. T., Tola, C. S., Wortmann, H. K., Mupangwa, K. W., & Mupangwa, W. (2018). Conservation agriculture effects on crop productivity and soil properties in Ethiopia. Agronomy Journal, 110(2), 758–767. https://doi.org/10.2134/agronj2017.07.0384
- Mohamed, K. S., & Temu A. E. (2008). Access to credit and its effect on the adoption of agricultural technologies: The case of Zanzibar. African Review of Money Finance and Banking, 45–89.
- Mudiwa, B. (2011). A logit estimation of factors determining adoption of conservation farming by smallholder farmers in the semi-arid areas of Zimbabwe. Department of Agricultural Economics and Extension, University of Zimbabwe, Zimbabwe
- Ngombe, J., Kalinda, T., Tembo, G., & Kuntashula, E. (2014). Econometric Analysis of the Factors that Affect Adoption of Conservation Farming Practices by Smallholder Farmers in Zambia. JSD, 7(4). https://doi.org/10.5539/jsd.v7n4p124
- Nguema, A., W, N. G., Alwang, J., Taylor, D. B., Barrera, V., & Bertelsen, M. (2013). Farm-level economic impacts of conservation agriculture in Ecuador. Experimental Agriculture, 49(1), 134–147. https://doi.org/10.1017/S0014479712001044
- Nhemachena, C., & Hassan, R. (2008 1). Determinants of African farmers’ strategies for adapting to climate change: Multinomial choice analysis. African Journal of Agricultural and Resource Economics, 2(1), 83–104.
- Nkhoma, S., Kalinda, T., & Kuntashula, E. (2017). Adoption and impact of conservation agriculture on smallholder farmers’ crop productivity and income in Luapula Province, Zambia. The Journal of Agricultural Science, 9(9). https://doi.org/10.5539/jas.v9n9p168
- Nyanga, P. (2012). Factors influencing adoption and area under conservation agriculture: A case mixed method approach. Sustainable Agriculture Research, 1(2), 27. https://doi.org/10.5539/sar.v1n2p27
- Oicha, T., Cornelis, W. M., Verplancke, H., Nyssen, J., Govaerts, B., Behailu, M., Haile, M., & Deckers, J. (2010). Short-term effects of conservation agriculture on Vertisols under tef (Eragrostis tef (Zucc.) Trotter) in the northern Ethiopian highlands. Soil and Tillage Research, 106(2), 294–302. https://doi.org/10.1016/j.still.2009.12.004
- Omonona, B., Oni, O. A., & Uwagboe, O. A. (2005). Adoption of improved cassava varieties and its impact on rural farming households in Edo State, Nigeria. Journal of Agriculture and Food Information, 7(1), 39–55. https://doi.org/10.1300/J108v07n01_05
- Oscar, C., Pelser, A., van Tol, J., du Preez, C., & Ceronio, G. (2019). Factors influencing the adoption of conservation agriculture practices among smallholder farmers in Mozambique. International Journal of Agricultural Extension, 7(3), 277–291. https://doi.org/10.33687/ijae.007.03.3049
- Peter, N., Mango, N., & Zikhali, P. (2011). Conservation agriculture and livelihoods of smallholder farmers in central Mozambique. Journal of Sustainable Agriculture, 35(7), 757–779. https://doi.org/10.1080/10440046.2011.606492
- Rosenbaum, P. R. (2002). Observational studies. Springer New York. https://doi.org/10.1007/978-1-4757-3692-2
- Rosenbaum, P. R., & Rubin, D. B. (1983). The central role of the propensity score in observational studies for causal effects. Bometrika, 70(1), 41–55. https://doi.org/10.1093/biomet/70.1.41
- Siziba, S., Nyikahadzoi, K., Makate, C., & Mango, N. (2019). Impact of conservation agriculture on maize yield and food security: Evidence from smallholder farmers in Zimbabwe. African Journal of Agricultural and Resource Economics, 14(2), 89–105.
- Steward, P. R., Dougill, A. J., Thierfelder, C., Pittelkow, C. M., Stringer, L. C., Kudzala, M., & Shackelford, G. E. (2018). The adaptive capacity of maize-based conservation agriculture systems to climate stress in tropical and subtropical environments: A meta-regression of yields. Agriculture, Ecosystems &environment, 251, 194–202. https://doi.org/10.1016/j.agee.2017.09.019
- Taddese, G. (2001). Land degradation: A challenge to Ethiopia. Environmental Management, 27(6), 815–824. https://doi.org/10.1007/s002670010190
- Tamene, L., & Vlek, P. L. G. (2008). Soil erosion studies in Northern Ethiopia. Land Use and Soil Resources, 73–100. https://doi.org/10.1007/978-1-4020-6778-5_5
- Taro, Y. (1967). Statistics an introductory analysis (2nd ed.). Harper and Row.
- Temesgen, M., Rockstrom, J., Savenije, H. H. G., Hoogmoed, W. B., & Alemu, D. (2008). Determinants of tillage frequency among smallholder farmers in two semi-arid areas in Ethiopia. Physics and Chemistry of the Earth, 33(1–2), 183–191. https://doi.org/10.1016/j.pce.2007.04.012
- Tesfaye, K. (2018). Scaling conservation agriculture-based sustainable intensification systems in Ethiopia. International Maize and Wheat Improvement Center (CIMMYT). National CA Launching Workshop.
- Tsegaye, W., Dejenene, A., Rovere, R. L., Mwangi, W., Kassie, T. G., & Mwabu, G. (2011). Adoption of conservation agriculture and its impact on land and labour productivity in Central Ethiopia.
- Tsegaye, W., Larovere, R., & Mwabu, G. (2016). Adoption and farm-level impact of conservation agriculture in Central Ethiopia. Environment, Development and Sustainability, 19(6), 2517–2533. https://doi.org/10.1007/s10668-016-9869-5
- Tsigie, A., Agegnehu, G., & Tesfaye, A., 2011. Crop residues as animal feed conservation agriculture central highlands of Ethiopia. Ethiopian institute of agricultural research, Research Report 95.
- Uddin, Dhar, Uddin, M. T., & Dhar, A. R. (2016). Conservation agriculture practice and its impact on farmer’s livelihood status in Bangladesh. SAARC Journal of Agriculture, 14(1), 119–140. https://doi.org/10.3329/sja.v14i1.29582
- Wondimagegn, T., Garrick, B., & Tirivayi, N. (2020). Climate-smart innovations and rural poverty in Ethiopia: Exploring impacts and pathways. American Journal of Agricultural Economics, 103(3), 878–899. https://doi.org/10.1111/ajae.12161
- World Bank. (2019). Ethiopia economic update 7: Special topic-poverty and household welfare in ethiopia, 2011-16.