
 ?Mathematical formulae have been encoded as MathML and are displayed in this HTML version using MathJax in order to improve their display. Uncheck the box to turn MathJax off. This feature requires Javascript. Click on a formula to zoom.
Abstract
This study makes effort in considering the static structural models with the endogenous bankruptcy boundary in order to maximize the firm’s value. This research starts with highly recognized theoretical frameworks on the capital structure including Modigliani and Miller Theory’s contribution, trade-off theory, agency theory, pecking order theory and equity market timing theory. This paper investigates the experiential implementation of Black-Scholes (1973), Merton (1974), Leland (1994), and Leland and Toft (1996) models on capital structure in accordance with various assumptions. Moreover, this research is based mainly on static structural models to go into depth to determine the optimal debt level of the finance and consumer discretionary industries. From secondary information on stock volatility and drift, this study determines the adjustments in capital structure as well as the changes in the probability of default of 50 listed Vietnamese firms in the last three years from 2018 to 2020. The results indicate that the target capital structure changes proportionally to the tax percentage due to tax benefits (deductible interest payments) and varies inversely to the cost of debt (default and financial distress costs). In addition, instead of static structural models, firms can apply the theories on the debt level to determine the optimal leverage based on the complication of capital structure.
Public Interest Statement
Achieving an optimal capital structure counts as a fundamental decision for any firms. However, there are few papers which go into depth to determine the optimal debt level of finance and consumer discretionary industries, especially in Vietnam. Therefore, our paper “Optimal Capital Structure of Vietnamese Listed Firms - Finance Industry and Consumer Discretionary Industry” is conducted to make effort in considering the static structural models with the endogenous bankruptcy boundary in order to maximize the firm’s value and determine the adjustments in capital structure as well as the changes in the probability of default. The sample consists of 50 listed firms consisting of 25 finance companies and 25 consumer discretionary companies for the period of three years from 2018 to 2020. The static structural models is adopted. The detailed methodology and outcomes are outlined in our paper.
1. Introduction
Capital structure is considered a combination of diverse sources of funds, including debt, equity, or hybrid stocks, but offers significance over each other in the final decision of a firm to maximize the firm’s value and the wealth of existing shareholders (Romano et al., Citation2001). This issue attempts to select the best combination of these sources to finance a company’s operations and other investing activities. Graham (Citation2000) estimates that a standard company can raise asset value by 7.3% by supplying more bonds to positions where the marginal tax advantages associated with borrowings begin to decrease. Overall, the value of firms can increase by taking the benefits of using debts, namely the tax advantages of deductible interest and the decline in agency costs. However, managers still wonder whether to elevate leverage due to growth in the likelihood of financial distress. The optimal capital structure depends on the balance between the cost of debt and tax advantages. This study focuses on the substantial function of debt level and how the choices of the optimal debt level are made.
Credit risk is an essential source of risk for firms and has received considerable attention from precise regulatory scrutiny and policy discussions (Kambhu et al., Citation2007). Credit risk is a financial term that defines the loss due to the obligor’s failure to make timely payments (Koulafetis, Citation2017). The cornerstone of credit risk model can be assumed to be the probability of default. Of course, researchers are not the only ones concerned with the attributes of probability of default. The default probability is a key contributor that determines the price of credit assets, from bonds and debts to credit derivatives.
Since the 1960s, divergent researchers and financial analysts have developed theories to determine the effects of leverage choices on the value of a firm and try to derive the optimal capital structure. In this study, we start with highly recognized theories (Modigliani & Miller, Citation1958, Citation1963) theory, trade-off theory, agency theory, pecking order theory and equity market timing theory) and address the issue of estimating the optimal gearing level and default probability most effectively using structural models. Merton’s KMV Model is widely used for predicting bankruptcy risk. In addition, the analysis also applie Leland’s (Citation1994) and Leland and Toft’s (Citation1996) models in closed-form equations with several assumptions. Generally, the appropriate period to invest in projects, the proportions of debt and equity, and the change in leverage ratio are dynamic factors. We contrast analytical methods from theory with confidence intervals acquired from practice. The assumption of these models is that, with estimated returns and volatility, the value of a firm alters unsystematically over time. Companies proclaim bankruptcy when the value of assets reaches a pre-arranged optimal threshold to maximize the interests of stockholders in the case of endogenous default. These static models can bring both quantitative and qualitative results to the costs and benefits of debt. In addition, this study is based on parameter estimation methods as well as Brown motion to apply these models to real data to estimate specific results using mathematical and econometric solutions.
We restrict the sample companies to finance and consumer discretionary industries in Vietnam between 2018 and 2020. In the social development process, finance plays a leading role in accelerating the economy. In addition, the discretionary consumer sector tends to be most sensitive to the economic cycle, attracting consumers as their disposable income increases. Therefore, this study provides an optimized amalgamation of funding sources to help managers make the wisest choice in operating and attracting investment monetary capital, enhancing financial stability. In addition, investors can reduce credit risk and make rational decisions by evaluating bankruptcy probability. Despite the importance of this topic, few empirical studies have been conducted to obtain optimal leverage in Vietnam.
The originality of this paper is to estimate parameters to meet the objective of optimal capital structure for finance and consumer discretionary industries. The paper contains six sessions in total, beginning with an introduction chapter to demonstrate the background of the capital structure. Session 2: The literature review will be detailed within a theoretical framework. In the next section, we provide structural models of capital structure and default probability. Session 4 describes the methodology for applying the above aspects to the model. Section 5 presents an empirical analysis of the regression and a discussion of the findings. The final section concludes the paper.
2. Literature Review on Optimal Capital Structure
2.1. Theoretical Framework
2.1.1. Modigliani and Miller (MM) Theory of Capital Structure
The basic and primary MM theory is based on the unrealistic assumptions of perfect market circumstances, including the following assumptions: no taxes, transaction costs, agency costs, and bankruptcy costs. Modigliani and Miller state that the relative proportions of debt and equity of a firm are not relevant. However, through homemade leverage, individuals can copy or revoke the implications of corporate debt levels. Therefore, the market value of a firm is independent of its dividend policy and there is no optimal capital structure to maximize the firm’s value. Moreover, financial resolutions about the capital structure have no effect on the firm’s value, so the value of the levered firm would be equal to the value of the all-equity firm.
Furthermore, Modigliani and Miller (Citation1958) show that the expected rate of return on equity is positively correlated with the debt-to-equity ratio as the risk to shareholders increases. The advantages of less affordable funds offset equity drift; hence, the weighted average cost of capital (WACC) is unaffected by the capital structure.
The modified version with the effect of taxes by Modigliani and Miller asserts that, because of the elimination of interest from taxable income, the levered firm has a higher market value than the all-equity firm; this is called the impact of the tax shield. Owing to tax-deductible interest payments on the arrangement of taxation, taxable earnings are lower for firms associated with borrowings than for firms with no debt issuance.
2.1.2. Trade-off Theory
Paying attention to study of Modigliani and Miller (Citation1963) on taxation, Warner (Citation1977) on default and financial distress expenses, and Jensen and Meckling (Citation1976) on the agency, the trade-off theory suggests that the optimal capital structure is acquired by firms by trading off the costs of debt and equity against their tax advantages of debt. The tax advantage is issuing debt cutting the firm’s taxes due to allowable interest savings. Furthermore, the higher administration control makes the firm not be insolvency when it is required to serve repayments on schedule. Alternatively, the financial distress costs containing direct and indirect costs are directly proportional to the rise in borrowings. The direct costs encompass any payments or punishments resulting from default or liquidation namely accountants’ fees, lawful fees, management fees and other fees. The indirect costs are lost business that exists because prospective consumers would not get the risk of exercising a firm that might not be capable of furnishing its goods and services.
This theory adjusts MM theorem by attaching the result of financial distress costs when using leverage in the capital structure. In addition, the company could reduce financial distress costs by financing less debt in its capital structure. Therefore, the firm’s optimal debt ratio is the point where the advantage of interest tax shield is compensated by the financial distress costs.
2.1.3. Agency Theory
The agency theory is implied from the concept that managers will not always act in the best interest of the shareholders. Jensen and Meckling (Citation1976) further develop this notion completely by classifying two main conflicts of interest between parties in a firm, between shareholders and managers as well as between shareholders and debtholders.
Concerning the disputes between shareholders (principals) and managers (agents), managers follow the gains of the companies they manage for personal profit at the costs of the shareholders. Clearly, principals and agents act in their best interests. In addition, unlevered companies do not face bankruptcy, therefore, managers of all-equity firms would not have strong motivation to optimize equity holder’s interests and the poor administration would not be disciplined if less profit results in low prices of market share. Conversely, managers of levered companies would try to avoid default.
In the latter instance, the agency conflict exists between debtholders and shareholders since the former are comparatively more risk averse than the latter. Agency costs appears as debt creates the incentives to equity holders to invest sub-optimally. However, if the investment fails, the shareholders have to bear limited liability by exercising their right to leave. It implies that the debtholders with a firm whose market value is less than the principal of the debt. Specifically, when the companies must confront bankruptcy, there is no reasons for shareholders to invest more funds, even when positive NPV projects are available. This is because the returns from these projects will accumulate mostly for the debtholders. As a result, the creditors concur to incorporate debt covenants for self-protection, in which limit firms increase additional debt as well as control management acting in different ways.
2.1.4. Pecking Order Theory
The pecking order theory by Myers (Citation1984), proposes that companies enjoy a specific favorite rank for funds used to raise capital for profitable activities and thus, there is no optimal capital structure. It is assumed that there are three sources of capital available to firms namely internal capital, debt and equity. Retained earnings keep away from asymmetric information costs, for that reason, stand at the end of the order. Equity has a severely adverse problem while debt possesses slight one. In details, the company would like internal funds over debt and debt over equity due to the asymmetric information between firms and market. Myers (Citation1984) claimed that the asymmetric information issue can be relaxed only if companies use internal funds and does not supply new equity to manage the investment opportunities. It means that equity issuance is more adverse as rising information asymmetry expenses. Companies whose higher information asymmetry prefer issuing debt to offering undervalued shares. Reducing the level of debt in firm’s capital structure leads to a decrease in the price of its stock. A growth in the leverage ratio is a signal of high-quality news to market because it enables financial intermediaries to be direct investors to supervise the company’s prospects. Besides, managers may own private knowledge about the true firm’s performance which the potential investors are not informed of. Furthermore, the risk of the firm’s yield is not public to outsiders. Therefore, Myers (Citation1984) notes that they would depend mainly on open indications such as the gearing level of the business to examine their investment’s risk and the value of business might be underrated by the market.
2.1.5. Equity Market Timing Theory
The equity market timing theory claims that the capital structure improves to time the stock market by issuing shares when the share price is overpriced and repurchasing when it is underpriced (Baker & Wurgler, Citation2002). In reality, market timing plays an important role in corporate financial strategies. With rational managers and investors and asymmetry costs, Myers (Citation1984) assumes that equity issuance after public information decreases the adverse selection problem between the company’s managers and shareholders. It results in the increase in the market share price. Consequently, the companies would establish their particular timing opportunities. Meanwhile, with irrational investors and time varying mispricing, Baker and Wurgler (Citation2002) supposes that the firm tends to issue shares as its cost valuations is irrationally low and buy back when its costs valuations is irrationally high. To conclude, this theory does not require managers to expect the accurate costs of equity or inefficient market. The proposition verifies that the managers can time the market.
2.2. Models of Capital Structure and Default Probability
Reduced-form models and structural models are the two main approaches to capital structure. Structural models pioneered by Merton (Citation1974) determine the structural variables of firms in order to obtain the default barrier. Structural models are good indicators of distress and rating. In such a framework, the default procedure of a firm is driven by the asset value and risk of default, which are linked to the variability in the value of the company’s assets. Default occurs when the asset value is below liabilities. With the assumption of zero-coupon debt, bondholders will receive the face value of the bond if the firm value is greater than the liabilities at maturity. Therefore, shareholders will get nothing, and the bondholders return the market value of the company if the company declares bankruptcy. Following this initial perception, Merton obtained an obvious formula for risky default bonds, which can be applied to quantify the default probability. However, its application to firms with private stock price data is unavailable. Furthermore, crucial suppositions are often broken, and consequently, their application in practice is restricted. Alternatively, reduced-form (or intensity) models, originated by Jarrow and Turnbull (Citation1995), use information on bond prices and credit derivatives. Moreover, the former focuses on endogenous default, whereas the latter examines exogenous default (Elizalde, Citation2006). In structural models, bankruptcy boundary refers to a predictor of default when the ceremonial variables fall below a specific threshold. Conversely, intensity models do not consider default conditions and default intensity drives a bankruptcy event (Poulsen & Miltersen, Citation2014). The significant difference between the two approaches is that structural models put more effort into the capital structure based on the information possessed by the manager, whereas reduced-form models focus on the price of corporate bonds. Although the practicality of structural models is still under discussion, they have provided significant knowledge of the aspects that can affect the leverage ratio and debt rating. Regarding the static structural models of capital structure, the best debt-to-equity ratio that maximizes the value of the firm and the wealth of stockholders can be described as the optimal capital structure. The maximized value of the unleveraged firm is the present time. The assumption of static capital structure is a stationary debt level, meaning that debts are issued only once. Bondholders cannot refund at any rate because of the existence of default probability. Hammes (Citation2004) confirms that most papers on leverage are static and that a single target gearing is presumed to attach to companies.
2.3. Empirical Studies
Given the significance of the optimal capital structure as a firm’s value maximization, there is a large amount of studies in the field of capital structure with different aspects. Damayanti et al. (Citation2017) conducted an empirical study on a sample of 14 food and beverage companies listed on the Indonesia Exchange in 2017, and developed an Adjusted Present Value simulation by Aswath Damodaran to determine the optimal capital structure. Clearly, they attempted to use trade-off theory to clarify the capital structure options of these companies in their research. Domnick (Citation2018) built a study with the aim of investigating the effect of capital structure on firm performance for publicly listed German firms for five years from 2012. Analyses were performed using a fixed-effect regression model.
According to Wiyasa and Basyith (Citation2020), to find the effect of capital structure on profitability in five telecommunication industry companies on the Indonesian Stock Exchange, he used variables such as the debt-to-asset ratio, debt-to-equity ratio, and long-term debt-to-equity ratio to measure capital structure. Bond and Scott (Citation2006) conducted research on the data of 18 UK companies examined for seven years, until 2004. They focused on two models of capital structure—pecking order theory and trade-off theory—to examine capital structure choices.
Amraoui, Jianmu, and Bouarara (Citation2018) examined a firm’s capital structure determinants in 52 Moroccan companies covering a period of eight years from 2009 to 2016, in which they tested seven variables affecting debt decisions such as return on assets, return on equity, asset tangibility, and liquidity. Nassar (Citation2016) wrote the paper demonstrated the impact of capital structure on the financial performance of 136 industrial companies in Turkey from 2005 to 2012. To measure firm performance, we used indicators such as return on assets, return on equity, earnings per share, and debt ratio as capital structure variables. Vătavu (Citation2015) used several capital structure indicators to reflect the effect of capital structure on financial performance in Romanian-listed companies over a period of eight years, from 2003.
Bărbuţă-Mişu and Bodea (Citation2014 research used the comparative method over three years for five companies acting in the metallurgical sector to analyze the role of the leverage ratio in a firm’s financing. Petre developed a linear regression model and fixed effects model to assess the impact of capital structure on telecom firm value and then compared the values at the level of the United States and Europe.
The paper published by Dao and Lai in 2018 used static structural models to 30 enterprises acting in the real estate sector to analyze the potential difference in actual and optimal gearing levels for two years. Nguyen et al. (Citation2019) introduced an empirical test to examine an appropriate model for 227 Vietnamese listed firms to achieve optimal leverage from 2008 to 2017. This test was conducted using four models based on studies by Shyam-Sunder and Myers (Citation1999), Frank and Goyal (Citation2003), Yu and Aquino (Citation2009), and Razak and Rosli (Citation2014). The findings from this study suggest that the capital structure options of those companies are partially supported by the most famous theories, such as the trade-off, pecking order, and market timing theories.
According to Dao and Pham (Citation2020), studying corporate governance and bank default risk offers policy implications that help managers find appropriate management solutions or strategies to reduce the effects of these factors on the probability of bank default. In 2018, Dao used the Z-score credit scoring model to analyze the default probability of component stocks in the VN30 Index.
3. Static Structural Models of Capital Structure and Default Probability
This study focuses on three main models: Merton (Citation1974), Leland (Citation1994), and LLeland and Toft’s (Citation1996) model (Dao & Dinh, Citation2023).
We apply the estimated parameters as inputs for the closed-form equations to achieve the optimal leverage ratio and bankruptcy probability. As the sample firms are publicly traded, the risk-free interest rate and corporate tax rate are collected from the market, while other firm-specific parameters must be computed from market prices. We exercise financial record dates and gather the relative market prices of stocks on these dates. The risk-free rate is the average rate of return on the Vietnam 5-year Government bonds.
Table
4. Research Methodology
The main aim of this research is to determine the optimal capital structure and the probability of bankruptcy for publicly traded finance and consumer discretionary industries. Data were collected from 50 listed firms, consisting of 25 finance companies and 25 consumer discretionary companies, for a period of three years, from 2018 to 2020. This study examines the variation in optimal leverage as well as the adjustment in the probability of default when the time horizon of insolvency changes. Thus, the differences and similarities between the two areas were emphasized.
To ensure data accessibility, it is crucial to choose firms whose debt levels closely resemble the presumptions of the aforementioned models. In detail, Merton’s (Citation1974) model with zero-coupon debt firms and the Leland (Citation1994) model with perpetual bonds are preferable.
This study attempts to estimate asset volatility and drift by applying closed-form models of optimal capital structure and the probability of default. Stock returns play a crucial role in calculating the volatility and drift of stocks and then computing the volatility and drift of assets. The stock returns calculations are based on the market prices of stock of all companies collected on a day-to-day basis in three recent years, 2018 and 2020.
Our sample’s financial data in Figure shows information about the asset value of finance companies, except for the three largest firms, BID, CTG, and VCB, and the two smallest firms, PV2 and VIG. Clearly, finance companies with high debt-to-equity ratios have higher total assets than other activities in the entire stock market in Vietnam. The value of assets for BID, CTG, and VCB has reached more than one million billion VND. On the other hand, compared to the lowest rank, PV2 and VIG did not exceed 250 billion VND in asset value. Overall, the disparity in market capitalization of all finance firms is huge.
Figure 1. Finance firms by total assets (in billion VND, exc. BID, CTG, VCB, PV2 & VIG).
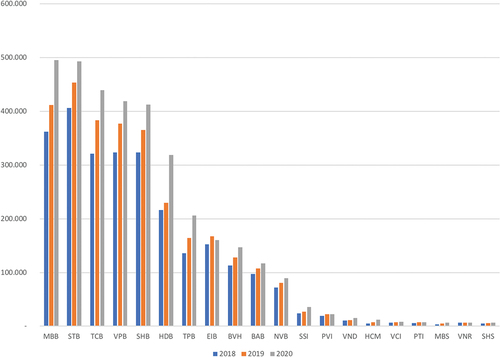
Regarding the price of shares, VCB expressed the most expensive stock price, followed by BVH, BID, and PVI, while PV2 and VIG still had the cheapest prices. The price of the BID stock was lower than that of other companies with high total assets, regardless of the largest asset value.
Figure illustrates the firm’s total assets for the consumer discretionary sector, eliminating the greatest company MWG and lowest asset value of SVT. In general, the total number of companies is relatively close to each other, not with as much discrepancy as in the finance industry. MWG accounted for 40% of the total market capitalization of this industry, more than five times as large as PNJ. The moderate asset value remained below 3,000 billion VND.
Figure 2. Consumer Discretionary firms by total assets (in billion VND, exc. MWG & SVT).
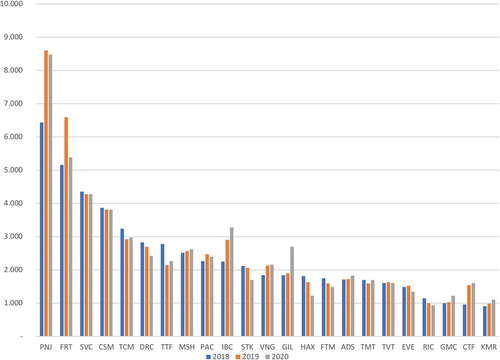
Considering the prices of securities, unlike the finance sector, the MWG had the highest value of assets and also had the highest share price. After PNJ, SVC, and MSH, the lowest were RIC, TTF, KMR, and FTM. Interestingly, the lowest level of the asset value firm, SVT, has an average share price that is much higher than that of firms with high asset value.
5. Discussion of Findings
5.1. Descriptive Statistics
In this section, we use the estimated parameters as inputs for the closed-form equations to achieve the optimal capital structure. We express stock returns in percentages on a daily basis. The tables were created to test the routine of the stock return distribution of 50 firms, which is an important supposition for the practice of capital structure models. Overall, the returns of shares are normally distributed roughly, in which there are quite enormous standard deviations. It is expected that the examination will be chosen continuously owing to the daily collection of information.
Descriptive statistics on stock volatility and drift in the sample are presented for three consecutive years. Table illustrates some of the most outstanding stocks in each group, and some stocks with extreme drift values are eliminated in the description. We also divided the volatility level into high, medium, and low volatility.
Table 1. Estimated stock volatility and drift
The finance industry had no low-volatility stock below 20% in either 2018 or 2020. In 2018, PV2 contributed the highest annual return of 26.62%, with medium stock volatility. Almost all stocks do not attract investors because of low or even negative expected rates of returns, typically VIG (−54.13%), SHS (−11.56%), and TCB (−9.66%). Nonetheless, outstanding stocks had returns as high as PV2 (26.62%) and BVH (17.06%).
In 2019, with medium volatility, VCB delivered the highest rate of return (11.85%) on investment, outstripping its low return last year. Following VCB, there are two high-volatility stocks, PV2 (10.95%) and VIG (8.89%). In contrast, the stocks with the most disappointed investors were those with medium volatility SSI (−9.91%), BVH (−6.76%), and SHS (−5.58%). In particular, with low volatility, MBB and TPB achieved positive favorable returns of 1.96% and 0.64%, respectively.
In 2020, most companies satisfied investors with extremely high returns compared to those two years ago. While the two smallest volatility stocks, EIB and NVB, gained positive returns, PV2 was the only stock with negative returns despite its high volatility. SHS, VIG, and HCM were seen as well-performing firms with annual drifts of 56.83%, 55.88%, and 42.99%, whereas the poor-performing companies could be named PV2, NVB, and EIB with returns of −5.76%, 0.48%, and 1.39%, respectively.
Regarding the consumer discretionary industry, RIC obtained the highest position in volatility with 85,03% but a relatively low expected rate of returns of 11,51% in 2018. IBC showed poor performance, resulting in a negative annual return of −1.31%. Especially, some firms with moderate volatility offered negative returns to investors could be seen as strange behavior such as MSH (−53.64%), FRT (−11.81%), EVE (−8.91%).
In 2019, SVT ranked first in terms of the rate of return (44.45%), with a high stock volatility of 76.76%. Some stocks, PNJ, MWG, and STK, were anticipated to exhibit relatively high drifts of 19.84%, 19.51%, and 19.23%, respectively, despite medium volatility. Meanwhile, some companies provide negative returns, such as PAC (−13.04%), GIL (−12.52%), and GMC (−11.02%).
In 2020, TCM had a high stock volatility of 47.80% and the rate of return jumped to 54.30%. Some stocks achieve high volatility in proportion to high-drift SVT (89.08%), TTF (43.49%), and SVC (33.54%). Although IBC had a low volatility of 19.69%, its return attained a positive value (5.87%) for the first time.
Table depicts the asset volatility calculated from the stock volatility of some firms in both industries. Asset volatility is grouped as high, medium, and low volatility. The classifications are based on relative comparisons between the companies in each industry.
Table 2. Implied asset volatility by Merton-KMV Model
5.2. Optimal Capital Structure
The assumption of static models that do not allow companies to refinance more than once is impractical. However, it can be seen as divergent circumstances manipulated for a short period of time. The Merton model does not build a formula for the optimal gearing level; therefore, this study did not focus on it. In this section, we consider Leland’s (Citation1994) model for the optimal capital structure of unprotected debts because of the unrealistic assumption of the absence of bankruptcy costs. The instance of protected debts is examined through the Leland and Toft (Citation1996) model because of the different reconcilable features between them and rolled-over bonds.
5.2.1. The Leland (Citation1994) Optimal Capital Structure
Table shows the estimation results for the optimized gearing level using the Leland (Citation1994) model for finance firms. Overall, the company considers the debt ratio a risk-reducing function because a decrease in leverage is related to an increase in the uncertainty of asset value. Risky companies will have a low firm value associated with the debt level because of the high chance that the total assets will fall to the bankruptcy boundary. To be clearer, small volatility stocks (such as VPB, TCB, and BID) came with superior capital structure optimization from the scale of 80% to over 90%. Meanwhile, with large asset volatility, these stocks (SHS, VIG, and PV2) only obtained an optimal leverage of approximately 50% or even lower.
Table 3. Leland (Citation1994) optimal capital structure of finance firms
Specifically, the examination shows that the relative number of finance companies overleveraged their debt level in 2018. The number of enterprises using current leverage ratios greater than the optimal ratio was almost unchanged in 2019 and increased significantly by approximately 30% in 2020. This could prove that firms are still exploring tax benefits by financing more debts. In addition, they must deal with the increasing costs of financial distress to avoid bankruptcy. These typical firms are BID, TCB, VPB, SSI, and VNR, with moderate to low asset volatility.
Moreover, most companies whose actual gearing level is less than the calculated optimization have a capital structure measured by book value below that quantified by market value. However, there are still a few impressive companies that attain capital structure by market value beneath book value, such as MBB (in three consecutive years), EIB and PVI (in 2020), and BID, VPB, HDB, and HCM (in 2019).
Table presents a descriptive evaluation of the optimal capital structure of finance companies using the Leland (Citation1994) model. There was a slight decrease from 30.87% − 97.87% in 2018 to 27.37% − 97.86% and to 30.49% − 93.88% in 2020. In contrast, the mean of the optimized leverage showed an opposite trend. 2019 represented an increase of approximately 10% in the average value of optimal leverage to 82.30%, followed by a sudden drop to 68.89% in the following year. The model implies that there are three firms that rank first in the optimal capital structure for three consecutive years: NVB, TPB, and EIB. It is worth noting that NVB started with an optimal level of 97.87%, remained almost the same in 2018, and then halved in the next two years. Meanwhile, PV2 has the lowest optimal value in the first two years with 30.87% and 27.37%, respectively, before growing minimally to 31.09% in the last year of the period.
Table 4. Leland (Citation1994) optimal capital structure of consumer discretionary firms
As discussed, the optimal gearing level for the consumer discretionary sector rises according to a fall in corporate risk. In general, the mean calculated value for 2019 was higher than that for the other two years. The year 2019 showed prominent growth before a rapid decline one year later.
Overall, in 2018, nearly 60% of discretionary consumer companies acquired an optimal capital structure higher than the actual level. The figure increased slightly the next year and then decreased for the following two years. Another point of interest is that some businesses owning stocks have optimal leverage between the actual leverage by book value and the level by market value, including MWG (for all three years), TTF and FTM (in 2019, 2020), CSM, TCM, ADS, TMT, and TVT (in 2020).
Moreover, the Leland model suggests that most market value leverage is higher than book value leverage when underleveraging, as in the finance industry. There are companies that reflect the opposite in all three years, such as PNJ and IBC, in 2019, 2020 consisting of DRC, VNG, and CTF (2020).
The optimal debt ratio of discretionary consumer firms exhibits a tendency similar to that of finance firms. The average optimal level increased by 7% in the first year to 65.86%, followed by a decrease to 53% by 2020. In more detail, company SVT has almost the lowest optimal capital structure in the three years and shows the same movement as the whole industry (26.27% − 30.87% − 25.43%). On the other hand, the effect of low asset volatility causes ADS, the highest company in terms of optimal leverage, to diminish steadily over three years, from 92.77% in the beginning to 80.87% in the next two years.
5.2.2. The Leland and Toft (Citation1996) Optimal Capital Structure
Resembling the method introduced by Leland (Citation1994), Leland and Toft (Citation1996) also use endogenous borders and calculate asset volatility to reach the optimal leverage to maximize firm value.
Table and Table describe the optimal capital structure by Leland and Toft’s (Citation1996) model in the finance and consumer discretionary industries. Leland and Toft (Citation1996) emphasize the reversed correlation that the smaller the company’s risk (lower sigma), the greater the optimal capital structure and default levels. Amazingly, some firms whose stocks are not shown because of unfamiliar movements and calculation results cannot be discovered by closed-form procedures.
Table 5. Leland and Toft (Citation1996) optimal capital structure of finance firms
Table 6. Leland and Toft (Citation1996) optimal capital structure of consumer discretionary firms
The optimal gearing level reaches different values proportional to the finance industry. The mean value varies from 50% to 65%. PTI is the company most encouraged to use debt financing in all three years, with nearly 100% leverage, due to its low asset volatility. Meanwhile, TPB, PVI, and PV2 are advised to borrow less than 40% of their capital structures.
The discretionary consumer industry has been observed to have a lower optimal capital structure than the finance sector, which is the result of a greater level of risk. However, the average debt level of the latter is higher than that of the former in all the years under examination, in which two companies are recommended to use up to 100% debt (TTF and TMT).
Structural methods assume that corporate tax levels are unalterable. Nonetheless, findings show that the optimal capital structure shows a favorable trend when the regulatory tax percentage decreases (Dao & Lai, Citation2018). This could be explained by the fact that lowering taxable income decreases the ability to exploit tax advantages and reduces the value of liabilities and assets. If the descending movement in firm value does not exceed the variation in debt value, the target debt level in the capital structure will decline by a corresponding proportion. The influence of the corporate tax rate is one of the reasons that firms with diverse optimal capital structures are subject to diverse tax regulations.
Default expenses signal a firm’s riskiness when it comes to investment decisions. When a firm has high default costs, executives automatically have incentives to lessen liabilities and coupons to increase the asset value. A company’s debt levels fall, followed by a decrease in default entry and extended period performance. Conversely, the value of an asset can be counterbalanced by taking advantage of the longer discounted bankruptcy expenses and tax advantages from more liabilities. When the negative effect overcomes the second offset, asset value decreases in response to upward bankruptcy costs.
Generally, companies that exhibit high asset certainty are at high risk of insolvency. For this reason, the asset value dwindles because of the few tax advantages (low liability availability) and great default expenses. This results in a decrease in the target capital structure. However, there is another note by Leland and Toft (Citation1996). As stated, bankruptcy occurs when the endogenous bankruptcy precipitate value is larger than firm value. Leland and Toft (Citation1996) note that owing to the expected admiration in capital, companies could announce defaults, although the value of assets is above the face value of debt.
As shown in Table , although a substantial number of finance firms exhibit a greater optimal capital structure under the Leland and Toft (Citation1996) model than under the Leland (Citation1994) model, it is suggested that firms borrow up to 100% more in the former. It is worth mentioning that the estimates for the consumer discretionary industry in Leland and Toft’s (Citation1996) model are higher than those in Leland’s (Citation1994) model. The latter model better evaluates the capital structure of firms and provides adjacent to actual standard values. Although the forecasts are different, almost all firms in both industries possess an optimal leverage that is superior to the real ones via the two models.
Table 7. Comparison of optimal leverage between Leland (Citation1994) model and Leland and Toft (Citation1996) model
In conclusion, the disadvantages of the two approaches are undefined and impartial values (Bruche, Citation2006). One possible cause for the estimated parameters is an imperfect market. Therefore, the two models have presumed market simplifications that prevent them from accurately determining the leverage tested for factual values, thus limiting their experimentation.
5.3. Default Probability
To obtain the probability of bankruptcy for the two industries, the KMV, Leland (Citation1994) and Leland and Toft (Citation1996) models use the calculated asset volatility and drift with payout ratio on the default probability ( = 2%) (Tables ).
Table 8. Default probability of finance firms
Table 9. Default probability of consumer discretionary firms
Table indicates the default probability for finance industry by Merton KMV, Leland (Citation1994), and Leland and Toft (Citation1996) model. The results show that with the same time horizon of three years, in general, 2020’s PD is higher than 2019’s PD and 2018’s PD in KMV model while 2018’s PD is higher than 2020’s PD and 2019’s PD in Leland (Citation1994), and Leland and Toft (Citation1996) model.
Default probability for consumer discretionary companies (Table ) experience a more observable trend when more than 50% of described stocks have highest default probability in 2020 given the same default horizon in KMV model. The 2020’s DP seems lower than this figures in 2018 and 2019 given the same time length in Leland (Citation1994), and Leland and Toft (Citation1996) model. In fact, the Leland and Toft (Citation1996) model gives more unreasonable default probability and shows lower the estimated figures than two other models. Most unreasonable figures related to negative asset drift value. It can have doubts that the model does not fit perfectly with some company at a certain level.
Although using the same approach as Leland (Citation1994) to verify the estimated results under the endogenous bankruptcy boundary, Leland and Toft (Citation1996) add the payout rate (δ = 2%) in addition to the conditional parameters as in the former (debt and firm values, asset volatility and return) in order to attain the default probability.
6. Conclusion
This study highlights the link between the corporate tax rate and cost of debt with the leverage of firms. As analyzed above, the target capital structure changes proportionally to the tax percentage due to tax benefits (deductible interest payments) and varies inversely with the cost of debt (default and financial distress costs). Alternatively, instead of static structural models, firms can apply theories on debt level to determine the optimal leverage, typically the trade-off theory, based on the complication of capital structure. However, these models still have some limitations, mainly imperfect markets that cause unfeasible suppositions and other factors in reality. In addition, the assumption that companies cannot finance debt up to twice makes the computed amounts almost larger than the current numbers, since businesses can, in fact, lever or repurchase liabilities as they wish. Consequently, the optimal capital structure acquired through structural approaches cannot only help enterprises determine the sensible amounts they borrow but also serve as reference data for final financial resolutions. The heterogeneity between capital structure indicated by the methods and the capital structure supplied by firms implies that a more extensive analysis of the association along with different factors affecting the gearing quantity, particularly those related to the finance and consumer discretionary industries, is required.
Regardless of focusing largely on methodology rather than the experiential effect of static structural techniques, it supplies recommendations for more accurate analysis, the target gearing figure and default probability estimated in the study can be crucial sources of information for banks in loan commitments for finance and consumer discretionary companies. Obviously, companies near or surpassing optimized capital structures or with high defaults should not be lent or invested.
This study emphasizes the largest listed companies in terms of total assets; thus, dissimilarities in optimal leverage between large and insignificant companies are not comprehensibly indicated. However, analysis has shown that larger businesses have such a high level of cash flows and the capacity to relax non-permanent liquidity issues that they can raise funds more through borrowing. Small businesses should not take out more loans because of the likelihood of missing maturing duties with low flexibility in the source of funds.
From the structural models of capital structure, we can intelligibly observe the influence of ancient elements on the selection of a company’s debt-to-equity ratio. In other words, the optimized gearing figure is sensitive to the transformed risk-free rate of the authority. Nevertheless, it is complicated to make an assertion about the debt level reply because the impact of this variable puts the two models together, emphasizing how complex capital structure is in the presumption. Specifically, when the government raises the risk-free interest rate, companies under Leland’s (Citation1994) model are motivated to borrow more, while companies in Leland and Toft’s (Citation1996) model are entirely assorted. By contrast, the business’s leverage responds clearly to adjustments in corporate income tax. As enterprises are levied more heavily on tax, they manage their cash flow levels mainly by issuing debts.
Disclosure statement
No potential conflict of interest was reported by the author(s).
Additional information
Notes on contributors
Thi Thanh Binh Dao
Thi Thanh Binh Dao obtained her PhD in Credit Risk at University Paris Dauphine in 2005. Binh currently works at the Department of Finance, Hanoi University. Binh does research in Mathematical Economics, Banking Risks, Capital Structure and Corporate Governance. Her current project is ‘Capital Structure and Firm Efficiency’ and Meta-Analysis of Risks Taking.
Thu Ha Le
Thu Ha Le completed her Bachelor’s degree in Finance and Banking from Hanoi University, Vietnam. She is presently working in the field of finance and auditing.
References
- Amraoui, M, Jianmu, Y, & Bouarara, K. (2018). Firm’s Capital Structure Determinants and Financing Choice by Industry in Morocco. IJMSBA, 4(3), 41–19. https://doi.org/10.18775/ijmsba.1849-5664-5419.2014.43.1005
- Baker, M., & Wurgler, J. (2002). Market timing and capital structure. The Journal of Finance, 57(1), 1–32. https://doi.org/10.1111/1540-6261.00414
- Bărbuţă-Mişu, N., & Bodea, M. F. (2014). The Role of Capital Structure in Company's Financing. Annals of the University Dunarea de Jos of Galati: Fascicle. I, Economics & Applied Informatics, 20(3).
- Bond, S. A., & Scott, P. J. (2006). The capital structure decision for listed real estate companies. SSRN Journal. https://doi.org/10.2139/ssrn.876429
- Bruche, M. (2006). Estimating Structural Models of Corporate Bond Prices. CEMFI Working Paper. No. 0610.
- Damayanti, S. M., Mulyono, J. J., & Murtaqi, I. (2017). The optimal capital structure: An empirical study of Indonesia Company in the food and beverage industry. JEB, 4(2), 93–106. https://doi.org/10.35590/jeb.v4i2.738
- Dao, T. T. B., & Dinh, T. H. (2023). Default probability of listed seafood and construction firms based on structural approach. Journal of Finance & Accounting Research, 01(20), 49–57. https://sti.vista.gov.vn/tw/Lists/TaiLieuKHCN/Attachments/355303/CVv266S1A2023053.pdf
- Dao, T. T. B., & Lai, H. P. (2018). A study on optimal capital structure of Vietnamese Real Estate Listed Firms. Journal of Economics and Development, 20(3), 45–70. https://doi.org/10.33301/JED-P-2018-20-03-04
- Dao, T. T. B., & Pham, T. N. H. (2020). Corporate governance and bank default risk: Probability of default, distance to default. Journal of Forecast Economics, 27, 23–27. https://doi.org/10.2139/ssrn.2708994
- Domnick, C. H. (2018). Influence of capital structure on firm´ s financial performance: an inter-industry investigation of German listed firms, Bachelor's thesis. University of Twente.
- Elizalde, A. (2006). Credit risk models II: structural models. Documentos de Trabajo (CEMFI), 6(1).
- Frank, M. Z. & Goyal, V. K. (2003). Testing the pecking order theory of capital structure. Journal of Financial Economics, 67(2), 217–248. https://doi.org/10.1016/S0304-405X(02)00252-0
- Graham J. R. (2000). How big are the Tax Benefits of Debt?. The Journal of Finance, 55(5), 1901–1941. https://doi.org/10.1111/0022-1082.00277
- Hammes, K. (2004). Capital structure dynamics in the Nordic Real Estate Sector.
- Jarrow, A. R., & Turnbull, M. S. (1995). Pricing Derivatives on Financial Securities Subject to Credit Risk. The Journal of finance, 50(1), 53–85. https://doi.org/10.1111/j.1540-6261.1995.tb05167.x
- Jensen, M. C., & Meckling, W. H. (1976). Theory of the firm: Managerial behavior, agency costs and ownership structure. Journal of Financial Economics, 3(4), 305–360. https://doi.org/10.1016/0304-405X(76)90026-X
- Kambhu, J., Schuermann, T., & Stiroh, K. J. (2007). Hedge funds, financial intermediation, and systemic risk. Economic Policy Review, 13(3). https://doi.org/10.2139/ssrn.995907
- Koulafetis, P. (2017). Modern credit risk management: Theory and practice. Palgrave Macmillan UK. https://doi.org/10.1057/978-1-137-52407-2
- Leland, H. E. (1994). Corporate debt value, bond covenants, and optimal capital structure. The Journal of Finance, 49(4), 1213–1252. https://doi.org/10.1111/j.1540-6261.1994.tb02452.x
- Leland, H. E., & Toft, K. B. (1996). Optimal capital structure, endogenous bankruptcy, and the term structure of credit spreads. The Journal of Finance, 51(3), 987–1019. https://doi.org/10.1111/j.1540-6261.1996.tb02714.x
- Merton, R. C. (1974). On the pricing of corporate debt: The risk structure of interest rates. The Journal of Finance, 29(2), 449–470. https://doi.org/10.1111/j.1540-6261.1974.tb03058.x
- Modigliani, F., & Miller, M. H. (1958). The Cost of capital, corporation finance and the theory of investment. The American Economic Review, 48(3), 261–297. http://www.jstor.org/stable/1809766
- Modigliani, F., & Miller, M. H. (1963). Corporate income taxes and the cost of capital. The American Economic Review, 53(3), 433–443. https://www.jstor.org/stable/1809167
- Myers, S. C. (1984). The capital structure puzzle. The Journal of Finance, 39(3), 574–592. https://doi.org/10.1111/j.1540-6261.1984.tb03646.x
- Nassar, S. (2016). The Impact of Capital Structure on Financial Performance of the Firms: Evidence From Borsa Istanbul. J Bus Fin Aff, 5(2). https://doi.org/10.4172/2167-0234.1000173
- Nguyen, H., & V. (2019). An empirical test of capital structure theories for the Vietnamese listed firms. JRFM, 12(3), 148. https://doi.org/10.3390/jrfm12030148
- Poulsen, T. K., & Miltersen, K. R. (2014). “Dynamic Capital Structure: Debt Rollover and Funding Liquidity.” Master’s Paper, Copenhagen Business School.
- Razak, A., Hisyam, N., & Rosli, M. N. (2014). A test between pecking order hypothesis and static trade-off theory: An analysis from Malaysian listed firms for periods of year 2007 to 2012. International Journal of Business & Commerce, 3(5).
- Romano, C. A., Tanewski, G. A., & Smyrnios, K. X. (2001). Capital structure decision making: A model for family business. Journal of Business Venturing, 16(3), 285–310. https://doi.org/10.1016/S0883-9026(99)00053-1
- Shyam-Sunder, L., & Myers, S. C. (1999). Testing static tradeoff against pecking order models of capital structure. Journal of Financial Economics, 51(2), 219–244. https://doi.org/10.1016/S0304-405X(98)00051-8
- Vătavu, S. (2015). The impact of capital structure on financial performance in Romanian Listed Companies. Procedia Economics and Finance, 32, 1314–1322. https://doi.org/10.1016/S2212-5671(15)01508-7
- Warner, J. (1977). Bankruptcy costs: Some evidence. The Journal of Finance, 32(2), 337–347. https://doi.org/10.2307/2326766
- Wiyasa, I. W. S., & Basyith, A. (2020, February). The Impact of Capital Structure on Profitability in the Telecommunication Industry Listed on the Indonesian Stock Exchange. Proceedings of the 3rd Global Conference On Business, Management, and Entrepreneurship (GCBME 2018) (pp. 88–92). Atlantis Press.
- Yu, D. D., & Aquino, R. Q. (2009). Testing capital structure models on Philippine listed firms. Applied Economics, 41(15), 1973–1990. https://doi.org/10.1080/00036840601131805