
 ?Mathematical formulae have been encoded as MathML and are displayed in this HTML version using MathJax in order to improve their display. Uncheck the box to turn MathJax off. This feature requires Javascript. Click on a formula to zoom.
Abstract
The Erasmus mobility exchange program is one of the most considerable cooperation and mobility networks in the world; however, the driving forces of the mobility exchange program are still questionable. Integrating various databases and including new indicators, such as crimes, collaboration, and culture, called the 3Cs in our model, offers us new insights into the driving forces of mobility. In contrast to most studies, this research is based on the entire Erasmus network, which is investigated at both institutional and regional (NUTS3 or county) levels. The advantage of investigating entire mobility networks is that it helps avoid sampling distortions. Nevertheless, the interpretation is more challenging than with other investigation scopes since most identified factors act as indicators rather than proxies of the driving forces of mobility exchanges. Despite this interpretation difficulty, conclusions about the entire network can only be drawn by examining the whole mobility exchange network. In this study, the network of Erasmus student exchange programs between 2008 and 2013 is investigated both overall and separated by subject area. The study identifies the individual, institutional, and county-wide driving forces of mobility. One of the main exciting findings that the applied gravity models suggest is that there are three principal driving forces, national culture, collaboration, and crime dimensions of the host countries, which have not yet been studied in terms of Erasmus exchange networks.
PUBLIC INTEREST STATEMENT
The Erasmus exchange program is a significant global network for cooperation and mobility; however, what motivates students to participate in this program is still being determined. This study investigates the entire Erasmus network and identifies the individual, institutional, and county-wide factors that drive mobility. By integrating various databases and including new indicators, such as crimes, collaboration, and culture, the study reveals new insights into the driving forces of mobility. The findings suggest that three principal driving forces still need to be studied in the Erasmus exchange network, namely, the national culture, collaboration, and crime dimensions of the host countries. While interpreting the results is challenging, investigating the entire network helps avoid sampling distortions and allows for conclusions to be drawn about the whole mobility exchange network. Overall, this study provides valuable insights into the driving forces of the Erasmus mobility exchange program.
1. Introduction
In 1987, the European Union (EU) launched the Erasmus program (Watts et al., Citation2010), which allowed more than three million European students to conduct part of their studies (Healey, Citation2008) at other European higher education institutions or organizations. Twenty-eight EU member states and six non-EU countries joined for the program at different times between 1987 and 2009 with the aim of creating a “European dimension” of education (Ryba, Citation1995). As stated by the European Commission, the Erasmus student exchange has several important features, equally contributing to strengthening the existing relations among European peoples, the institutional integration among European countries, the openness of national tertiary systems and the relative attractiveness of various countries (Natkhov & Polishchuk, Citation2019), in terms of either their cultures (Senci et al., Citation2022) or the reputation of their tertiary education systems. Complex multivariate socioeconomic data are widely used for monitoring regional policies (Seliverstov, Citation2012); thus, the number of previous studies on this subject is rather vast; however, the depth of data, unit of interest, and focus of the investigations vary (Maggioni & Uberti, Citation2009), requiring a systematic approach to such analysis. Most of the published papers in English selected a certain segment of students, limiting their research to the mobility statistics of a selected country (Rodrıéguez et al., Citation2012) or countries or to specific regions within countries, sometimes via surveys and interviews (Sigalas, Citation2010b), and focusing on limited fields of study, thereby creating a gap that leaves ample room for additional research regarding the complete network (Savić et al., Citation2017). In addition to the datasets used, other important factors are the level of investigation and which economic or socioeconomic variables were used to conduct the studies (Verbik & Lasanowski, Citation2007). The country and individual levels were examined in most cases, with a few occasions where the institutional level was the focus (Breznik et al., Citation2014). The most common variables were age, level of education, gender and GDP; as far as socioeconomic and economic variables are concerned, these studies focused on student exchanges, as there are larger and more complete databases available regarding student exchanges than exchanges involving professionals (Teichler, Citation2004). After reviewing the literature (see the detailed results in Table ), three main gaps are identified. (1) Since most papers based on the surveys concentrated on one area of a country or one country involved in Erasmus exchanges, they could not identify the drivers of the entire exchange network. (2) The remaining literature, which tried to use regressions, or gravity models, could not find at least moderate level determinant coefficients for the entire exchange network, and the nature of the method deployed in these studies should also be critically examined. (3) The studies on the entire network usually neglected the main possible drivers, such as crime, which is a proxy for public safety; collaboration, which is an important indicator of institutional cooperation; and cultural aspects, which are already studied in surveys (Van Mol & Michielsen, Citation2015) but have not yet been studied in the entire network. The main purpose of the study is to identify the driving forces of the Erasmus mobility exchange program by integrating various databases and including new indicators, such as crimes, collaboration, and culture (3Cs). To find better models and methods to model the Erasmus exchange network, this paper proposes three improvements: (1) including new variables, such as culture, crime and collaboration (hereafter called the 3Cs); (2) aggregating the mobility network into a NUTS 3 regional level and distinguishing among scientific fields while also aggregating the yearly data, or in other words, using static models instead of more complex time-series models; and (3) using random forest regression instead of linear regression to avoid multicollinearity.
Table 1. The set of independent variables employed from the studied literature
Table 2. List of variables in gravity-like model
The remainder of the paper is organized as follows. In the background section (Section 2), related works are reviewed. In Section 3, the employed data and methods are introduced. Then, in Section 4, the results of time-series gravity models are presented for both the individual and regional levels. Section 5 discusses the results, and Section 6 summarizes the conclusions. Furthermore, Section 6 also describes the limitations of this study and directions for future work.
2. Literature review
A literature review was conducted using the systematic literature review technique (SLR), which is introduced below. The applied SLR technique was used to collect studies focused on the Erasmus exchange program. Studies that used regression or gravity models to describe the exchange program were analyzed in more depth than other studies. The analysis of existing studies indicated that several economic variables, such as gross added value, social variables, such as crime, and national cultural variables have not been studied or have been only very scarcely studied. While several surveys (Camiciottoli, Citation2010) have already highlighted cultural drivers of exchange, these relationships have never been tested for the entire Erasmus network. Since we agree with former studies that it is important to examine culture, we included cultural variables in the gravity model. Thus, it was possible to examine the role of culture in the whole network. As the studies of the whole network did not address the role of culture, the studies on culture are summarized in a separate subsection 2.4.
2.1. Systematic literature review techniques
To keep up with state-of-the-art research, general new knowledge literature review methods need to be utilized. A systematic way of collecting and synthesizing previous research can be an effective tool for ensuring a well-conducted review (Snyder, Citation2019) with a firm foundation for advancing knowledge and facilitating theory development. The importance of systematic literature reviews lies in the necessity of acquiring up-to-date scientific results and identifying presumed and existing gaps within the area of research. The applied method for the typology of literature reviews must be proved applicable and the approach fitting. Several literature review types have been developed based on different aspects (Paré et al., Citation2015). summarized them and categorized them into nine types. Meta-analyses are a powerful tool for quantitative research, as they focus on data extraction techniques and statistical methods to aggregate quantitative data.
2.1.1. PRISMA
Preferred Reporting Items for Systematic reviews and Meta-Analyses, PRISMA for short, is a systematic literature review (SLR) methodology. A systematic review of a clearly formulated question is one that uses systematic and explicit methods to identify, select, and critically appraise relevant studies and to collect and analyze data from the studies that are included in the review. Statistical methods (meta-analysis) can be used to analyze and summarize the results of the included studies. A meta-analysis refers to the use of statistical techniques in a systematic review to integrate the results of included studies (Liberati et al., Citation2009). As per the definition of PRISMA, the 0th phase is formulating the question around which the systematic review starts. In this study, these questions about previous studies concerned the level of investigation at which they were conducted, be it the individual, institutional, regional or country level; the sources of data; the targeted groups of the research, that is, students, teachers or other staff; and the various economic, social, socioeconomic or cultural variables used. In this study, we tried to collect all studies related to Erasmus network exchange, particularly on the regression and gravity models for entire networks. The advantage of these models is that the scope of the research is the entire network; however, the variables can usually only be treated as proxies. While surveys can be used for deeper analysis, their conclusions are usually limited to the samples. Therefore, the applied PRISMA method also has to find relevant surveys, where important variables analyzed in the surveys can be treated as new variables in the analysis of the entire network.
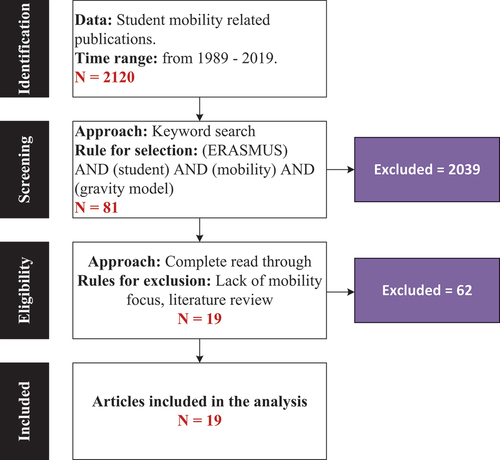
The 1st phase of PRISMA is the identification of the available research on the subject, and the keywords used here were Erasmus, mobility, gravity model and student. A total of 2120 studies in English were found, and these were screened for duplicates, as per the procedure for the 2nd phase of PRISMA. By the end of the second phase of screening for redundant papers, 81 remained.
The 3rd phase examines the eligibility of the screened papers. This screening method (Teichler, Citation1996) is based on the full text of the articles, and studies that were removed were those that were literature reviews or that lacked mobility-focused research. In the first run, after searching for gravity models, 19 papers remained in the pool of articles that were used for the systematic literature review.
Survey-based studies and larger-scale studies that utilized full databases based on ERASMUS, OECD, EUROSTAT, UNESCO, and IRO databases were conducted to address various research questions with different education-oriented perspectives (Barrioluengo & Flisi, Citation2017, Breznik, Gologranc, Citation2014; Lesjak et al., Citation2015; Orr et al., Citation2011; Savić et al., Citation2017; Verbik & Lasanowski, Citation2007). The results of studies showed that financial analysis, institutions’ rankings, clustering of higher education institutions, network-building abilities of students, costs of living, and cultural variables are crucial factors affecting ERASMUS program participation (Llanes et al., Citation2012; Rodrıéguez et al., Citation2012). The studies also highlighted the significant benefits of the program in terms of English language skills, personal development, and liberal mindset adoption (Camiciottoli, Citation2010; Sigalas, Citation2010a). Additionally, the studies suggested that the program should emphasize opportunities for personal development and promote interactions among students (Otero, Citation2008; Souto-Otero et al., Citation2013). The review concludes with the idea that cultural distance and psychic distance should be differentiated as the former refers to shared cultural norms and/or values, and the latter refers to the perceived differences between cultures (Derzsi et al., Citation2011; Golubeva et al., Citation2018; Rodrıéguez González et al., Citation2011).
Figure Shows the PRISMA selection process with all identified literature down to the final list of included papers.
Figure 1. The result of the PRISMA method
2.2. The role of mobility programs
The term internationalization in higher education has key aspects widely examined by experts, including border-crossing, cooperation, and research, and research on these topics is generally growing. International student mobility is a traditional medium for knowledge transfer, and an increasing amount of attention is given to this topic (Sung, Citation2022; Teichler, Citation2017).
The US, the UK and Australia are the most prominent recipient countries in the international student exchange market. All of these native English-speaking countries attract significant numbers of students from countries throughout the world and have consistently done so for many years (Nada & Legutko, Citation2022). By successfully attracting tens of thousands of students from across the globe, each country has managed to establish a diversified market with strong growth potential (Verbik & Lasanowski, Citation2007). An increasing amount of competition has ensued for mobile students (Beech, Citation2018). Students who engage in mobility by leaving their home countries and institutions are described as outwardly mobile, while inwardly mobile students flow within their own countries. The knowledge transfer sought by mobile students is twofold. On the one hand, degree-mobile students wish to experience and gain competence in a very different system than their home environment. On the other hand, temporarily mobile students view their mobility as a supplement to their core studies, as well as a contrast to what their home institutions can offer, with the hopes of gaining equivalency credits and thus not being penalized with a longer overall duration of study than their fellow nonmobile peers (Souto-Otero et al., Citation2013). The purposes of mobility programs vary, as do their respective opportunities and problems. The Bologna Process in Europe was expected to make higher education in European countries more attractive for students from other parts of the world and to facilitate intra-European student mobility (Senci et al., Citation2022). Temporary student mobility within Europe via Erasmus contributes strongly to the inherent goals of the Bologna Process, and the academic and professional value of such mobility is most highly appreciated by students from Central and Eastern European countries, where opportunities for large-scale inward and outward mobility are low (Rivza & Teichler, Citation2007). Data collection regarding outgoing mobility is rare and often incomplete. It is important to note that despite the popularity of the Erasmus program and its significant impact on student mobility, there is currently no publicly available dataset that comprehensively captures its effects. The dataset used in this study covers the period between 2008 and 2013. Therefore, it cannot fully capture the recent changes in the program. Since 2013, mobility options for students have both expanded and become limited, particularly for students traveling to and from Switzerland and the UK (Glass & Cruz, Citation2023). Funding for students traveling to these countries has been affected, which may have a significant impact on the number of students able to participate in the program. These changes are important to consider in the context of the Erasmus program and its ongoing evolution (Kabanbayeva et al., Citation2019). Future studies should take these factors into account and seek to incorporate more recent data to provide a more comprehensive picture of the program’s effects.
2.3. Gravity models in mobility
Economic studies of migration mostly use the labor market model, where the workforce reacts to the wage differences among countries. Many other factors influence immigration, however. A widely used alteration of the regression model, the gravity model of trade, specifies trade as a function that attracts mobile people and the distance between their home and host locations hinders them from engaging in this “trade” (Lewer & Van den Berg, Citation2008). Popular variables used to describe this trade with the gravity model include demographic, geographic, ethnic/linguistic, and economic factors. Migration, similar to international trade, is driven by the attractive forces between home and host countries and is hindered by a variety of economic and socioeconomic factors. According to various studies (see Table ), the same holds true for student exchanges among higher education institutions within Erasmus, where the most commonly used variables include GDP, age and gender. However, the purpose and role of mobility programs suggests a key component culture, as shown by survey-based studies (Camiciottoli, Citation2010; Sigalas, Citation2010a; Van Mol & Michielsen, Citation2015), warranting a larger-scale study of the phenomenon; thus, our proposed gravity model includes such variables via the Hofstede database. Table collects related studies and the considered independent variables.
Table shows that variables related to both culture and collaboration were not studied or were infrequently studied with regression models. In addition, all models based on the entire exchange network provide a low determinant value (). Regarding the considered studies, both the unit of interest (students, institutes, regions) and the research focus (entire network, a scientific field, or a limited sample of a survey) were very diverse.
2.4. The 3Cs in mobility
Studies of the entire Erasmus network have paid little attention to public safety (which can be measured with a proxy indicator: crime rate) (Bernasco et al., Citation2016), institutional collaboration (Jansen & Schuwer, Citation2015), and, especially, cultural drivers (Neckerman et al., Citation1999). However, these variables, called the 3Cs in this study, have great importance in mobility surveys (Llanes et al., Citation2012).
Cooperation among EU member states is becoming increasingly important in facilitating mobility; however, mobility readiness differs across cultures (Teichler, Citation2015). The factors affecting mobility are diverse; for example, one of the factors hindering mobility is fear of the unknown (environment, changes, uncertainty) (Sánchez et al., Citation2006). Thus, cultural differences, such as the level of acceptance of uncertainty, may also influence mobility activities (Baluku et al., Citation2021). To measure national cultures, the Hofstede’s model is frequently used because the dimensions and country scores are validated and available for public use. Hofstede’s model has undergone various developments and currently contains six dimensions (Hofstede, Citation2011): power distance (the acceptance of unequal power distribution); uncertainty avoidance (the level of stress in a society in the face of an unknown future); individualism vs. collectivism (identity as an individual or as defined by a group); masculinity vs. femininity (the division of emotional roles among genders); long-term vs. short-term orientation (the choice of individual’s focus: the future or the present and past); and indulgence vs. restraint (gratification vs. control of basic human desires related to enjoying life). These dimensions indicate exactly how societies respond to fundamental social issues (Minkov & Hofstede, Citation2011); thus, they provide an opportunity to understand why individuals react to stimuli in specific patterns, such as individual mobility preferences. The present research examines how Hofstede’s dimensions affect mobility.
Crime as an aspect of student mobility research is examined as per the systematic literature review seen in Table . Crime is an important factor in tourism- and mobility-related research and frequently appears as a limiting variable (Biagi & Detotto, Citation2014) and as a general field of interest among mobility and tourism researchers (Hua et al., Citation2020).
The contributions of the literature are listed as follows:
The applied PRISMA method collects gravity and regression models for describing Erasmus exchange networks. These models are compared according to the considered independent variables, the unit of interest, and the research focus.
The influence of existing and new drivers, such as crime, collaboration and cultural aspects, are analyzed and compared by year and by scientific field for two units of interest, namely, on individual and NUTS3-regional levels.
By using econometric methods with the entire Erasmus exchange network, this study provides evidence in four areas of interest.
Q1
What should the unit of interest be?
Q2
Should static or temporal methods be used in gravity and regression models?
Q3
Should the entire network be analyzed, or should it be separated by scientific field?
Q4
What is the main group of variables influencing Erasmus exchange? Are these roles temporally stable and uniform in scientific fields?
3. Methods
3.1. Data employed
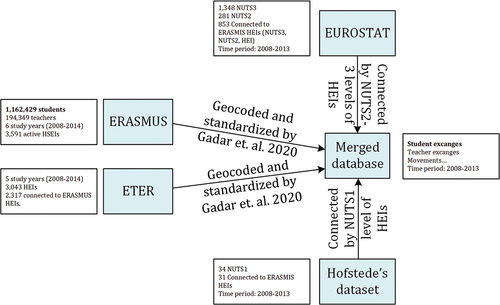
In this study, four main data sources are integrated: (1) ERASMUS, (2) ETER, (3) EUROSTAT, and (4) Hofstede's database of national cultures. All these data sources are freely available; however, most of them are not integrated. The ERASMUS data source contains data on exchanges for both students and teachers from 2008 to 2014. ETER (European Tertiary Register) contains the organizational and financial data of HEIs. The first two data sources were integrated and cleaned by (Gadár et al., Citation2020). These authors integrated other data sources that were not used in the current study, such as the global research identifier database GRID and the point of interest database POI by Google. HEIs are geocoded, and NUTS3 levels are added by (Gadár et al., Citation2020). Based on NUTS1–3 levels, Hofstade’s national culture database is connected to the country level (NUTS1), while economic indicators from EUROSTAT are connected to the NUTS2 and NUTS3 levels (see Figure ).
Figure 2. Applied data sources.
3.1.1. Applied data sources
The data collected from ERASMUS, EUROSTAT and Hofstede’s had to be refined to achieve a connected database structure, and the chosen common key was the NUTS3 location of the higher education institutions. The ERASMUS and ETER databases that were geocoded and standardized by Gadár et al. (Citation2020) provided the main data frame with the mobile students and the
mobile teachers from
HEIs from
to
. All of the mobility data of students and teachers could be used, since the EUROSTAT and Hofstede databases included more NUTS2–3 and NUTS1 data, respectively, than needed for the merging process. There were active HEIs in 853 out of the existing 1348 NUTS3 regions within the investigated time period. The NUTS1 regions were similar to the 34 regions present in Hofstede’s database 31 and were thus connected in the merged database. Although the data would also have made it possible to examine teachers mobility, their driving factors are completely different from those of the students, so we will analyze this in detail in later research.
4. Methods employed
In this study, multivariate analysis, such as the gravity model and random forest regression models, was used with the following variables (see Table ).
Denote the set of independent variables of location in year
as
, where
.
The following time-series fixed-effect gravity model was used for all subjects within the time period.
where is the number of Erasmus students travelling from location
to location
in year
,
are regression parameters,
is the independent variable for location
in year
, and
is the residual.
This gravity model was used for all subjects, all time periods, and each year. Since there were no zero values, the logarithmic version of EquationEquation (1)(1)
(1) was used in a regression model.
where is the residual of the linear regression model.
The linearized regression models have conditions, such as residuals should follow a normal distribution, and there is no heteroscedasticity or multicollinearity. In the case of a large dataset, where there are a large number of indicators, the main concern is multicollinearity (Panduro & Thorsen, Citation2014), which means that the “independent variables” are not truly independent from each other. More precisely, there are significant relationships among independent variables, which can distort the regression model. Multicollinearity is measured by a variance inflation factor (VIF) (Mansfield & Helms, Citation1982), which should be lower than 2.5. There are three main ways to handle multicollinearity: (1) Variables with high VIF coefficients should be dropped, but in this case, the information about these variables’ importance is also dropped. (2) Variables should be grouped via principal component analysis or a factor analysis; however, in this case, the reduced model also loses information. (3) We followed the third method, where in addition to regression models, robust methods, such as the random forest regression method (Sun et al., Citation2021), are used (Segal, Citation2004), as they are much less sensitive to multicollinearity than linear regression methods are (Sun et al., Citation2021).
In addition to the regression analyses, we used correlation-based network analyses to explore the relationships among the indicators. First, a correlation graph of the indicators is specified. In this correlation graph, the nodes represent the indicators, and the arcs represent the strength of the correlation between nodes (i.e., indicators). By the Leiden method (Traag et al., Citation2019), the modules are specified such that the nodes within a module have a stronger connection than do the nodes between two different modules. In addition, with a Force Atlas II algorithm (Jacomy et al., Citation2014), each node is arranged so the nodes with the greatest degree centrality were in the center of the modules. This situation allows us to analyze which indicators are related to most other variables.
5. Results
Table shows the estimated coefficients () and the relative importance values of indicators (
) from the source (host) (
) to the target (
) locations.
Table 3. Results of overall time-series gravity model
The institutional level of the gravity model produces a low value, while the NUTS3 level of the gravity model produces a greater
value. In this way, more significant indicators can be identified with the NUTS3 level of regression. The importance values of indicators in target and source regions show different patterns. All cultural indicators from the source location and all collaboration indicators to the target location are significant at the NUTS3 level. In addition, health and economic indicators, such as gross value added (GVA) and live births, are important and significant for both source and target regions.
Table shows that all common significant dependent variables regarding the institutional and NUTS3 levels, except the gross value added of the home institution () and the power distance of the country of the host institution (
), have the same sign.
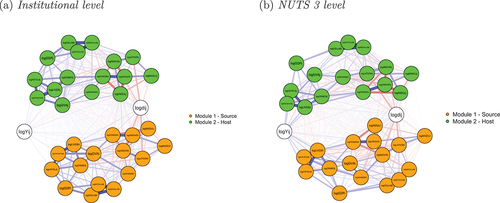
Figure shows a clustered correlation graph, where nodes are variables, and arcs represent the strength of the correlation. Blue arcs represent positive correlations, while red arcs represent negative correlations. The thickness of the arcs is proportional to the strength of the correlation. The clusters are done with Traag et al. (Citation2019)’s community detection method, where variables (i.e., nodes) within a module are more correlated than variables between modules.
Figure 3. Clustered correlation graph for NUTS3 and institutional levels.
5.1. Clustered correlation graph for NUTS3 and institutional levels
The correlation graph shows that three modules can be identified. The first module collects the source indicators, while the second module collects only the host-related indicators. Module 3 collects the output (number of exchanges) and the distances between the host and the source regions.
High internal correlation among some variables, such as cultural variables, indicates multicollinearity; however, we do not want to omit these variables from the model. Therefore, a robust method, the random forest method, is used to examine the relationships between dependent (mobility exchange) and independent variables. The random forest method is applied after providing a higher adj. ; see Tables A1-A3 in the Appendix.
Tables show the overall adjusted values by professions and years. Profession 9 is not specified; however, in this category, it is mainly the military institutes that are connected to each other.
Table 4. Overall by years and professions, institutional
Table 5. Overall by year and profession at the NUTS3 level
The highest overall is provided by profession 9, which fluctuates greatly over time. The lowest overall
is in the humanities and arts professions. In terms of the institutional level, the adjusted
is always greater if the data are separated by profession, while at the NUTS3 level, separation by professions does not increase the overall adjusted
. The fluctuation of
is characteristic of professionals; however, it is stable across time for all professions at both the institutional and NUTS3 levels. The results of Table suggest that at the institutional level, the professions have to be separated; however, generally, the annual regression does not increase the explanatory power of the model, while the total annual
is stable over time. The annual fluctuation in values by profession is explained by the small number of exchanges among institutions. Despite the institutional results of overall
, at the NUTS3 level, generally, the model fits better if exchanges are separated by both year and profession.
At the NUTS3 level, in addition to the unspecified profession (9), the social sciences (3), engineering (5), humanities (2), and computing sciences (4) have greater overall adjusted , while agriculture has a lower
.
Table shows only the relative importance values () and the estimated coefficients (
) of annual national cultural indicators at the institutional level.
Table 6. Impacts and coefficients of cultural indicators by year and by institution (2008–2013)
Notably, Table indicates the great total relative importance value of cultural indicators in every year, and both the relative importance value () and the estimated coefficients change over time. In addition, these values are different for the host and target institution.
Table 7. Impacts and coefficients of cultural indicators by year and by NUTS3 region (2008–2013)
Table . Most of the signs of the values are different for the nine study categories and the overall values as well. The behaviors are mostly similar across each year within these categories, with some notable exceptions. The exchanges in study category 2 (humanities and art) showed that the perceived threat of the unknown was similar between the institutions (
,
). Mobility within study category 5 (engineering, manufacturing, construction) showed that students came from institutions that allowed participation in decision making and went to institutions that offered a stricter, less participation-friendly environment (
,
). Study category 6 (agriculture, veterinary science) had a similar result to category 5 in terms of power distance. Category 7 (health, welfare) showed that students traveled from areas with similar long-term orientation prospects to their host region (
). Study category 8 (services (hotel, travel, hair, beauty)) showed that students came from institutions that allowed limited participation in decision making and went to institutions that offered a similar environment (
,
). Category 9 (unspecified) showed that students traveled from relatively strict institutions, just like those in category 8 (
,
). The international collaboration (
) data suggest that throughout the whole column, mobility was positively affected by such collaboration on both the host and home ends. However, the more collaboration projects an institution took part in (
), the less likely students and teachers from that institution were to be mobile.
Table 8. Impacts and coefficients of cultural indicators by profession and by institution
Tables shows the relative importance values and the estimated coefficients () of national cultural and collaboration indicators by profession on the NUTS3 level. The cultural indicators provide the most explanation in the institutional model. Both relative importance values and the estimated coefficients of indicators are significantly different for both target and source institutions and for each profession.
Table 9. Impacts and coefficients of cultural indicators by profession and by NUTS3 region
The threat from the unknown () chiefly affected the mobility in study category 1 (education), accounting for
of the relative (
). Study categories 3, 5, 6, and 8 showed similar results distinct from category 1. Exchanges within study category 2 (humanities and art) were mostly driven by (
). The mobility of study category 4 (science, math and computing) differed from that of study category 1, and the major pull variable is (
). Study category 7 (health, welfare) had the most diverse dispersion of relative (
) values across the cultural variables, with (
) being the largest pull variable. Study category 9 (unknown, not specified) showed modest dispersion with the lowest relative (
) score across the categories.
6. Discussion
This study focused on investigating a group of new variables, the 3Cs, influencing Erasmus exchanges. The findings did not confirm previous results, as other studies never investigated culture and crime, and collaboration was mentioned in only one case (Barrioluengo & Flisi, Citation2017). As seen in the clustered correlation graphs (Figure ) at both the NUTS3 and institutional levels and in both the host and home cases, clearly distinguishable groups can be found in terms of economic groups,(included crime), cultural groups and collaborative groups (Q4). The aggregated analysis of NUTS3-level and individual-level travel were important for determining whether these variables have as large of an effect on mobility as on the larger macro scale as they do on the micro scale (Q1). Examining the host aspect at both levels, there are some interesting results, such as a strong positive correlation between () and (
). In host countries with high power distance, the consequence of inequal power relations is accepted, so the government is a “patron” of citizens; furthermore, we can assume that security in the country is stronger, so there is less crime. Additionally, there is a positive correlation between (
) and (
) or (
). Both variables, the long-term orientation and the individualistic attitude, can facilitate industrial collaboration, which reflects the theory of collaborative individualism. The Erasmus network has a dominant culture of network organizations, as it emphasizes that individuals work together toward a common vision and mission in the long run (Limerick & Cunningham, Citation1993). The same variables appeared at both levels as determinants, showing that the division of the data-set into large chunks did not significantly alter the outcomes. The traditionally used variables showed less significance than previous studies suggested. Regarding crime at the NUTS3 level (Table ), for the host area, the
value is much higher than for the home area (3), which means that crimes are more important in the countries that people want to travel to. The collaboration-related variables from the ETER database affected the model as well, rather significantly, at the institutional level. The cultural variables added to the existing models and overall literature on the subject, creating new ways to approach the analysis of Erasmus exchanges. Arguably, the strongest pull variables for the institutional breakdown were the indulgence level (
) (
) and the long-term orientation attitude of the host institutions (
) (
). In indulgent countries, human needs and feelings are more likely to be gratified, freedom, emotional expression, and happiness are encouraged (Hofstede, Citation2011), which is why they can be more attractive societies to travel to. Moreover, in long-term orientated countries, people are more likely to invest in long-term social networks or interpersonal relations with acquaintances, which have long-term beneficial effects (Minkov & Hofstede, Citation2011). The strongest push variables are the masculinity and uncertainty avoidance of the home institutions (
,
) (
). Feminine values, such as cooperation, relationship orientation and the importance of quality of life, may support environmental integration abroad. Uncertainty avoidance is a society’s tolerance for uncertainty, which means that it must purposefully seek exchange, as uncertainty in mobility can be a major barrier.
As mentioned in the previous section, the NUTS3- and individual-level travel aggregated analysis was important for determining whether the cultural variables have as large an effect on mobility on a larger macro scale as they do on the micro scale. This group of variables better represents the data when the examined data are closer to the individual/institutional scale. Notably, the same variables appeared as determinants in both models, showing that the division of the data-set into large chunks did not significantly alter the outcomes. The traditionally used variables showed less significance than previous studies suggested. The cultural variables added to the existing models and overall literature on the subject, creating new ways to approach the analysis of Erasmus exchanges. The collaboration-related variables from the ETER database affected the model as well, rather significantly, at the institutional level. Arguably, the strongest pull variable for the institutional breakdown was the indulgence level of the host institutions (), the strongest push variables were the masculinity and uncertainty avoidance of the home institutions (
,
), and the strongest mooring variable for exchanges was the long-term orientation attitude of the host institutions (
).
The number of collaborations the home institutions engaged in positively affected the likelihood of mobility, suggesting that the inclusion of students in research positively alters their tendencies toward participation in research abroad. The density of habitation of the home institutions negatively affected the likelihood of mobility, meaning that people from very well-urbanized counties were less likely to participate in Erasmus. The individualism spectrum of home institutions shows that in countries where people are in close proximity, isolated groups are less likely to travel. The long-term orientation spectrum of the home institutions shows that those from countries where people generally value traditions and their cultures more were less likely to travel than those from other countries. The power distance spectrum of the host institutions country indicates that people are more likely to travel to places where power is relatively more evenly distributed among groups. The individualism spectrum of the host institutions country affects the long-term spectrum of the host institutions country. The number of collaborations of the home and host institutions positively affected the likelihood of mobility. The number of international collaborations of the home institutions positively affected the likelihood of mobility. The density of habitation of the home institutions negatively affected the likelihood of mobility, meaning that people from very urbanized counties were less likely to participate in Erasmus than those from less urbanized counties. The individualism spectrum of home institutions shows that in countries where people are in close proximity, isolated groups are less likely to travel.
Increasing the international mobility of European students is a key objective of the European Union. The 2009 Leuven DeclarationFootnote1 set the target that by 2020, at least 20% of graduates in the European Higher Education Area should have had experience studying abroad. Therefore, researchers have become increasingly interested in the last decade in studying students’ mobility, i.e. the factors that influence their choices. We reviewed the period following our research to check that our results for the 3Cs, as shown in more detail above, remain valid. Concerning the culture, consistent with our research findings, surveys conducted after 2013 continue to show that culture is one of the most important factors influencing students’ mobility (Bartha & Gubik, Citation2018; Holicza, Citation2018; Jamaludin et al., Citation2018). Bartha and Gubik (Citation2018) also identified uncertainty avoidance, long-term orientation, and indulgence level as significant cultural factors. Furthermore, Lesjak et al. (Citation2015) found that a combination of push and pull factors influence students’ willingness to study abroad. In the field of crime, their results indicated that one of the main characteristics of Erasmus destinations is to feel safe and secure, which confirms our findings that crime has emerged as an influencing factor. As regards the examination of collaboration indicators, to the best of our knowledge, no survey or research has been carried out; thus, we have no information on the evolution of the results.
7. Conclusion
The Erasmus mobility exchanges are widely studied. Although it is the largest formal and open student mobility program, relatively few studies examine the entire network. Because of the vast amount of rich and diverse data available on the subject, few examine the entire network; most research takes a slice of it or studies the network mostly based on surveys. Our paper identified three kinds of stakeholders who may be interested in the research results.
7.1. Implications for decision-makers in higher education
Our study highlighted that indicators such as culture and public safety, which have not been examined thus far or have been identified only through questionnaires, have fundamental impacts on mobility. Culture shock is already well studied in the literature; however, national cultural diversity as a driver of mobility exchange is first studied herein in terms of the entire Erasmus exchange network. The results reinforce the suggestion that students’ cultural differences should be taken into account not only after trips but also in terms of being a barrier to mobility before trips. International weeks, as well as presentations about other countries and customs, can be a method for learning about cultures.
7.2. Implications for policy makers
In addition to economic indicators of wealth, which are already considered in Erasmus fellowships, crimes (a proxy for public security) are one of the main deterrent indicators. The institution has less influence on public safety. At the same time, it must be seen that high crime may deter other travelers in addition to Erasmus exchange students.
7.3. Implications for scholars
Surveys usually examine individual participants’ responses. However, larger units are generally used when reviewing an entire network. For example, researchers should consider institutional or even regional relationships, as data can be assigned to such units. This paper showed that the roles of indicators in host and source regions are distinct and can be separated from each other. Although some indicators correlate with each other, which can decrease the value of adjusted , the proposed random forest method gave moderate
values for the entire network. In addition, time series analysis also shows that both the
coefficients and the adjusted
values are stable over time. Nevertheless, culture-, crime-, and collaboration-related indicators are diverse in different kinds of scientific fields; therefore, field-specific analyses are also relevant.
8. Limitations and future work
To the best of our knowledge, this is the first study to propose such a time-series gravity model for the Erasmus mobility exchange network. The model offers a moderately adjusted for the entire network. The new variables, such as crimes, collaboration, and national cultural-related indicators, seem to be relevant for modeling mobility exchange. In addition to considering new variables, all the field-specific analyses, the random forest methods employed and the consideration of NUTS 3 regions as a research unit increased the determinant coefficient (adj.
); however, the moderate value of
indicates that further indicators, which are currently unknown or have not been analyzed before, should also be employed. If the determinant value can be increased, not only the mobility exchange but also the formation of the Erasmus network can be analyzed. Erasmus travel has also been examined from a network science perspective; however, the social network analysis approach allows only descriptive research. We do not know, e.g., why a dominant role of a region or institution (measured by centrality) may have emerged. This question can be answered only if the two approaches are combined. However, it is essential to find better regression methods to answer this question.
Acknowledgement
Project no. K 142395 has been implemented with the support provided by the Ministry of Culture and Innovation of Hungary from the National Research, Development and Innovation Fund, financed under the K_22 „OTKA” funding scheme.
Disclosure statement
No potential conflict of interest was reported by the author(s).
Additional information
Funding
Notes on contributors

Zsolt T. Kosztyán
Zsolt T. KOSZTYÁN is a full professor at the University of Pannonia. His research interest focuses on the development of methodologies to manage complex management problems and systems relating to mathematical models and algorithms of project management, production, maintenance, and network science. This research area is positioned on the frontier between management science, applied informatics, and applied network science.
Dénes Kiss
Dénes KISS is a PhD student at the University of Pannonia. His main research interests focus on the topologies of dynamic and static economical and socioeconomical networks, specifically what drives these networks, as well as prediction-based modeling and its application in hydrogen and compressor industries.
Nóra Obermayer
Nóra OBERMAYER is a habil. associate professor at the University of Pannonia. She has taught a variety of management master courses, including Strategic Human Resource Management, Strategic Management, Intercultural Management, and Knowledge Management. Her research fields focus on knowledge management, social media, digitalization, and national cultures.
Notes
References
- Baluku, M. M., Groh, J., Dalbert, C., & Otto, K. (2021). Cultural differences in geographic mobility readiness among business management students in Germany and Spain ahead of graduation. SN Social Sciences, 1(7), 1–30. https://doi.org/10.1007/s43545-021-00171-0
- Barrioluengo, M. S., & Flisi, S. (2017). Student mobility in tertiary education: Institutional factors and regional attractiveness. Publications Office of the European Union. https://doi.org/10.2760/675338
- Bartha, Z., & Gubik, A. S. (2018). Institutional determinants of higher education students’ international mobility within the Erasmus programme countries. Theory, Methodology, Practice-Review of Business and Management, 14(2), 3–13. https://doi.org/10.18096/tmp.2018.02.01
- Beech, S. E. (2018). Adapting to change in the higher education system: International student mobility as a migration industry. Journal of Ethnic and Migration Studies, 44(4), 610–625. https://doi.org/10.1080/1369183X.2017.1315515
- Bernasco, W., Lammers, M., & van der Beek, K. (2016). Cross-border crime patterns unveiled by exchange of DNA profiles in the European union. Security Journal, 29(4), 640–660. https://doi.org/10.1057/sj.2015.27
- Biagi, B., & Detotto, C. (2014). Crime as tourism externality. Regional Studies, 48(4), 693–709. https://doi.org/10.1080/00343404.2011.649005
- Breznik, K., & Gologranc, G. (2014). Erasmus mobility on the institutional level. In International Conference “Management, Knowledge and Learning”, Portorož, Slovenia (pp. 1361–1366). https://EconPapers.repec.org/RePEc:tkp:mklp14:1361-1366
- Camiciottoli, B. C. (2010). Meeting the challenges of European student mobility: Preparing Italian Erasmus students for business lectures in english. English for Specific Purposes, 29(4), 268–280. https://doi.org/10.1016/j.esp.2010.01.001
- Derzsi, A., Derzsy, N., Káptalan, E., & Néda, Z. (2011). Topology of the Erasmus student mobility network. Physica A: Statistical Mechanics and Its Applications, 390(13), 2601–2610. https://doi.org/10.1016/j.physa.2011.02.041
- Engel, C. (2010). Die Auswirkungen der Erasmus-Mobilität auf die berufliche Entwicklung : empirische Ergebnisse internationaler Studien über temporäre Mobilität von Studierenden und Lehrenden. Belgeo Revue belge de géographie, 4(4), 351–363. https://doi.org/10.4000/belgeo.6399
- Gadár, L., Kosztyán, Z. T., Telcs, A., & Abonyi, J. (2020). A multilayer and spatial description of the Erasmus mobility network. Scientific Data, 7(1), 41. https://doi.org/10.1038/s41597-020-0382-1
- Glass, C. R., & Cruz, N. I. (2023). Moving towards multipolarity: Shifts in the core-periphery structure of international student mobility and world rankings (2000–2019). Higher Education, 85(2), 415–435. https://doi.org/10.1007/s10734-022-00841-9
- Golubeva, I., Gómez Parra, M. E., & Espejo Mohedano, R. (2018). What does ‘active citizenship’mean for Erasmus students? Intercultural Education, 29(1), 40–58. https://doi.org/10.1080/14675986.2017.1404741
- Healey, N. M. (2008). Is higher education in really ‘internationalising’? Higher Education, 55(3), 333–355. https://doi.org/10.1007/s10734-007-9058-4
- Hofstede, G. (2011). Dimensionalizing cultures: The Hofstede model in context. Online Readings in Psychology & Culture, 2(1), 2307–2919. https://doi.org/10.9707/2307-0919.1014
- Holicza, P. (2018). The cultural effects of international student mobility: Russian millennials. Bulletin of Science and Practice, 4(11), 424–432. https://cyberleninka.ru/article/n/the-cultural-effects-of-international-student-mobility-russian-millennials
- Hua, N., Li, B., & Zhang, T. C. (2020). Crime research in hospitality and tourism. International Journal of Contemporary Hospitality Management, 32(3), 1299–1323. https://doi.org/10.1108/IJCHM-09-2019-0750
- Jacomy, M., Venturini, T., Heymann, S., Bastian, M., & Muldoon, M. R. (2014). Forceatlas2, a continuous graph layout algorithm for handy network visualization designed for the gephi software. Plos One, 9(6), 1–12. https://doi.org/10.1371/journal.pone.0098679
- Jamaludin, N. L., Sam, D. L., & Sandal, G. M. (2018). Destination motivation, cultural orientation, and adaptation: International students’ destination-loyalty intention. Journal of International Students, 8(1), 38–65. https://doi.org/10.32674/jis.v8i1.151
- Jansen, D., & Schuwer, R. (2015). Institutional MOOC strategies in Europe. Status Report Based on a Mapping Survey Conducted in October-December 2014.
- Kabanbayeva, G., Gureva, M., Bielik, P., & Ostasz, G. (2019). Academic mobility and financial stability: A case of Erasmus student exchange program. Journal of International Studies, 12(1), 324–337. https://doi.org/10.14254/2071-
- Lesjak, M., Juvan, E., Ineson, E. M., Yap, M. H., & Axelsson, E. P. (2015). Erasmus student motivation: Why and where to go? Higher Education, 70(5), 845–865. https://doi.org/10.1007/s10734-015-9871-0
- Lewer, J. J., & Van den Berg, H. (2008). A gravity model of immigration. Economics Letters, 99(1), 164–167. https://doi.org/10.1016/j.econlet.2007.06.019
- Liberati, A., Altman, D. G., Tetzlaff, J., Mulrow, C., Gøtzsche, P. C., Ioannidis, J. P., Clarke, M., Devereaux, P. J., Kleijnen, J., & Moher, D. (2009). The prisma statement for reporting systematic reviews and meta-analyses of studies that evaluate health care interventions: Explanation and elaboration. Journal of Clinical Epidemiology, 62(10), e1–e34. https://doi.org/10.1016/j.jclinepi.2009.06.006
- Limerick, D., & Cunnington, B. (1993). Managing the New Organisation: A Blueprint for Networks and Strategic Alliances. Business and Professional Publications.
- Llanes, À., Tragant, E., & Serrano, R. (2012). The role of individual differences in a study abroad experience: The case of Erasmus students. International Journal of Multilingualism, 9(3), 318–342. https://doi.org/10.1080/14790718.2011.620614
- Maggioni, M. A., & Uberti, T. E. (2009). Knowledge networks across Europe: Which distance matters? The Annals of Regional Science, 43(3), 691–720. https://doi.org/10.1007/s00168-008-0254-7
- Mansfield, E. R., & Helms, B. P. (1982). Detecting multicollinearity. The American Statistician, 36(3a), 158–160. https://doi.org/10.1080/00031305.1982.10482818
- Minkov, M., & Hofstede, G. (2011). The evolution of hofstede’s doctrine. Cross Cultural Management: An International Journal. https://doi.org/10.1108/13527601111104269
- Nada, C. I., & Legutko, J. (2022). “Maybe we did not learn that much academically, but we learn more from experience”–Erasmus mobility and its potential for transformative learning. International Journal of Intercultural Relations, 87, 183–192. https://doi.org/10.1016/j.ijintrel.2022.03.002
- Natkhov, T., & Polishchuk, L. (2019). Quality of institutions and the allocation of talent: Cross-national evidence. Kyklos, 72(4), 527–569. https://doi.org/10.1111/kykl.12211
- Neckerman, K. M., Carter, P., & Lee, J. (1999). Segmented assimilation and minority cultures of mobility. Ethnic and Racial Studies, 22(6), 945–965. https://doi.org/10.1080/014198799329198
- Orr, D., Gwosc, C., & Netz, N. (2011). Social and economic conditions of student life in Europe: Synopsis of indicators-final report-eurostudent iv 2008-2011. W. Bertelsmann Verlag. https://doi.org/10.3278/6001920aw
- Otero, M. S. (2008). The socio-economic background of Erasmus students: A trend towards wider inclusion? International Review of Education, 54(2), 135–154. https://doi.org/10.1007/s11159-007-9081-9
- Panduro, T. E., & Thorsen, B. J. (2014). Evaluating two model reduction approaches for large scale hedonic models sensitive to omitted variables and multicollinearity. Letters in Spatial and Resource Sciences, 7(2), 85–102. https://doi.org/10.1007/s12076-013-0103-x
- Paré, G., Trudel, M.-C., Jaana, M., & Kitsiou, S. (2015). Synthesizing information systems knowledge: A typology of literature reviews. Information & Management, 52(2), 183–199. https://doi.org/10.1016/j.im.2014.08.008
- Rivza, B., & Teichler, U. (2007). The changing role of student mobility. Higher Education Policy, 20(4), 457–475. https://doi.org/10.1057/palgrave.hep.8300163
- Rodrıéguez González, C., Bustillo Mesanza, R., & Mariel, P. (2011). The determinants of international student mobility flows: An empirical study on the Erasmus programme. Higher Education, 62(4), 413–430. https://doi.org/10.1007/s10734-010-9396-5
- Rodrıéguez, X. A., Martıénez-Roget, F., & Pawlowska, E. (2012). Academic tourism demand in Galicia, Spain. Tourism Management, 33(6), 1583–1590. https://doi.org/10.1016/j.tourman.2012.01.010
- Ryba, R. (1995). Unity in diversity: The enigma of the European dimension in education. Oxford Review of Education, 21(1), 25–36. https://doi.org/10.1080/0305498950210102
- Sánchez, C. M., Fornerino, M., & Zhang, M. (2006). Motivations and the intent to study abroad among u.S., French, and Chinese students. Journal of Teaching in International Business, 18(1), 27–52. https://doi.org/10.1300/J066v18n01_03
- Savić, M., Ivanović, M., Putnik, Z., Tütüncü, K., Budimac, Z., Smrikarova, S., & Smrikarov, A. (2017). Analysis of Erasmus staff and student mobility network within a big European project. 2017 40th International Convention on Information and Communication Technology, Electronics and Microelectronics (MIPRO), 613–618. https://doi.org/10.23919/MIPRO.2017.7973498
- Segal, M. R. (2004). Machine learning benchmarks and random forest regression. https://escholarship.org/uc/item/35x3v9t4
- Seliverstov, V. (2012). Regional monitoring: Information management framework for regional policy and strategic planning. Regional Research of Russia, 2(1), 60–73. https://doi.org/10.1134/S2079970512010108
- Senci, V., Hendrickson, B., & Debevc, M. (2022). Examining Erasmus student social integration at two Croatian universities. International Journal of Intercultural Relations, 90, 57–72. https://doi.org/10.1016/j.ijintrel.2022.07.007
- Sigalas, E. (2010a). Cross-border mobility and European identity: The effectiveness of intergroup contact during the Erasmus year abroad. European Union Politics, 11(2), 241–265. https://doi.org/10.1177/1465116510363656
- Sigalas, E. (2010b). The role of personal benefits in public support for the eu: Learning from the Erasmus students. West European Politics, 33(6), 1341–1361. https://doi.org/10.1080/01402382.2010.508912
- Snyder, H. (2019). Literature review as a research methodology: An overview and guidelines. Journal of Business Research, 104, 333–339. https://doi.org/10.1016/j.jbusres.2019.07.039
- Souto-Otero, M., Huisman, J., Beerkens, M., De Wit, H., & Vujić, S. (2013). Barriers to international student mobility: Evidence from the Erasmus program. Educational Researcher, 42(2), 70–77. https://doi.org/10.3102/0013189X12466696
- Sung, C. C. M. (2022). Identity conflicts and negotiations: Narratives of asian international students’ experiences in hong kong. Journal of Intercultural Studies, 43(5), 639–656. https://doi.org/10.1080/07256868.2022.2063818
- Sun, D., Xu, J., Wen, H., & Wang, D. (2021). Assessment of landslide susceptibility mapping based on bayesian hyperparameter optimization: A comparison between logistic regression and random forest. Engineering Geology, 281, 105972. https://doi.org/10.1016/j.enggeo.2020.105972
- Teichler, U. (1991). Experiences of Erasmus students. Wissenschaftliches Zentrum für Berufs-und Hochschulforschung der Gesamthochschule Kassel.
- Teichler, U. (1996). Comparative higher education: Potentials and limits. Higher Education, 32(4), 431–465. https://doi.org/10.1007/BF00133257
- Teichler, U. (2004). Temporary study abroad: The life of Erasmus students. European Journal of Education, 39(4), 395–408. https://doi.org/10.1111/j.1465-3435.2004.00193.x
- Teichler, U. (2015). Academic mobility and migration: What we know and what we do not know. European Review, 23(S1), S6–S37. https://doi.org/10.1017/S1062798714000787
- Teichler, U. (2017). Internationalisation trends in higher education and the changing role of international student mobility. Journal of International Mobility, N° 5(1), 177–216. https://doi.org/10.3917/jim.005.0179
- Traag, V. A., Waltman, L., & van Eck, N. J. (2019). From Louvain to Leiden: Guaranteeing well-connected communities. Scientific Reports, 9(1), 5233. https://doi.org/10.1038/s41598-019-41695-z
- Van Mol, C., & Michielsen, J. (2015). The reconstruction of a social network abroad. An analysis of the interaction patterns of Erasmus students. Mobilities, 10(3), 423–444. https://doi.org/10.1080/17450101.2013.874837
- Verbik, L., & Lasanowski, V. (2007). International student mobility: Patterns and trends. World Education News and Reviews, 20(10), 1–16.
- Watts, A. G., Sultana, R. G., & McCarthy, J. (2010). The involvement of the European Union in career guidance policy: A brief history. International Journal for Educational and Vocational Guidance, 10(2), 89–107. https://doi.org/10.1007/s10775-010-9177-9
Appendix
Table A1. Random forest regression
Table A2. Evaluation metrics
Table A3. Variable importance