
 ?Mathematical formulae have been encoded as MathML and are displayed in this HTML version using MathJax in order to improve their display. Uncheck the box to turn MathJax off. This feature requires Javascript. Click on a formula to zoom.
Abstract
This study examines households’ resilience to climate change and food insecurity in Ethiopia. The study was conducted in the Wolaita zone of the Southern Nations, Nationalities and Peoples Region (SNNPR). The article measured the resilience levels of Productive Safety Net Program (PSNP) beneficiary households against non-beneficiaries as a control group using Resilience Index Measurement and Analysis (RIMA). A random sample of 300 respondents were selected from the population of safety net beneficiary and non-beneficiary households in the study area each representing half of the sample. The study found that non-PSNP households have higher monthly per capita food expenditure than PSNP members, with a difference of 30%, indicating that they have better access to economic resources and opportunities. Additionally, non-PSNP households have higher resilience scores than PSNP members, with a difference of almost 0.1 point. The findings suggest that improving resilience through interventions such as asset-building, livelihood diversification, or social protection may have positive spillover effects on household food security and nutrition outcomes if targeted properly. The study also revealed important insights into the characteristics of households in the study area, including the prevalence of poverty and vulnerability, limited opportunities for non-farm employment, and high illiteracy rates, which have implications for policies aimed at reducing poverty and promoting sustainable livelihoods in rural areas of Ethiopia.
PUBLIC INTEREST STATEMENT
In this research paper, we dive into the fascinating connection between income, dietary diversity, and resilience among beneficiaries of the Productive Safety Net Program (PSNP) in rural Ethiopia. PSNP aims to enhance food security and reduce poverty by providing cash or food transfers to vulnerable households. Our study delves into how resilience, the ability to bounce back from economic shocks, mediates the relationship between income and dietary diversity.
Examining the impact of PSNP on households’ ability to diversify their diets is essential for understanding the effectiveness of such social protection programs. By uncovering the role of resilience in this relationship, we shed light on the pathways that contribute to improved food security and poverty reduction. This research carries broader significance for the public, as it addresses critical issues like sustainable development, poverty eradication, and ensuring access to nutritious food for vulnerable populations in Ethiopia and beyond.
1. Introduction
Ethiopia, with a mere 0.5% contribution to global greenhouse gas emissions, is one of the countries at the most extreme risk of climate change, ranked 162 out of 182 countries (UNDP, Citation2020). The effects of climate change are already visible, with water scarcity, changes in rainfall patterns, frequent floods, landslides, and droughts induced by La Niña causing immense damage to agriculture, livestock, forests, water resources, biodiversity, health, infrastructure, and tourism. These sectors require intensive climate-smart adaptation interventions to mitigate the negative impacts of climate change (Food and Agriculture Organization of the United Nations FAO, Citation2012).
Ethiopia is currently facing an escalation in the frequency and severity of droughts, floods, and extreme weather events, which are negatively impacting agricultural productivity, food security, and income. These challenges primarily affect regions already vulnerable to droughts, one of which being the SNNPR. In 2019, the country experienced irregular rainfall, leading to water and pasture shortages and worsening food and nutrition insecurity for pastoral and agro-pastoral communities. Livelihoods in the agriculture and livestock sectors were particularly affected. Additionally, delayed and erratic rainfall in the mid- and highlands disrupted crop production and farmers’ incomes. In 2020, Ethiopia endured the worst drought in four decades, mainly affecting the southern and eastern parts of the country. This resulted in a significant increase in the number of people requiring humanitarian assistance, reaching 8.4 million in 2020, 23.5 million in 2021, and further escalating to 29 million in 2022. These challenges have been compounded by multiple shocks, such as desert locust infestations, conflict, disease outbreaks (including the COVID-19 pandemic), and resulted in approximately 5.1 million internally displaced persons (IDPs) in 2021. This crisis demands immediate humanitarian assistance and comprehensive protection for affected populations, including the returnee migrants and returning IDPs (FAO, Citation2012; UNDP, Citation2020).
Ethiopia’s Crisis Response Plan of 2023 revealed that in 2022, more than 8 million people were acutely food insecure. In the same year, 3.5 million livestock died, and 1.8 million people were displaced from the drought-affected regions (Oromia, Somali and Afar), which make up three-quarters of the total land area of the country.Footnote1 To address these impacts and promote sustainable livelihoods, it is crucial to enhance households’ resilience. Resilience refers to the ability of households to adapt and cope with climate change-induced shocks and stresses while maintaining their livelihoods and well-being (FAO, Citation2012).
The foregoing paragraphs reveal that Ethiopia’s vulnerability to climate change has far-reaching consequences for the country’s economy and the well-being of its people. The negative impacts of climate change on agriculture, livestock, forests, water resources, biodiversity, health, infrastructure, and tourism require urgent and intensive climate-smart adaptation interventions. Moreover, enhancing households’ resilience is vital to promoting sustainable livelihoods and mitigating the negative impacts of climate change on the most vulnerable communities in the country. In turn, building resilience requires understanding the factors that contribute to households’ resilience levels, such as access to resources, social networks, and institutions that support adaptation and coping strategies (Wurzel et al., Citation2020).
The government of Ethiopia together with donors has been implementing Productive Safety Net Program to build resilience of households. One of the ways in which PSNP (which began in 2005) could enhance resilience of households in Ethiopia is by increasing their purchasing power. The cash transfers provided by the program would enable households to buy more food and other essential items, which in turn helps to improve their overall well-being. The program also provides a safety net for households in times of crisis, such as droughts or floods, which can have a devastating impact on food security in rural areas. Another way in which PSNP could improve resilience is by promoting productive activities. The program provides support for small-scale agriculture, such as the provision of seeds and tools, which enables households to grow their own food and become more self-sufficient. This is particularly important in areas where agriculture is the main source of livelihood, as it helps to build resilience against shocks and improve long-term food security.
Several studies have been conducted on the measurement of resilience and food security globally. For instance, Upton et al. (Citation2016) proposed an empirical strategy to measure food security using panel data from Kenya and a set of axioms based on the internationally agreed 1996 FAO’s definition. However, few studies have measured households’ resilience levels in Ethiopia and considered resilience components, limiting the development of effective policy interventions aimed at building resilience and promoting sustainable livelihoods (Wurzel et al., Citation2020). Ayal et al. (Citation2020) studied the impact of climate change and stated that Ethiopia’s agricultural productivity is constrained by climate change impacts, limited access to irrigation, and poor soil quality. According to a study by Adgo et al. (Citation2021), Ethiopia is facing a significant threat to the livelihoods of rural communities due to climate change. Another study in Ethiopia. Cissé and Barrett (Citation2018) introduced an econometric strategy to estimate resilience using panel data. Based on data on self-insurance behavior of pastoralists in Kenya, they proposed a theory-based approach to estimating a decomposable development resilience at the micro-level. They suggested that the method has a potential to help target interventions for resilience-building.
In their study, Knippenberg and Hoddinott (Citation2019) not only focused on the effects of Ethiopia’s Productive Safety Net Program (PSNP) on household food security, but also highlighted the program’s long-term impact on the consequences of drought. The study revealed that drought shocks significantly reduced the duration of time that households considered themselves food secure. Furthermore, these adverse effects persisted for a considerable period of up to four years even after the drought had ended. However, the researchers provided evidence that the receipt of PSNP payments played a crucial role in mitigating the initial impact of drought shocks.
Delving into the dynamics of resilience, Kebede et al. (Citation2016) established asset holding as a cornerstone of smallholder farmers’ ability to withstand challenges and maintain their overall wellbeing. Furthermore, Fikru et al. (Citation2023) examined the correlation between external assistance and resilience, revealing a noteworthy positive association. However, there is a gap in the literature regarding the specific contributions of the PSNP program to these resilience-building factors.
Following Cissé and Barrett (Citation2018), Abay and Abay (Citation2022), studied the impact of productive safety net program in Ethiopia on resilience level of households employing a probabilistic moment-based approach on a panel data of five rounds. They concluded that the productive safety net program is associated with high level of resilience. However, they were not certain whether safety nets with small transfers over a short time horizon offer significant contribution to resilience building suggesting a room for further studies suggesting that a comprehensive analysis of the PSNP’s influence on overall household-level resilience remains limited. This proposed research, therefore, seeks to address this gap by investigating the extent to which the PSNP program contributes to the enhancement of household-level resilience among smallholder farmers in Ethiopia. By examining the impact of PSNP interventions on various dimensions of resilience, including asset holding, income diversification, agricultural production, and social capital, this study aims to provide evidence-based insights into the effectiveness of the program in bolstering the resilience of vulnerable households. Against this backdrop, the objectives of this article are twofold: first, to measure the resilience levels of households, and second, to investigate the mediating role of resilience in consumption expenditure and household dietary diversity.
2. Description of the study area, data and methods
2.1. Background of study area
Wolaita Zone is a zone located in the southern part of Ethiopia, within the Southern Nations, Nationalities, and Peoples’ Region (SNNPR). The zone covers an area of approximately 4,500 square kilometers. Based on the 2021 population projection conducted by the Central Statistical Agency of Ethiopia (CSA), the zone has a total population of 6,142,063 (in an area of 4,208.64 square kilometres (1,624.96 sq mi)). Out of the total population of the zone, females make up 3,115,050, whereas males count 3,027,013. The zone is bordered by the Oromia Region to the north, the Sidama Zone to the east, the Gamo Gofa Zone to the south, and the Hadiya Zone to the west. The main town and administrative center of the zone is Sodo, which is also the capital of the SNNPR. The economy of Wolaita Zone is primarily based on agriculture, with coffee, maize, teff, and beans being the main crops grown in the area. Livestock rearing is also an important source of income for many households. The zone is rich in natural resources, including gold, which is mined in the area.
Wolaita Zone has been affected by drought and food insecurity in recent years, leading to the implementation of safety net programs to support vulnerable households. The Productive Safety Net Program (PSNP) is one such program that has been implemented in the area. The PSNP is a social protection program that provides cash or food transfers to households in exchange for participation in public works projects or community service activities. The program aims to improve food security, reduce poverty, and build resilience to shocks such as drought.
In the Wolaita Zone, the PSNP has been implemented since 2005 and has supported thousands of households in the area. As per the new PSNP5 design document, The program has been successful in reducing food insecurity and poverty among participating households, and has also contributed to the development of infrastructure such as roads, water supply systems, and schools (MOA, Citation2020). Despite the success of the PSNP, Wolaita Zone still faces challenges related to drought and climate change. The area is prone to droughts, which can have devastating effects on the local economy and food security. In recent years, the government and development partners have worked to improve drought resilience in the area through measures such as promoting climate-smart agriculture, improving water management, and investing in early warning systems for droughts. In addition to the PSNP, other programs and initiatives have been implemented in the area to support vulnerable households during times of drought and food insecurity. For example, the World Food Programme has implemented a food assistance program in the Wolaita Zone to support households affected by drought and other shocks.
2.2. Data and methods
Following Conroy (Citation2018) and Goldsmith (Citation1968) using 5% level of precision, 300 respondents were randomly selected from the population of safety net and non-beneficiaries in the study area. Out of the 300 respondents, 150 were selected as the treatment group, who were beneficiaries of the safety net program. The remaining 150 respondents were selected as the control group, who were not beneficiaries of the program. The list of beneficiaries and those in the waiting list obtained from the PSNP coordinators served as a sampling frame. A systematic random sampling procedure was followed to reach out to each respondent with the help of local coordinators. The methodology used to analyze this data has been involved several steps. Firstly, the data was reviewed and assessed to ensure that it is relevant and of good quality. This was involved examining the variables and indicators used in the data collection process, as well as assessing the methods used to collect and analyze the data.
The Resilience Index Model Analysis (RIMA) was used to assess the impact of Productive Safety Net Programs (PSNPs) on building household resilience through further impacting income and food security. RIMA is a statistical analysis method used to evaluate the ability of households to cope with and recover from shocks and stresses.
The concept of resilience is indeed better understood in a dynamic scenario where changes and progress of households can be observed over time. However, it is also possible to conduct a non-dynamic analysis of resilience when the objective is prediction and a snapshot of resilience at a particular point in time. Cross-sectional data can be used for predictive purposes, such as in the case of studies that have used machine learning techniques to predict household resilience, as demonstrated by Garbero and Letta (Citation2022).
While cross-sectional resilience analysis may not provide a trajectory of the studied variables, it can still be useful for predictive purposes. For example, the RIMA II methodology has been used to predict the Resilience Capacity Index (RCI) of households based on cross-sectional data, as seen in studies by Sibrian et al. (Citation2021) and FAO (Citation2016; Citation2021). The RCI is used to rank households from most to least resilient for targeting purposes, and the RIMA II methodology is an ex-ante indicator of households’ intrinsic ability to recover from future shocks (FAO, Citation2020). Therefore, cross-sectional data can be employed to measure resilience capacity for predictive purposes, which can be used for future analysis of shock resistance. While a dynamic analysis may provide a more comprehensive understanding of resilience, cross-sectional analysis can still provide valuable insights for predictive purposes.
RIMA II, or the Resilience Index Measurement and Analysis II, is a latent variable model that aims to measure and analyze resilience in households. It assumes that the observed variables, such as per capita food expenditure and Household Dietary Diversity Score (HDD), are manifestations of an underlying unobserved latent concept, which is resilience. Additionally, RIMA II considers that other variables, known as correlates, construct and influence the latent factors, creating a reciprocal effect (FAO, Citation2016).
The most commonly used format for estimating RIMA II involves a two-step procedure. First, a factor analysis is performed using indicators for the four RIMA pillars. These observable indicators are assigned to each of the RIMA pillars in the factor analysis. The goal of the factor analysis is to explain at least 96 percent of the sample covariance, which helps identify the underlying latent factors related to resilience. In the second step, a Resilience Capacity Index is created using the output of the factor analysis. This is done through a Multiple Indicators Multiple Causes (MIMIC) model, which is a type of structural equation model (SEM). The MIMIC model consists of two components: the SEM and the measurement model. In the SEM component, the observed variables (such as per capita food expenditure and HDD) are considered causes of resilience as a latent variable. This means that these variables are believed to influence the level of resilience in households. The measurement model component treats the observed variables as indicators of resilience. In this case, a reference unit is required, which is a variable assumed to be affected by a household’s resilience. This reference unit is commonly associated with well-being-related metrics. By combining the SEM and measurement model, the MIMIC model allows for the creation of a single unit of resilience for a household along a scale of 0 (lowest resilience) to 1 (highest resilience). This is achieved using a min-max normalization procedure, which standardizes the values of the indicators to fit within the desired range. The equation for the structural model is given by (FAO, Citation2016):
Causal coefficients abs,
ast,
ssn, and
ac are four critical determinants for resilience to food and nutrition insecurity, and disturbance of RCI is
RCI.
While the two food security indicators are modelled in the measurement part of the SEM as follows:
The αFE coefficient is scaled by setting it to 1 so that one standard deviation increase in RCI implies an increase of one standard deviation in Food expenditure. The unit of measure of coefficients for other indicators (coefficient αHDDS and variance) is determined by the scaling and is zero for var (FE) and var (HDDS). Measurement errors of FE and HDDS are FE and
HDDS, respectively.
Overall, RIMA II provides a framework for measuring and analyzing resilience in households by considering the underlying latent factors and their influences. By using a combination of factor analysis and a MIMIC model, it allows for the creation of a Resilience Capacity Index that can help assess and compare the resilience levels of different households.
The RIMA model involves the use of a set of resilience indicators that measure the economic, social, and environmental factors that affect household resilience. These indicators include income, employment, access to education and healthcare, and exposure to natural disasters. The conceptual framework involving these variables under RIMA-II is schematically depicted in Figure .
Figure 1. Resilience conceptual framework (FAO, Citation2016).
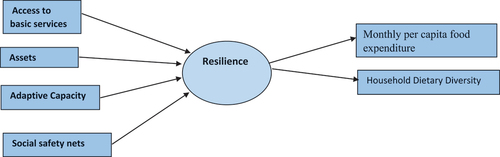
As depicted in Figure , the resilience of households is determined by various critical factors, including access to basic services, assets, social safety nets, and adaptive capacity (FAO, Citation2018). These elements are essential in helping households withstand and recover from shocks, such as economic downturns, natural disasters, or pandemics. When households face such shocks, interventions become necessary to help them become more resilient. These interventions must be based on the principles of strengthening diversity, rebuilding local institutions and traditional support systems, reinforcing local knowledge, and building on household ability to adapt and reorganize (Pingali et al., Citation2005).
To enhance the resilience of households, it is crucial to ensure they have access to basic services such as healthcare, education, and clean water. Access to these services can improve the health and well-being of households, reduce their vulnerability to shocks, and help them cope better during difficult times (World Bank, Citation2019).
Furthermore, assets such as land, livestock, and financial resources are critical in enhancing the resilience of households. These assets can help households generate income, build financial reserves, and cope with economic shocks (Carter & Barrett, Citation2006). Social safety nets such as cash transfers, food subsidies, and social insurance programs can also help households overcome the adverse effects of shocks (UNDP, Citation2014).
Adaptive capacity is another essential factor that determines the resilience of households. Adaptive capacity refers to the ability of households to adjust their behaviors and strategies to cope with changing circumstances. This includes the ability to adopt new technologies, diversify income sources, and build social networks that can provide support during difficult times (Adger et al., Citation2005). In sum, enhancing the resilience of households is critical in promoting their well-being and reducing their vulnerability to shocks. By strengthening access to basic services, assets, social safety nets, and adaptive capacity, households can better cope with unexpected shocks and recover more quickly from difficult situations.
The resilience index (RCI) constructed using the two-step procedure indicated above is the outcome variable with fractional values between zero and one. Several analysis methods are used to model such data. The most popular model, linear regression, assumes that errors have a normal distribution and have an equal variance. However, our outcome variable (resilience index) contains fractional values that do not meet the normality assumption. The validity of employing linear regression to model such data would be questioned in the absence of normal distribution of residuals (Schmid et al., Citation2013) and complex to interpret the result (Fang et al., Citation2019). Further, in such a case, the linear regression model does not account for the bounded nature of the outcome variable (Kieschnick & McCullough, Citation2003).
Therefore, looking for another approach that is suitable for fractional data is critical to fix the estimation bias related to linear regression. As proposed by Papke and Wooldridge (Citation1996), fractional regression is used to analyze dependent variables described in a unit interval [0 1]. While beta regression deals with outcome variables in the range of zero and one (0 1) (Ferrari & Cribari-Neto, Citation2004; Smithson & Verkuilen, Citation2006).
Our response variable resilience (RCI) is measured continuously and restricted to unit interval (0,1), the response of RCI∈(0,1), and follows beta density. Based on Ferrari and Cribari-Neto (Citation2004), we specified beta density of RCI as follows:
Where, θ ∈(0,1) is the mean of RCI, α > 0is a precision parameter and γ(.) is a gamma function. The variance of RCI is given by var(RCI)=(θ(1-θ))⁄((1+α)). RCI is a dependent variable where each 〖RCI〗_(i,) i = 1 … .n. Beta density accommodates several shapes depending on the parameters (Cribari-Neto & Zeileis, Citation2010; Ferrari & Cribari-Neto, Citation2004). Following the beta density described in equation (4) with mean θ_i and unknown precision α, the beta regression model for resilience capacity looks like:
Where, g(θ_i) is strictly monotonic and twice differentiable link function that maps (0,1) β is the coefficient of the j^th covariate and x_ij is the explanatory variables of household i, which are assumed fixed and known. Hence, beta distribution provides a very adaptable approach for modelling fractional data bounded in zero and one. Therefore, our outcome variable Resilience Capacity Index (RCI) is defined by fractions greater than zero and less than one, beta regression best suits to model our data.
The description of the variables that constitute household resilience is provided in Table , which includes access to basic services, assets, social safety nets, and adaptive capacity. FAO (Citation2018) defines Access to Basic Services as the ability of a household to fulfill its fundamental needs by accessing and effectively utilizing basic services such as schools, healthcare facilities, infrastructure, and markets. Adaptive Capacity, on the other hand, refers to a household’s ability to adapt to new circumstances and develop alternative livelihood strategies. The Social Safety Nets pillar assesses a household’s capacity to obtain support from various sources, including relatives, friends, government, and timely assistance from international agencies, charities, and NGOs. Assets comprise both productive and non-productive assets. Productive assets are crucial for households to generate consumable or tradable goods, and examples of such assets include land, livestock, and durable goods. Context-specific sets of productive assets are evaluated based on their ability to generate household income. Tangible non-productive assets, such as housing, vehicles, and household amenities, reflect a household’s standard of living and wealth.
Table 1. Indicators of resilience
2.3. Ethical consideration
All participants in the study gave their informed consent, and they were informed of the study’s purpose and objectives before agreeing to participate. Consent was obtained from participants verbally in the local language, and participants had the right to refuse to participate in the study.
To ensure participants’ privacy and confidentiality, all data collected from the participants was coded, and no identifying information was collected. The researcher did not collect any personal or identifying information. The study also ensured that there was no harm caused to the participants. They were provided with information about the study’s purpose and objectives, and any potential risks or adverse effects were communicated to the participants. Participants were assured that they have the right to withdraw from the study at any time. Moreover this, the study ensured that the sample was selected randomly to ensure equal representation of the study population. All participants had an equal chance of being selected to participate in the study.
Overall, the research was conducted with the utmost care and attention, making sure that the participants were not subjected to any harm, deceit, or coercion. The research results would not be used to harm the participants or others but will serve to provide insights into the effectiveness of the Productive Safety Net Program in Ethiopia.
3. Results and discussion
3.1. Descriptive statistics
Table illustrates that a mere 20.3% of households are involved in non-farm employment, indicating a dearth of viable livelihood alternatives beyond agriculture. This trend aligns with prior studies emphasizing agriculture’s dominance in rural Ethiopia (Alemu & Adugna, Citation2017; Negash, Citation2019). The scarcity of non-farm opportunities can intensify poverty and augment households’ susceptibility to shocks like droughts and disease outbreaks (Barrett et al., Citation2001). Furthermore, household heads in the study area possess an average of 3.9 years of schooling, with a standard deviation of 4.452, underscoring a prevalent illiteracy that curtails their ability to access information, make informed choices, and engage in basic non-agricultural activities (Hassen, Citation2017).
Table 2. RIMA domain indicators included in the study
Chi-square test shows that resilience level of households was divided into two with a cut-off value of 0.5 whereby households with a score above the cut-off are designated to be resilient. Accordingly, a comparison was made between PSNP members and non-members. The result in Table shows that the later are better-off compared to their counterparts. While 51.3% of the PSNP non-members are resilient, only 34% of the members are resilient. This association between level of resilience and PSNP membership is significant at 1% level (Pearson Chi2(1) = 9.2115 and Pr = 0.002).
Table 3. Mean difference between PSNP members and non-members
In addition to chi-square test, independent samples ttest was done to examine the mean difference between PSNP members and non-members against outcome variables of interest. Table highlights a notable difference in monthly per capita food expenditure between households who are members of the Productive Safety Net Program (PSNP) and those who are not. The data reveals that non-PSNP households have a higher monthly per capita food expenditure than PSNP members, with a difference of 30%. This finding suggests that non-PSNP households have better access to economic resources and opportunities, which enable them to purchase more food and improve their food security status.
The difference in food expenditure between PSNP members and non-members may be attributed to the transfer value of the PSNP. The transfer value of the PSNP is relatively small and may not be enough to cover all the food needs of households (Alderman & Yemtsov, Citation2014). Additionally, the transfer value is subject to delays and interruptions, which may affect the ability of households to purchase food consistently (Devereux & Sabates-Wheeler, Citation2004).
Conversely, non-PSNP households may have better access to income-generating activities, such as off-farm work or remittances, which increase their income and purchasing power (Alemu & Adugna, Citation2017). This finding highlights the need for promoting livelihood diversification and income-generating activities as a means of improving food security in rural areas of Ethiopia. Moreover, the data shows that non-PSNP households have higher resilience scores than PSNP members, with a difference of almost 0.1 point. This finding suggests that non-PSNP households are better equipped to withstand shocks and stresses, such as droughts, floods, or other economic hardships, than PSNP members. This could be due to their higher level of assets, livestock ownership, or access to other income-generating activities (Desta et al., Citation2017).
These findings have significant implications for the design and implementation of safety net programs, such as PSNP, in Wolaita Zone, Southern Nations, Nationalities and Peoples Region (SNNPR), Ethiopia. It may indicate the need for PSNP to be re-evaluated and adjusted to ensure that it is reaching the most vulnerable households and providing adequate support to improve their food security and resilience.
Overall, Table provides compelling evidence of a significant difference in monthly per capita food expenditure between PSNP members and non-members, with non-PSNP households spending more on food. Policymakers should consider these findings when designing interventions aimed at reducing food insecurity in rural areas of Ethiopia.
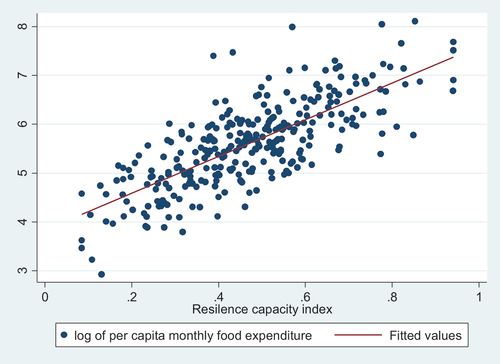
Figure displays a positive relationship between household resilience levels and monthly per capita food expenditure in Wolaita Zone, SNNPR, Ethiopia. This finding suggests that as household resilience levels increase, so does their ability to purchase more food and improve their food security. This relationship between resilience and food expenditure has also been observed in other studies, which goes in tandem with the findings in our study. For instance, a study by Yimer et al. (Citation2020) in Ethiopia found that households with higher resilience levels were more likely to have higher food expenditure and better dietary diversity. Another study by Sibhatu and Qaim (Citation2018) found a positive association between household resilience and food security outcomes in Ethiopia, as well as in other African countries.
Figure 2. Scatter diagram showing the relationship between resilience and monthly per capita food expenditure.
According to the results of the structural equation modelling presented in Table , the path coefficient from assets to resilience is positive and statistically significant at a level of significance of 1%. Similarly, the coefficients for access to basic services, social safety nets, assets, and adaptive capacity are positive and significant at a 5% level. These findings suggest that households with higher levels of access to basic services, social safety nets, assets, and adaptive capacity are more likely to be resilient to food insecurity in the study area. This is consistent with previous research on household resilience to food insecurity, as noted by Bezabih and Bezabih (Citation2021) and Fanzo et al. (Citation2018).
Table 4. RIMA II MIMIC determinants and indicators
Resilience, as a latent variable, has been extensively studied in the literature. It is widely acknowledged that it is a complex construct that includes multiple factors that contribute to a household’s ability to withstand and recover from shocks and stresses (Bezabih & Bezabih, Citation2021; Fanzo et al., Citation2018). The findings of this study indicate that adaptive capacity, social safety nets, access to basic services, and assets are all significant predictors of resilience. Specifically, assets are found to have a strong positive impact on resilience, and this effect was statistically significant at the 1% level, while the other factors were significant at the 5% level.
Adaptive capacity refers to a household’s ability to adapt to changing circumstances and is influenced by factors such as education, skills, and knowledge (Bezabih & Bezabih, Citation2021). Social safety nets, which are programs or mechanisms that provide assistance to vulnerable households during crises, such as cash transfers, food aid, or public works programs, play an essential role in enhancing households’ resilience (Fanzo et al., Citation2018). Moreover, access to basic services, such as health care, education, and clean water, is a vital predictor of resilience as it enables households to meet their basic needs and better cope with shocks (Bezabih & Bezabih, Citation2021).
Lastly, assets, including land, livestock, and savings, are crucial predictors of resilience as they provide households with a buffer against shocks and can be used to generate income or as a means of exchange (Fanzo et al., Citation2018). Furthermore, the possession of assets provides households with greater flexibility and freedom to make decisions, thereby reducing their vulnerability to shocks.
In addition to the aforementioned results, the study (Table ) also found that resilience acts as a mediator variable that significantly affects both monthly per capita consumption and household dietary diversity in the study area. This implies that households with higher levels of resilience are more likely to have better food consumption patterns and dietary diversity. These findings are consistent with previous research on the relationship between resilience and food security (Dillon et al., Citation2015; Tesfaye et al., Citation2016), which has shown that resilient households are better able to cope with food insecurity and maintain adequate food consumption.
The concept of resilience has been linked to food security in various ways, and it is generally agreed that resilience is a critical factor in achieving food security (Dillon et al., Citation2015; Tesfaye et al., Citation2016). Resilient households are better equipped to cope with shocks and stresses, including those related to food insecurity, and they are more likely to maintain their food consumption patterns and dietary diversity. This is because households with higher levels of resilience have better access to resources, including social safety nets, assets, and adaptive capacity, which enable them to mitigate the impacts of shocks and stresses (Dillon et al., Citation2015; Tesfaye et al., Citation2016).
The structural model on the top panel of Table shows the correlates of resilience. All coefficients are found to be statistically highly significant and have the expected sign. Better access to basic services, greater access to assets, better access to household transfer payment and higher degree of adaptive capacity influences the resilience capacity of households positively. The central panel on the other hand shows the link between the latent variable (RCI) and its indicators. The coefficient of per capita food expenditure is standardized to one to make the coefficient of household dietary diversity score interpretable. We find that a unit increase in the RCI results in a 2.02 (0.41) increase in the standard deviation of HDDs.
The lower panel in Table summarizes the adequacy of the model and indicates that the chi-square value is significant at the 1 percent level, and the root mean square estimate (RMSEA) is 0.05 (with a p-value of 0.000). The comparative fit index (CFI) and The Tuker-Lewis index (TLI) are quite high which is an indication of a good model fit.
As evident in Table , we control for certain explanatory variables to understand their relationship to resilience indicators following a beta regression analysis. Table highlights the significant influence of household characteristics on resilience capacity. The findings paint an interesting picture revealing the fact that female-headed households show a lower correlation of 16.3% with improved resilience capacity than male-headed households. Household size reduces resilience capacity by 0.08. This could be because of low support ratio at household level owing to high unemployment in Ethiopia. On the other hand, as Table shows, education of the household head (Literate) boasts a coefficient of 0.31, implying a significant positive relationship with a higher resilience index. Engagement in non-farm income activities has a positive and significant coefficient of 0.19, indicating higher involvement in non-farm activities leads to a heightened resilience index.
Table 5. Results of the beta regression model (soruce: analysis from data set)
Table further indicates that engagement in off-farm activities significantly reduces resilience capacity by 0.35. This could be because off-farm activities in the Ethiopian context are exploitative of the environment leading to degradation of the resource base. Conversely, participation in productive safety net program corresponds to a positive and significant coefficient of 0.18, suggesting a meaningful connection to an increased resilience index. In the same line, households with a higher asset index and access to credit have a positive and significant coefficient of 2.16 and 2.33e-05, respectively signifying enhanced resilience. Finally, crop failure and farming as an occupation correspond with reduced resilience levels of 0.14 and 0.16, respectively.
The overall model results showing log likelihood of 190.37, a likelihood ratio Chi-squared statistic (LR Chi2) of 207.34, and a corresponding p-value of 0.000, underscore the model’s overall significance in explaining resilience index variability.
4. Conclusions and implications for policy
The study was aimed to examine households’ resilience to climate change and food insecurity in Ethiopia. Using cross-sectional data and utilizing both Structural Equation (SEM) and Beta regression models, this study delves into the intricate factors that influence household resilience to food insecurity within a specific region.
The findings underscore the substantial contribution of various factors to household resilience. Notably, access to basic services, social safety nets, assets, and adaptive capacity exhibit statistically significant and positive correlations with resilience, corroborating prior research and emphasizing their pivotal role in enabling households to navigate and recover from challenges. Of particular significance is the robust influence of assets on resilience, demonstrating a notably strong positive impact. Equally vital, adaptive capacity—nurtured through education and skill acquisition—emerges as a cornerstone. The tangible role of social safety nets, encompassing cash transfers and food aid, in enhancing households’ crisis-coping capabilities is evident. Additionally, access to fundamental services like healthcare and clean water emerges as indispensable for meeting basic needs and bolstering shock resilience.
Crucially, resilience is unveiled as a mediator, fostering favorable outcomes in monthly per capita consumption and household dietary diversity. This underscores the tangible, real-world implications of resilience, solidifying its importance beyond theoretical constructs and emphasizing its role in food security.
The implications derived from this analysis pave a clear path for actionable policy strategies on the role of productive safety net programs. Customized interventions aimed at vulnerable groups, enhanced education, fortification of social safety nets, asset fostering initiatives, diversified income streams, and agrarian advancement present concrete avenues to fortify household resilience. These measures encapsulate the multi-dimensional nature of resilience and advocate for comprehensive strategies that address the interwoven factors influencing household well-being. More importantly, the study’s broader significance lies in its potential to guide policy formulation, program design, and resource allocation, extending beyond the immediate study area. By discerning the intricate relationships between adaptive capacity, basic service accessibility, social safety nets, assets, and resilience, policymakers can lay the groundwork for fostering resilient households. This study stands as a pivotal cornerstone for evidence-driven decision-making, contributing to the collective mission of bolstering food security, diminishing vulnerability, and enhancing the quality of life for households across diverse contexts.
Based on the results of this study, policymakers and practitioners can consider the following policy implications:
Improve access to basic services: Access to basic services, such as clean water, health care, and education, was found to be a significant predictor of household resilience to food insecurity. Therefore, policymakers should prioritize efforts to improve access to basic services, particularly in rural areas, where access is often limited.
Strengthen social safety nets: Social safety nets, such as cash transfers and food assistance programs, were also found to be important predictors of household resilience. Policymakers should strengthen and expand social safety nets to provide a safety net for vulnerable households, particularly during times of shocks and stresses.
Increase access to assets: The study found that households with greater assets were more resilient to food insecurity. Therefore, policymakers should focus on increasing access to assets, such as land, livestock, and savings, particularly for vulnerable households.
Build adaptive capacity: Adaptive capacity, or the ability to adapt to changing circumstances, was also found to be a significant predictor of household resilience. Policymakers should focus on building the adaptive capacity of vulnerable households, particularly through education and training programs that build skills and knowledge.
Promote resilience-building programs: The study found that resilience is a critical factor in achieving food security. Therefore, policymakers and practitioners should focus on promoting resilience-building programs, particularly in vulnerable communities. Such programs can include training on sustainable agriculture practices, disaster risk reduction, and climate change adaptation.
Overall, the findings of this study highlight the importance of building resilience in efforts to improve food security in Wolaita zone, Ethiopia. Policymakers and practitioners should consider these policy implications in designing and implementing policies and programs aimed at improving food security and reducing vulnerability to shocks and stresses.
Disclosure statement
No potential conflict of interest was reported by the author(s).
Additional information
Notes on contributors

Mesfin Getaneh Woldemichael
Mesfin Getaneh Woldemichael As a PhD candidate in rural development and a former research and evaluation specialist in a development non-governmental organization, my key research activities have focused on exploring the interplay between income, dietary diversity, and resilience in rural communities. In this particular paper, I investigate the mediating role of resilience in the context of rural Ethiopia and its impact on household dietary diversity. This research aligns with broader projects and issues related to sustainable development, poverty eradication, and food security. By understanding the pathways through which resilience can improve dietary diversity and contribute to poverty alleviation, this research aims to inform policymakers and development organizations about effective strategies for promoting social justice and sustainable development in vulnerable communities.
Bamlaku Alamirew
Dr. Bamlaku Alamirew Alemu has a Ph. D in Development Economics, over 10 years of experience in teaching and research. He is a Project Management Professional (PMP®). He has successfully led and managed multidisciplinary research teams and conducted both quantitative and qualitative analyses. He has rigorous analytic thinking skills and a solid work experience in conducting impact evaluations in fields related to agriculture, food and nutrition security, emergency and resilience. He has published several articles in international peer reviewed journals. He is also adept at guiding and mentoring junior researchers, evaluation officers and consultants in conducting researches using state-of-the-art methods.
Abenezer Wondwossen
Abenezer Wondwosen is working at the Ethiopian Strategy Support Program (ESSP) as a research Officer under the esteemed supervision of the International Food Policy Research Institute (IFPRI). With a bachelor’s degree in economics from Hawassa University and a master’s degree in economics from the University of Gondar, he possesses a strong academic foundation in his field. He has been actively engaged in conducting research and analysis, focusing on crucial areas such as rural poverty, resilience, nutrition, and agriculture. He has also developed special research skills in household survey coordination, data cleaning and econometric analysis. Through his work at ESSP, he strives to contribute to evidence-based policy formulation and implementation, aiming to improve the lives of individuals and communities in Ethiopia.
Notes
References
- Abay, K. A., & Abay, M. H. (2022). Guush Berhane c, Jordan Chamberlin. Food Policy, 112, 102367. Social protection and resilience: The case of the productive safety net program in Ethiopia. https://doi.org/10.1016/j.foodpol.2022.102367
- Adger, W. N., Dessai, S., Goulden, M., Hulme, M., Lorenzoni, I., Nelson, D. R., & Wreford, A. (2005). Are there social limits to adaptation to climate change? Climatic Change, 93(3–4), 335–17. https://doi.org/10.1007/s10584-008-9520-z
- Adgo, E., Solomon, A., & Teshome, A. K. (2021). Impacts of climate change and variability on livelihoods of rural communities: A review of Ethiopia. Environmental Development, 39, 100633. https://doi.org/10.1016/j.envdev.2021.100617
- Alderman, H., & Yemtsov, R. (2014). Productive safety nets and agriculture: Key gaps and remaining questions. Journal of Development Studies, 50(8), 1084–1095.
- Alemu, M. A., & Adugna, T. (2017). The role of non-farm income diversification in poverty reduction: Evidence from rural Ethiopia. Journal of Poverty Alleviation and International Development, 8(2), 63–84.
- Ayal, D. Y., Wale, T. A., & Gizachew, B. L. (2020). Climate variability and its impact on agricultural productivity in Ethiopia. Climate, 8(10), 117. https://doi.org/10.3390/cli8020029
- Barrett, C. B., Reardon, T., & Webb, P. (2001). Nonfarm income diversification and household livelihood strategies in rural Africa: Concepts, dynamics, and policy implications. Food Policy, 26(4), 315–331. https://doi.org/10.1016/S0306-9192(01)00014-8
- Bezabih, M. W., & Bezabih, Y. (2021). Assessing household resilience to food insecurity: The application of RIMA-II procedure in Ethiopia. Food Security, 13(1), 143–159.
- Carter, M. R., & Barrett, C. B. (2006). The economics of poverty traps and persistent poverty: An asset-based approach. The Journal of Development Studies, 42(2), 178–199. https://doi.org/10.1080/00220380500405261
- Cissé, J. D., & Barrett, C. B. (2018). Estimating development resilience: A conditional moments-based approach. Journal of Development Economics, 135, 272–284. https://doi.org/10.1016/j.jdeveco.2018.04.002
- Conroy, M. R. (2018). The RCSI sampling handbook. Technical report.
- Cribari-Neto, F., & Zeileis, A. (2010). Beta regression in R. Journal of Statistical Software, 34(1), 1–24. https://doi.org/10.18637/jss.v034.i02
- Desta, M., Osorio, M., & Schreinemachers, P. (2017). Household welfare and resilience to economic shocks: Evidence from rural Ethiopia. World Development, 96, 343–357. https://doi.org/10.1016/j.worlddev.2017.03.005
- Devereux, S., & Sabates-Wheeler, R. (2004). Transformative social protection. Institute of Development Studies (IDS) Bulletin, 35(4), 11–21. https://doi.org/10.1111/j.1759-5436.2004.tb00120.x
- Dillon, A., McGee, K., & Oseni, G. (2015). Agricultural production, dietary diversity, and climate variability. Journal of Development Economics, 51(8), 976–995.
- Fang, X., Fangchao, Y., Yang, G., & Youyang, Q. (2019). Regression analysis with differential privacy preserving. Proceedings of the IEEE Access (pp. 1–11). https://doi.org/10.1109/ACCESS.2019.2940714
- Fanzo, J., Hunter, D., Borelli, T., Mattei, F., & Schneeman, B. O. (2018). Diversifying food and diets: Using agricultural biodiversity to improve nutrition and health. Issues in agriculture, 24. Food and Agriculture Organization of the United Nations.
- FAO. (2018). Resilience for food and nutrition security. http://www.fao.org/3/I9553EN/i9553en.pdf
- FAO. (2020). Comparison of FAO and TANGO measures of household resilience and resilience capacity.
- FAO. (2021). Resilience index measurement and analysis cox’s bazar [round 1].
- Ferrari, S. L. P., & Cribari-Neto, F. (2004). Beta regression for modelling rates and proportions. Journal of Applied Statistics, 31(7), 799–815. https://doi.org/10.1080/0266476042000214501
- Fikru, B., Senapathy, M., Elias, B., & Temesgen, T. (2023). Rural household resilience to food insecurity and its determinants: Damot Pulasa district, Southern Ethiopia. Journal of Agriculture and Food Research, 11, 100500. https://doi.org/10.1016/j.jafr.2023.100500
- Food and Agriculture Organization of the United Nations. (2012). Building resilience for adaptation to climate change in the agriculture sector. Proceedings of a Joint FAO/OECD Workshop, 23–24 April,Rome, Italy.
- Food and Agriculture Organization of the United Nations. (2016). Dietary diversity score: A measure of nutritional adequacy. http://www.fao.org/3/a-i5486e.pdf
- Garbero, A., & Letta, M. (2022). Predicting household resilience with machine learning: Preliminary cross-country tests. Empirical Economics, 63(4), 2057–2070. https://doi.org/10.1007/s00181-022-02199-4
- Goldsmith, P. L. (1968). Review of elementary sampling theory., by T. Yamane. Journal of the Royal Statistical Society: Series C (Applied Statistics), 17(3), 296–296. https://doi.org/10.2307/2985656
- Hassen, N. (2017). The possible effect of Adult Functional Literacy Education on Farmer Production in Kersa Woreda, South-western Ethiopia. Global Journal of Human-Social Science: Sociology & Culture, 17(1).
- Kebede, T., et al. (2016). Econometric Analysis of Rural Households’ resilience to food insecurity in West Shoa, Ethiopia. Journal of Food Security, 4(3), 58–67.
- Kieschnick, R., & McCullough, B. D. (2003). Regression analysis of variates observed on (0, 1): Percentages, proportions, and fractions. Statistical Modelling, 3(3), 193–213. https://doi.org/10.1191/1471082X03st053oa
- Knippenberg, E., & Hoddinott, J. (2019). Shocks, social protection, and resilience: Evidence from Ethiopia. Frontiers in Nutrition, 6. https://doi.org/10.3389/fnut.2019.00109
- Ministry of Agriculture (MOA). (2020). Productive Safety Net Programme phase 5 (PSNP5) design document (2020 - 2025). Addis Ababa.
- Negash, M. (2019). Agricultural transformation and rural livelihood diversification in Ethiopia. Journal of Agricultural Extension & Rural Development, 11(5), 110–119.
- Papke, L. E., & Wooldridge, J. M. (1996). Econometric methods for fractional response variables with an application to 401 (k) plan participation rates. Journal of Applied Econometrics, 11(6), 619–632. https://doi.org/10.1002/(SICI)1099-1255(199611)11:6<619:AID-JAE418>3.0.CO;2-1
- Pingali, P., Aiyar, A., Abraham, M., & Rahman, A. (2005). Agriculture and rural development in a globalizing world: Challenges and opportunities. The World Bank.
- Schmid, M., Wickler, F., Maloney, K. O., Mitchell, R., Fenske, N., Mayr, A., & Gasparini, M. (2013). Boosted beta regression. PloS One, 8(4), e61623. https://doi.org/10.1371/journal.pone.0061623
- Sibhatu, K. T., & Qaim, M. (2018). Rural food security, subsistence agriculture, and seasonality. PLoS One, 13(10), e0206031. https://doi.org/10.1371/journal.pone.0186406
- Sibrian, R., d’Errico, M., Palma de Fulladolsa, P., & Benedetti-Michelangeli, F. (2021). Household resilience to food and nutrition insecurity in central America and the Caribbean. Sustainability, 13(16), 9086. https://doi.org/10.3390/su13169086
- Smithson, M., & Verkuilen, J. (2006). A better lemon squeezer? maximum-likelihood regression with beta-distributed dependent variables. Psychological Methods, 11(1), 54–71. https://doi.org/10.1037/1082-989X.11.1.54
- Tesfaye, W., Alemu, K., & Adane, T. (2016). Household food insecurity and associated factors in Ethiopia: Evidence from the 2011 Ethiopian demographic and health survey. BMC Research Notes, 9(1), 1–8. https://doi.org/10.1186/s13104-015-1837-x
- UNDP. (2014). Shock-responsive social protection systems: Primer for practitioners. http://www.undp.org/content/dam/undp/library/corporate/Inclusive%20development/Shock-Responsive%20Social%20Protection%20Systems.pdf
- UNDP. (2020). Ethiopia humanitarian situation report: August-September 2020. https://reliefweb.int/report/ethiopia/ethiopia-humanitarian-situation-report-august-september-2020
- Upton, J. B., Cissé, J. D., & Barrett, C. B. (2016). Food security as resilience: Reconciling definition and measurement. Agricultural Economics, 47(S1), 135–147. https://doi.org/10.1111/agec.12305
- World Bank. (2019). World development report 2019: The changing nature of work. https://openknowledge.worldbank.org/handle/10986/30432
- Wurzel, R. K. W., Radaelli, C. M., & Thompson, A. (2020). The impact of EU policies on environmental resilience: Towards a research agenda. Environmental Science & Policy, 106, 12–20. https://doi.org/10.1016/j.envsci.2020.02.005
- Yimer, F. E., Baye, K., & Desta, M. (2020). Household resilience, food security, and dietary diversity in Ethiopia. Ecology of Food and Nutrition, 59(1), 1–18. https://doi.org/10.1080/03670244.2019.1710337